Drawing Tools
- Utilitários
- Versão: 1.97
- Atualizado: 3 outubro 2026
- Ativações: 5

LMBF Drawing Tools
LMBF Drawing Tools is a fast, mouse-driven toolkit for placing precise rays, shapes and notes on MetaTrader 4 charts.
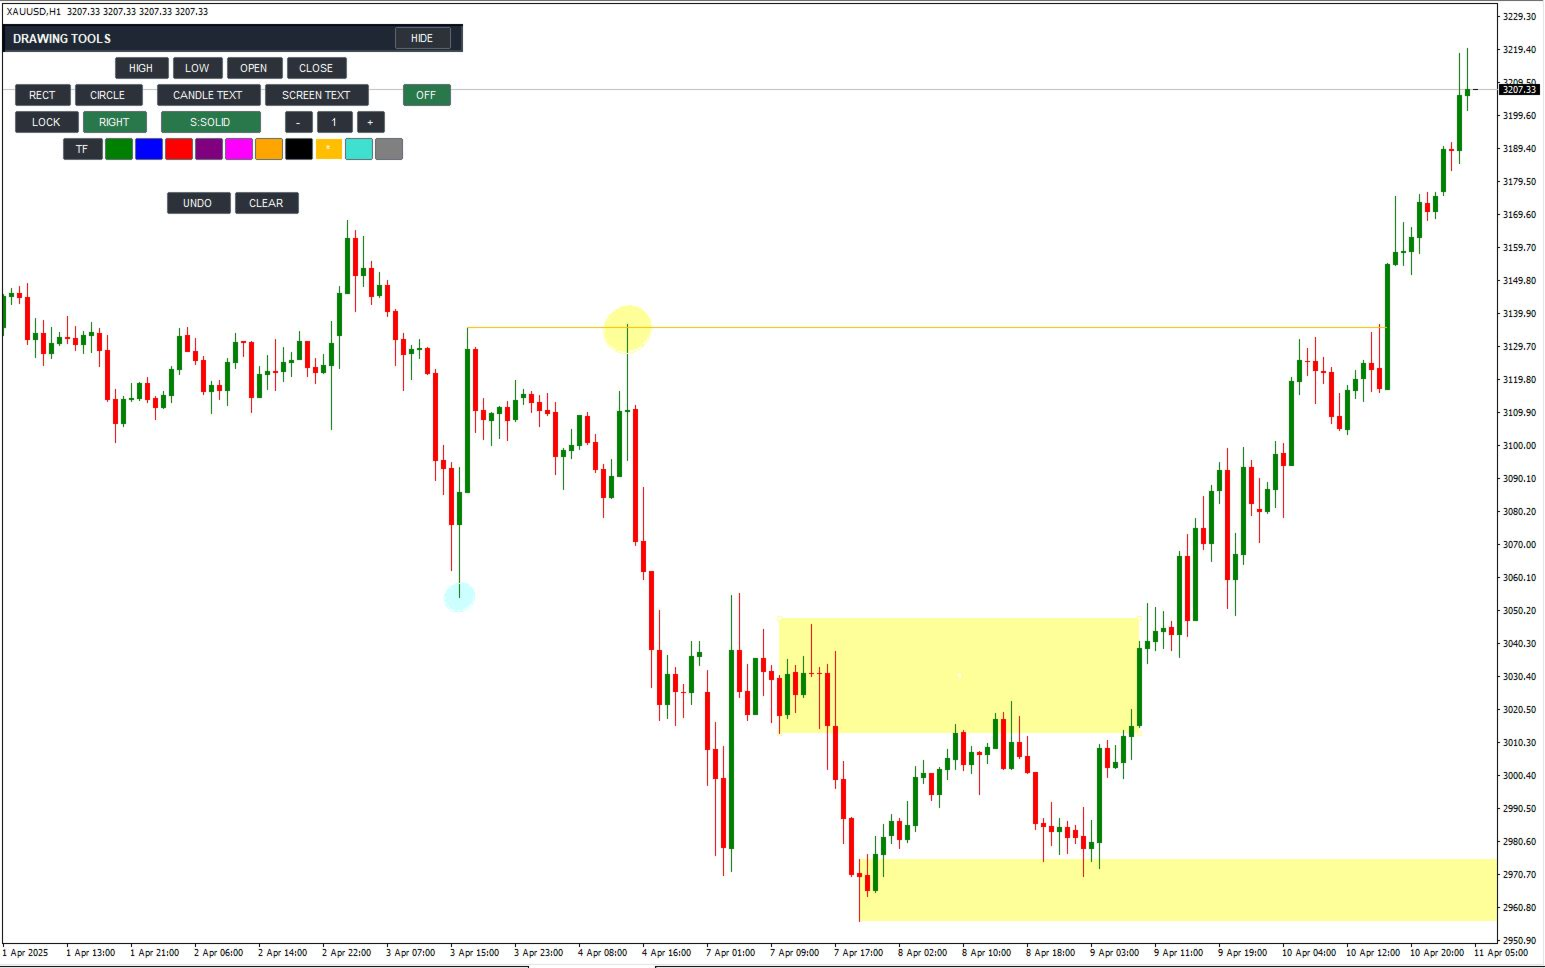
Marking a chart should be quick and accurate. LMBF Drawing Tools lets you select a drawing mode from a compact on-chart panel and then click directly on the chart. Rays can snap to the exact high, low, open or close of a candle. Rectangles, circles and two types of text annotation are also available from the same panel.
It is designed for chart analysis, planning, teaching and journaling. It creates standard MT4 objects, uses no DLLs and never opens, modifies or closes trades.
Main advantages
- Accurate candle-price selection: place a horizontal ray at the exact high, low, open or close of the candle you click.
- Fast mouse workflow: select a tool, click the chart and continue your analysis without opening MT4 object-property windows.
- Three ray endpoint choices: stop at a second point, stop when a completed candle body reaches the level, or project a long distance.
- Left or right direction: project rays and rectangles into future price action or back through chart history.
- Automatic timeframe colours: instantly see the timeframe on which a level was created.
- Clean chart layout: collapse the full panel to one small DRAW TOOLS button and move either the collapsed or expanded panel with the mouse.
Precise candle rays
Select HIGH, LOW, OPEN or CLOSE and click a candle. The new ray is placed at that candle's exact selected price. A small active-tool label follows the cursor so you can always see which action is waiting for a click.
Choose one of three endpoint methods:
- 2ND: the candle sets the price and a second click sets the exact time boundary.
- HIT BODY: the ray stops at the first completed candle whose open-to-close body reaches the ray price. If a right-facing ray has not yet been touched, the indicator continues checking newly completed candles.
- LONG: the ray continues across the chart in the selected direction.
The RIGHT/LEFT control applies to all new candle rays. Ray style can be cycled through solid, dash, dot, dash-dot and dash-dot-dot. Width can be changed from the panel by clicking minus or plus, or by typing a value from 1 to 5. MT4 displays patterned line styles at width 1; the selected width is retained for the next solid line.
Automatic and manual colours
New rays and text can use an automatic timeframe colour map. Defaults are MN1 green, W1 blue, D1 red, H4 purple, H1 magenta, M30 orange, M15 black, M5 amber and M1 turquoise.
All colours are configurable. The panel also offers manual colour swatches, and completed objects keep their original colour.
Rectangle tool
RECT creates a price zone from two candle selections. Click above or in the upper part of a candle to use its high, or below or in the lower part to use its low. The indicator compares both selected prices and automatically places the higher price at the top and the lower price at the bottom, regardless of click order.
Rectangles have three extension methods:
- 3RD: use a third click to set the exact time boundary.
- HIT BODY: extend until the first completed candle body overlaps the rectangle's price range.
- LONG: extend for a configurable number of years.
RIGHT and LEFT determine the extension direction. Rectangles use a separate palette of light colours so candles remain easy to see. The default fill is light yellow and is drawn behind the candles.
Circle tool
CIRCLE uses two clicks. The first click sets the centre. Move the pointer in any direction and click again to set the radius. A live preview follows the mouse before the second click.
The indicator measures the chart's horizontal and vertical pixel scales and corrects the native MT4 ellipse so that it appears as a circle rather than a flattened or stretched shape. Completed circles use the same light-colour palette as rectangles and behave as one drawing for moving, deleting, UNDO and CLEAR.
Text and annotation tools
- CANDLE TEXT: places a note at a candle time and chart price. The note moves naturally when the chart is scrolled.
- SCREEN TEXT: fixes a note to a position in the chart window while candles scroll underneath it.
Select a text mode, type the note and click the required position. Long text wraps automatically at word boundaries. Use the | character or the literal characters \n to force a new line. Wrapped lines are managed as one note, so UNDO, CLEAR or deleting one line removes the complete annotation.
Simple controls and object management
- LOCK: keeps the selected mode active for repeated drawings. With LOCK off, a completed drawing returns the tool to OFF.
- Right-click: cancels the active or unfinished drawing and returns the tool to OFF. Normal right-click behaviour is retained when no tool is active.
- UNDO: first cancels an unfinished selection; otherwise removes the most recently created object owned by this instance.
- CLEAR: removes all completed drawings owned by this instance.
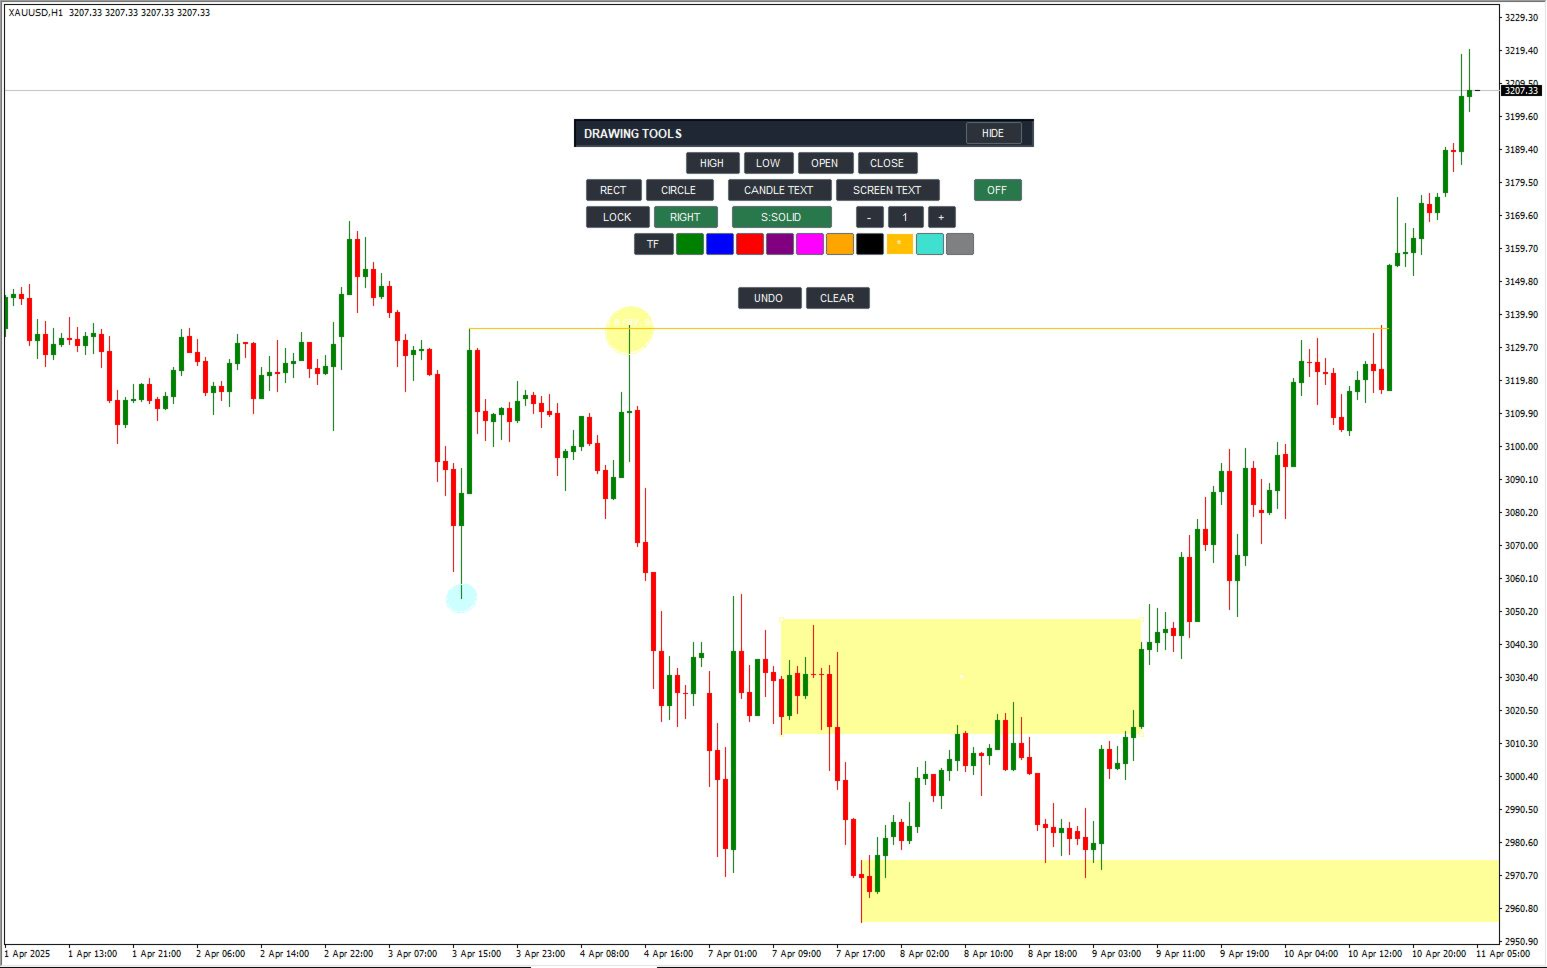
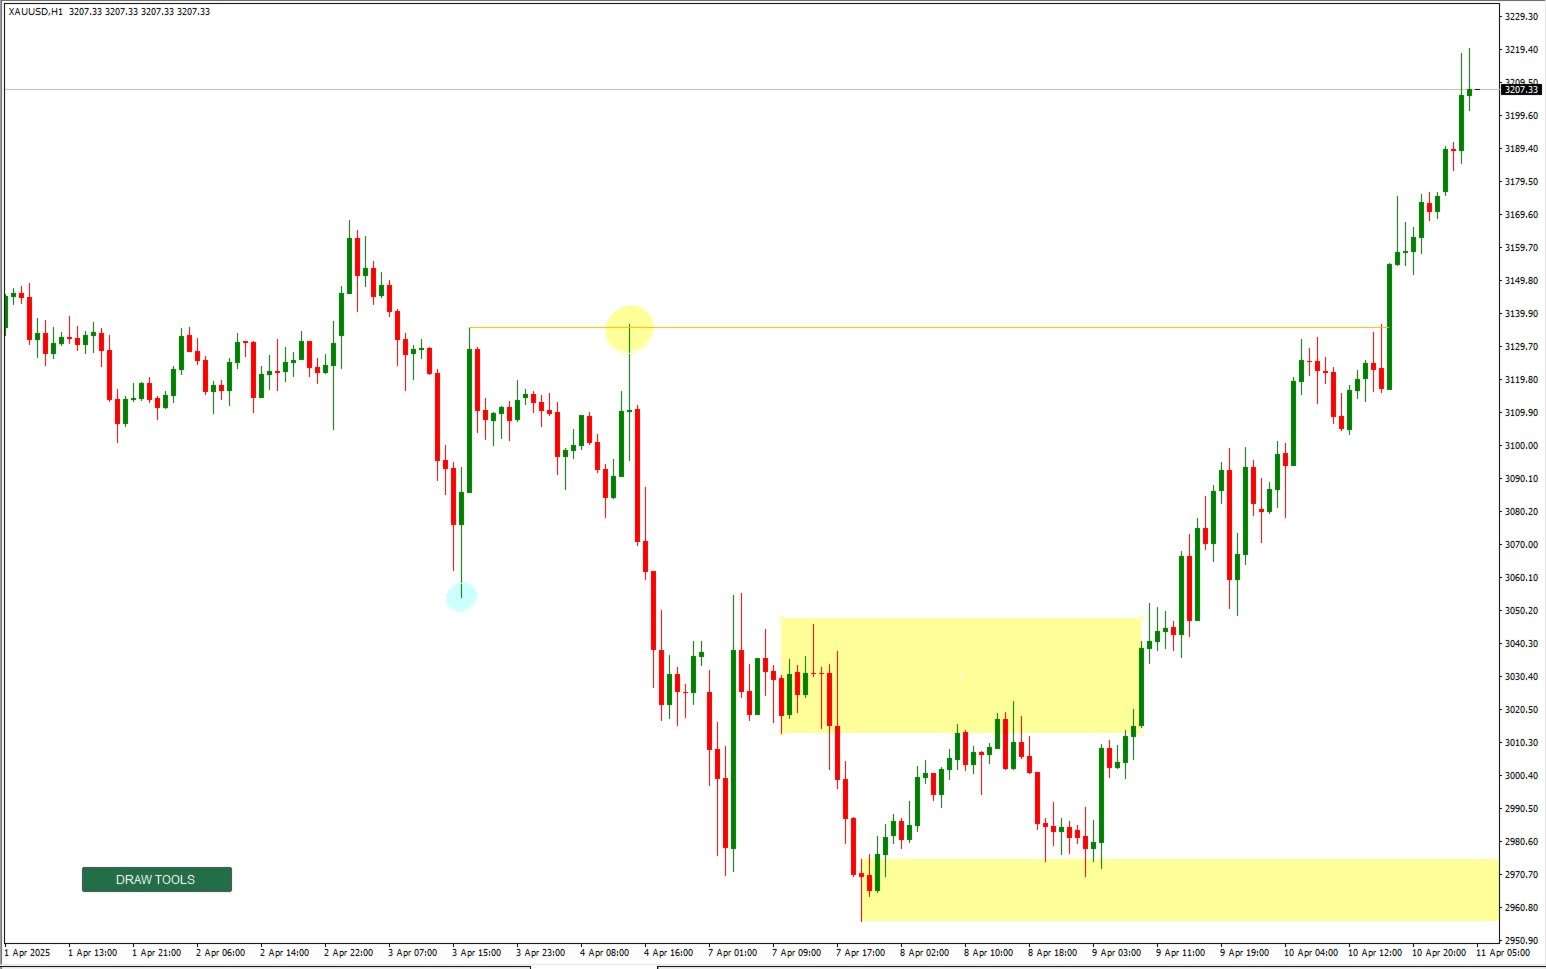
- HIDE: collapses the panel to one DRAW TOOLS button. The B key can also toggle the panel.
- Move: drag the expanded panel by its title area, or drag the collapsed DRAW TOOLS button. Chart scrolling is suspended only while a panel drag is taking place.
A new attachment starts collapsed to keep the chart clear. Panel visibility and position are retained when the chart symbol or timeframe changes. Multiple copies can be separated with different InstanceId values.
Input parameters
Ray appearance and behaviour
- InitialMode: drawing mode selected when the indicator loads. OFF is the recommended default.
- InitialLock: enables repeated-placement mode at startup when true.
- RayStyle: initial style for new rays: solid, dash, dot, dash-dot or dash-dot-dot.
- RayWidth: initial line and shape-border width. Values are limited to 1 through 5.
- UseTimeframeColorsInitially: uses the automatic timeframe colour map when true.
- InitialManualRayColor: initial manual colour used when automatic timeframe colours are disabled.
- StopAtCandleBodyInitially: compatibility option for older presets. When true, HIT BODY overrides the initial ray-extension choice.
- BodyRayRightInitially: selects RIGHT when true or LEFT when false for new rays and rectangles.
- InitialRayExtension: initial ray endpoint method: second point, candle-body contact or long projection.
- RayInBackground: places new rays behind chart candles when true.
- RaySelectable: allows completed objects to be selected and edited with normal MT4 controls.
- DeleteRaysOnRemoval: removes all drawings owned by this instance when the indicator is removed. When false, completed drawings remain on the chart.
Rectangle and circle appearance
- RectangleColor: initial light palette colour shared by new rectangles and circles.
- RectangleFilled: fills new rectangles and circles when true.
- RectangleInBackground: draws shape fills behind chart candles when true.
- InitialRectangleExtension: initial rectangle endpoint method: third point, candle-body contact or long projection.
- RectangleLongYears: extension length for LONG rectangles and the temporary projection used while HIT BODY waits for contact. Accepted range is 1 to 25 years.
- CircleScaleCorrection: optional correction for terminal or display scaling differences. The normal value is 1.0 and the accepted range is 0.5 to 2.0.
Text tools
- InitialText: initial note shown in the text-entry field.
- TextFontName: font used for new candle and screen text.
- TextFontSize: font size for new notes. Values are limited to 6 through 36.
- TextWrapCharacters: approximate maximum characters per automatically wrapped line. Values are limited to 8 through 120.
- TextLineSpacingPixels: vertical spacing between wrapped lines. Values are limited to 8 through 60 pixels.
- TextMaximumLines: maximum wrapped lines in one note. Values are limited to 1 through 50.
- TextInBackground: places new text behind other chart objects when true.
Timeframe colour map
- MN1RayColor: colour used for objects created on the monthly chart. Default: green.
- W1RayColor: colour used for objects created on the weekly chart. Default: blue.
- D1RayColor: colour used for objects created on the daily chart. Default: red.
- H4RayColor: colour used for objects created on the four-hour chart. Default: purple.
- H1RayColor: colour used for objects created on the one-hour chart. Default: magenta.
- M30RayColor: colour used for objects created on the 30-minute chart. Default: orange.
- M15RayColor: colour used for objects created on the 15-minute chart. Default: black.
- M5RayColor: colour used for objects created on the five-minute chart. Default: amber.
- M1RayColor: colour used for objects created on the one-minute chart. Default: turquoise.
- OtherTimeframeRayColor: fallback colour for any timeframe not listed above. Default: grey.
Toolbar appearance and instances
- InstanceId: unique identifier for object ownership. Use a different value for each independent copy on the same chart.
- ToolbarX: horizontal offset from the chart centre before the panel is moved manually.
- ToolbarY: initial distance from the top of the chart.
- ButtonHeight: height of the toolbar buttons. The effective minimum is 18 pixels.
- ActiveButtonColor: background colour of selected toolbar buttons.
- IdleButtonColor: background colour of inactive toolbar buttons.
- TitleBarColor: background colour of the expanded panel title bar.
- ButtonTextColor: colour of button captions and panel text.
- BorderColor: colour of panel and button borders.
- ActiveCursorColor: colour of the active-tool cursor label and temporary selection markers.
Important
LMBF Drawing Tools is a chart drawing and annotation utility. It does not analyse the market, recommend entries, guarantee results or manage trades. The user remains responsible for all trading and analysis decisions.