WaveMaster Oscilloscope
- Indicadores
- Syamsurizal Dimjati
- Versão: 1.0
WaveMaster Oscilloscope
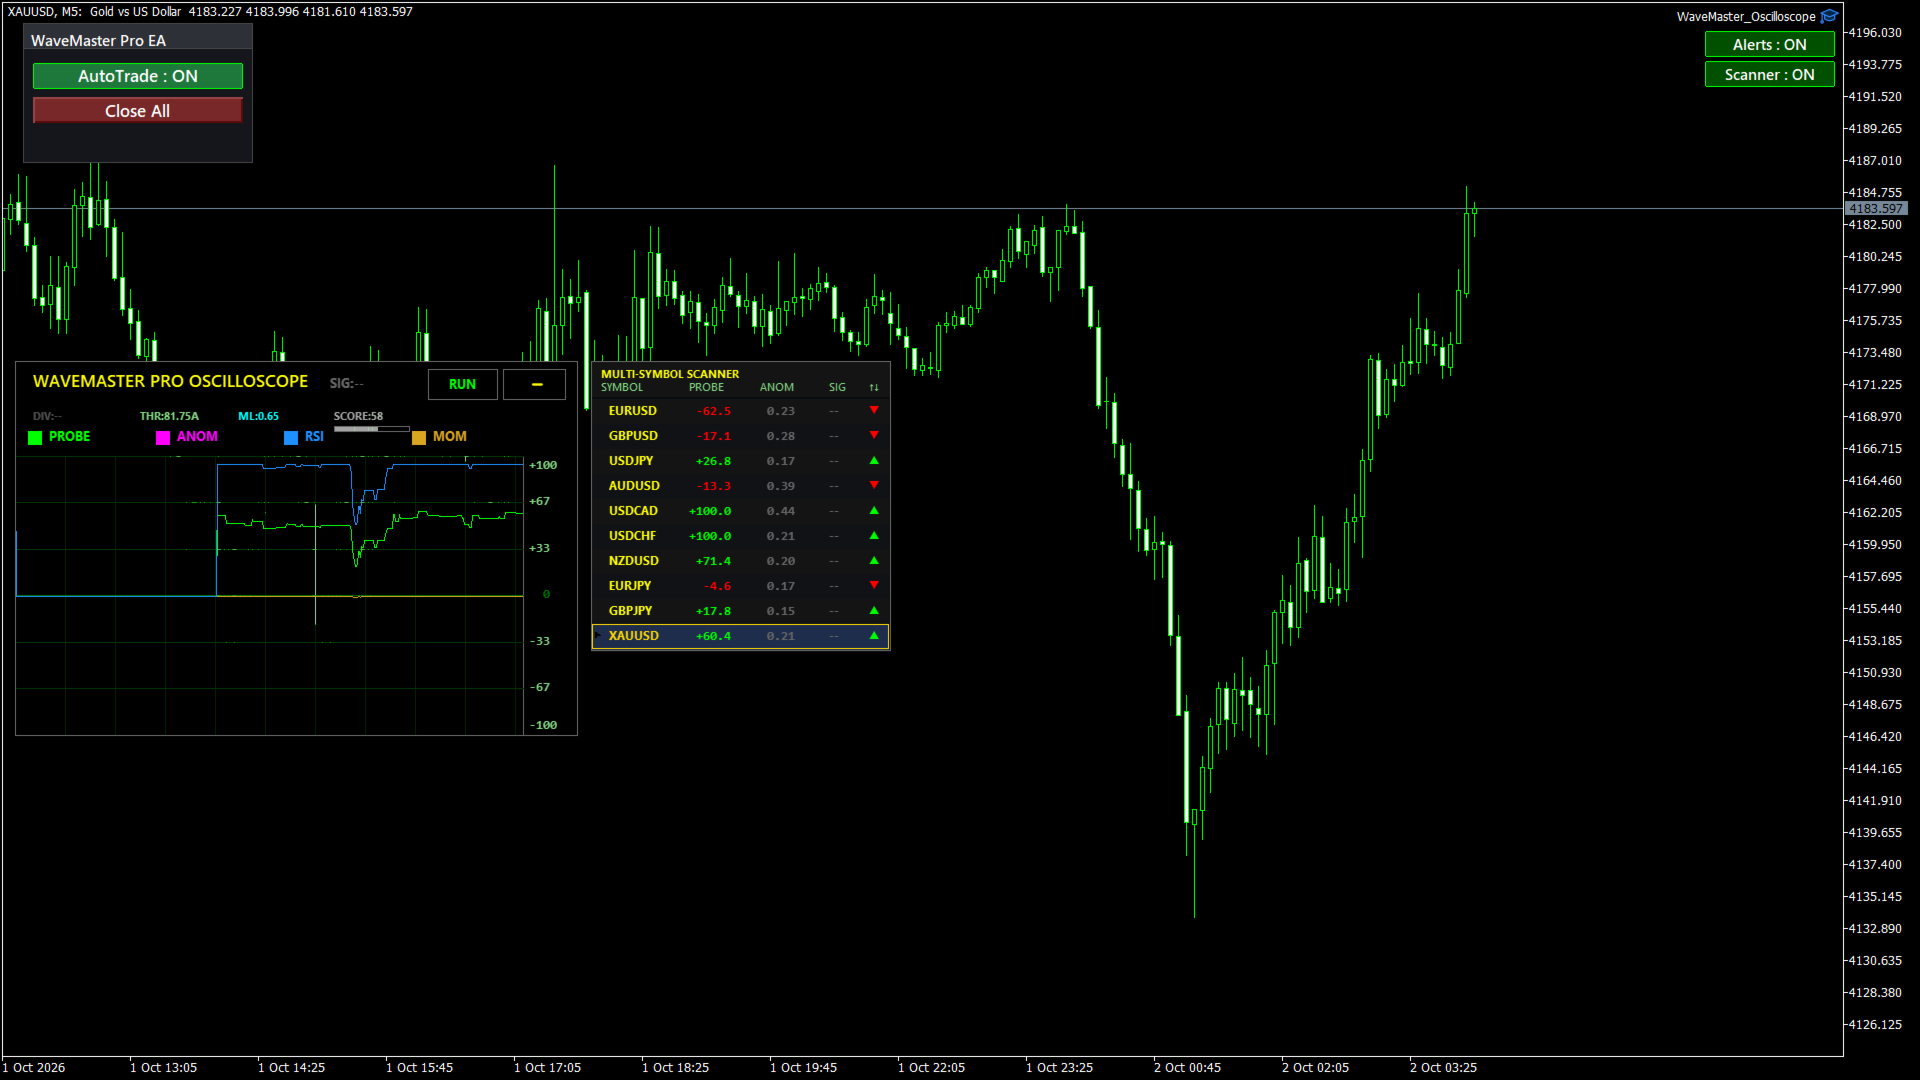
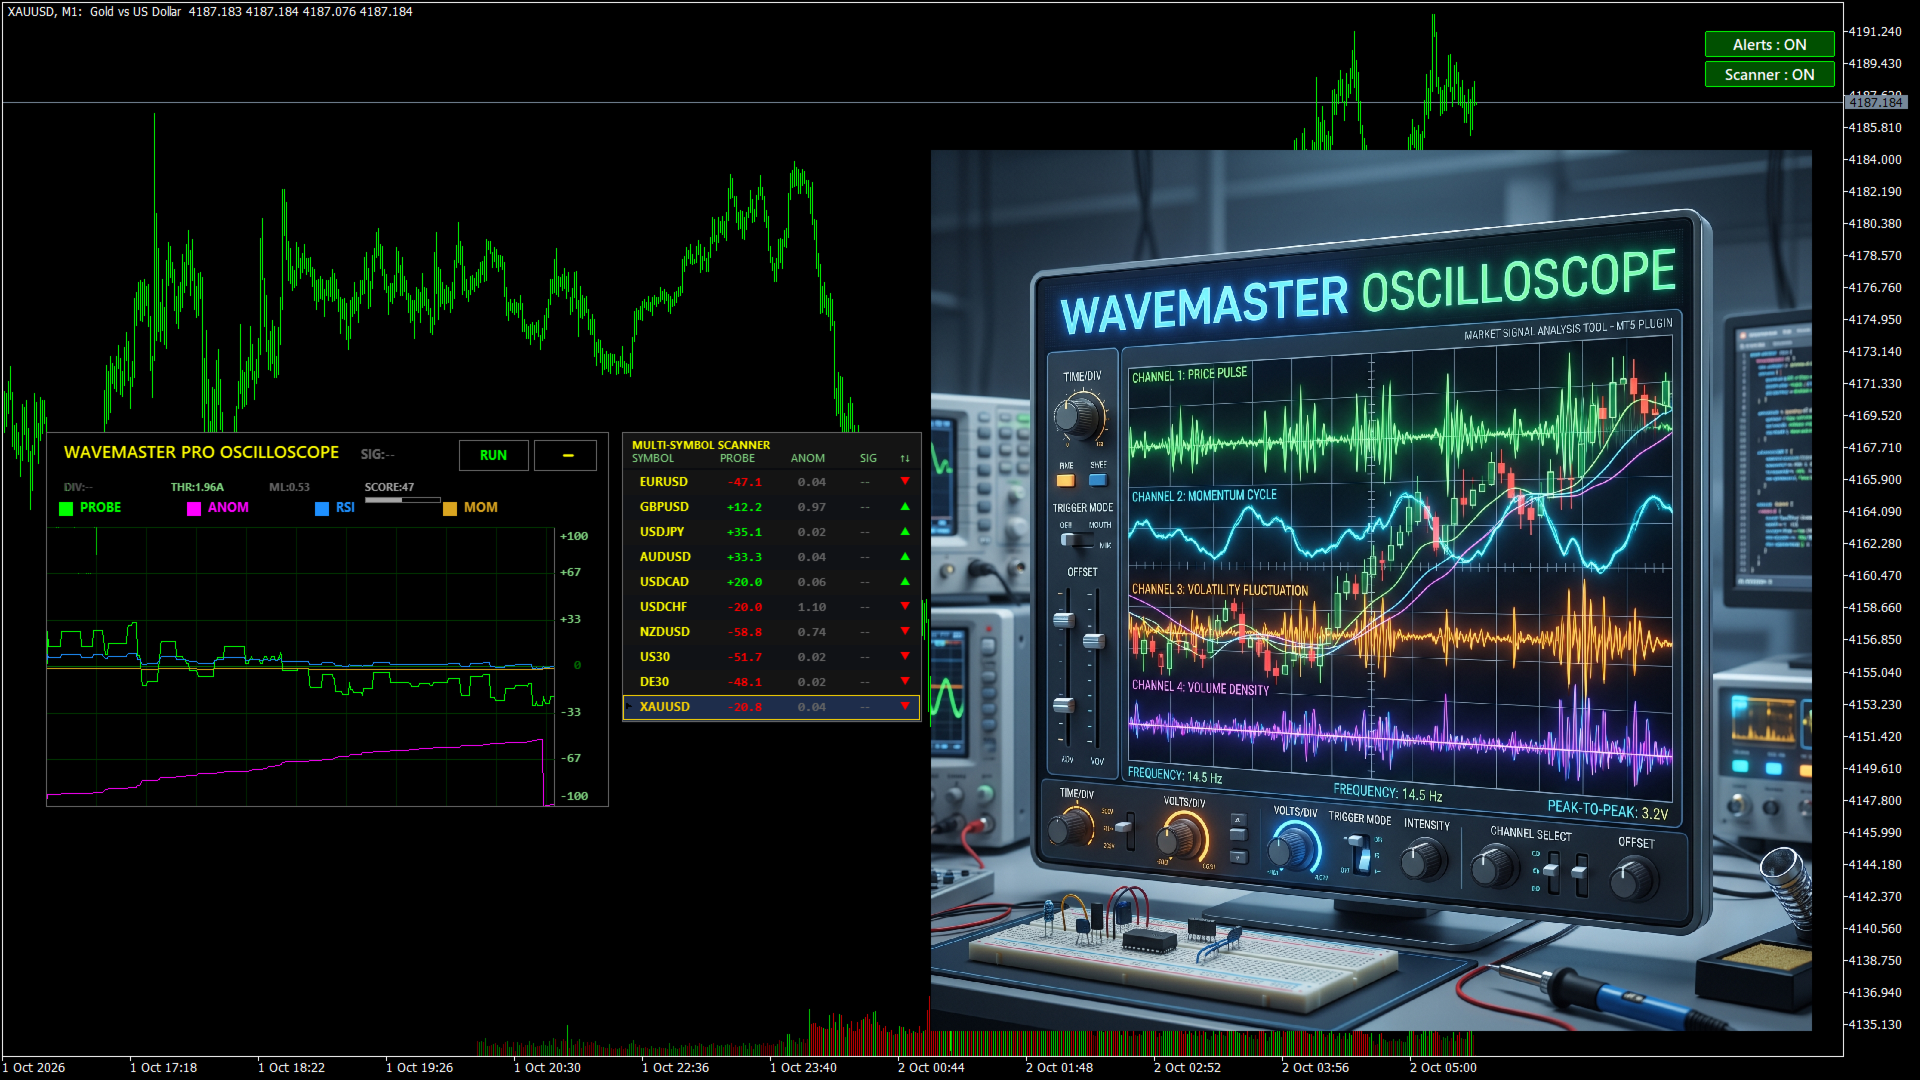
transforms your MT5 chart into a professional-grade oscilloscope - a precision instrument that converts market behavior into a live, multi-channel waveform. Instead of guessing what price is "doing," you simply watch it happen in real time.
Inspired by the signal-analysis tools used in advanced electronics laboratories, WaveMaster oscilloscope reads the pulse of the market and renders it as a beautiful, animated waveform directly on your chart.
This is not another line-following tool.
This is a market oscilloscope.
Four Channels. One Clear Picture.
| Channel | What It Reveals |
|---|---|
| PROBE | The live directional bias of price — where the market is truly leaning |
| ANOMALY | Sudden bursts of market energy — the moments that matter most |
| RSI | Momentum rhythm rendered as a waveform, not a cramped sub-window |
| MOMENTUM | Pure velocity of price — the heartbeat behind every move |
Each channel can be toggled on/off with a single click. Read them together, or isolate the one that speaks to you.
What Makes WaveMaster Oscilloscope Different
- Real-Time Signal Engine — the waveform updates on every tick, not on delayed refreshes. What you see is what the market is doing right now.
- Adaptive Intelligence — the trigger threshold self-adjusts to volatility. Quiet markets stay sensitive. Wild markets stay clean.
- Built-In Divergence Detector — spots hidden disagreements between price and momentum, automatically.
- FFT Spectrum Analysis — identifies the dominant cyclical rhythm hidden beneath the noise.
- Machine Learning Scoring — an onboard logistic model continuously learns from recent price behavior and delivers a live probability score.
- Signal Score Meter — a single 0–100 confidence gauge that fuses all channels into one crystal-clear number.
- Multi-Symbol Scanner — monitor up to 10 markets simultaneously in a compact side dashboard, with your active chart symbol highlighted for instant focus.
- Automatic Broker Symbol Resolution — works on any broker, with any symbol suffix, without configuration.
- Bloom-Free Volume Overlay — tick volume recolored by price action, showing strength and weakness at a glance.
A Dashboard Designed to Be Read
- Live crosshair readout — hover anywhere on the waveform to see every value at that exact moment
- Compact, draggable, minimize-ready — it fits your workflow, not the other way around
- HiDPI-aware — razor-sharp on any monitor, any scaling
- Retro-CRT aesthetic — a tool that feels as good as it works
Built for Automation — Free EA Included
WaveMaster Oscilloscope is not a closed box.
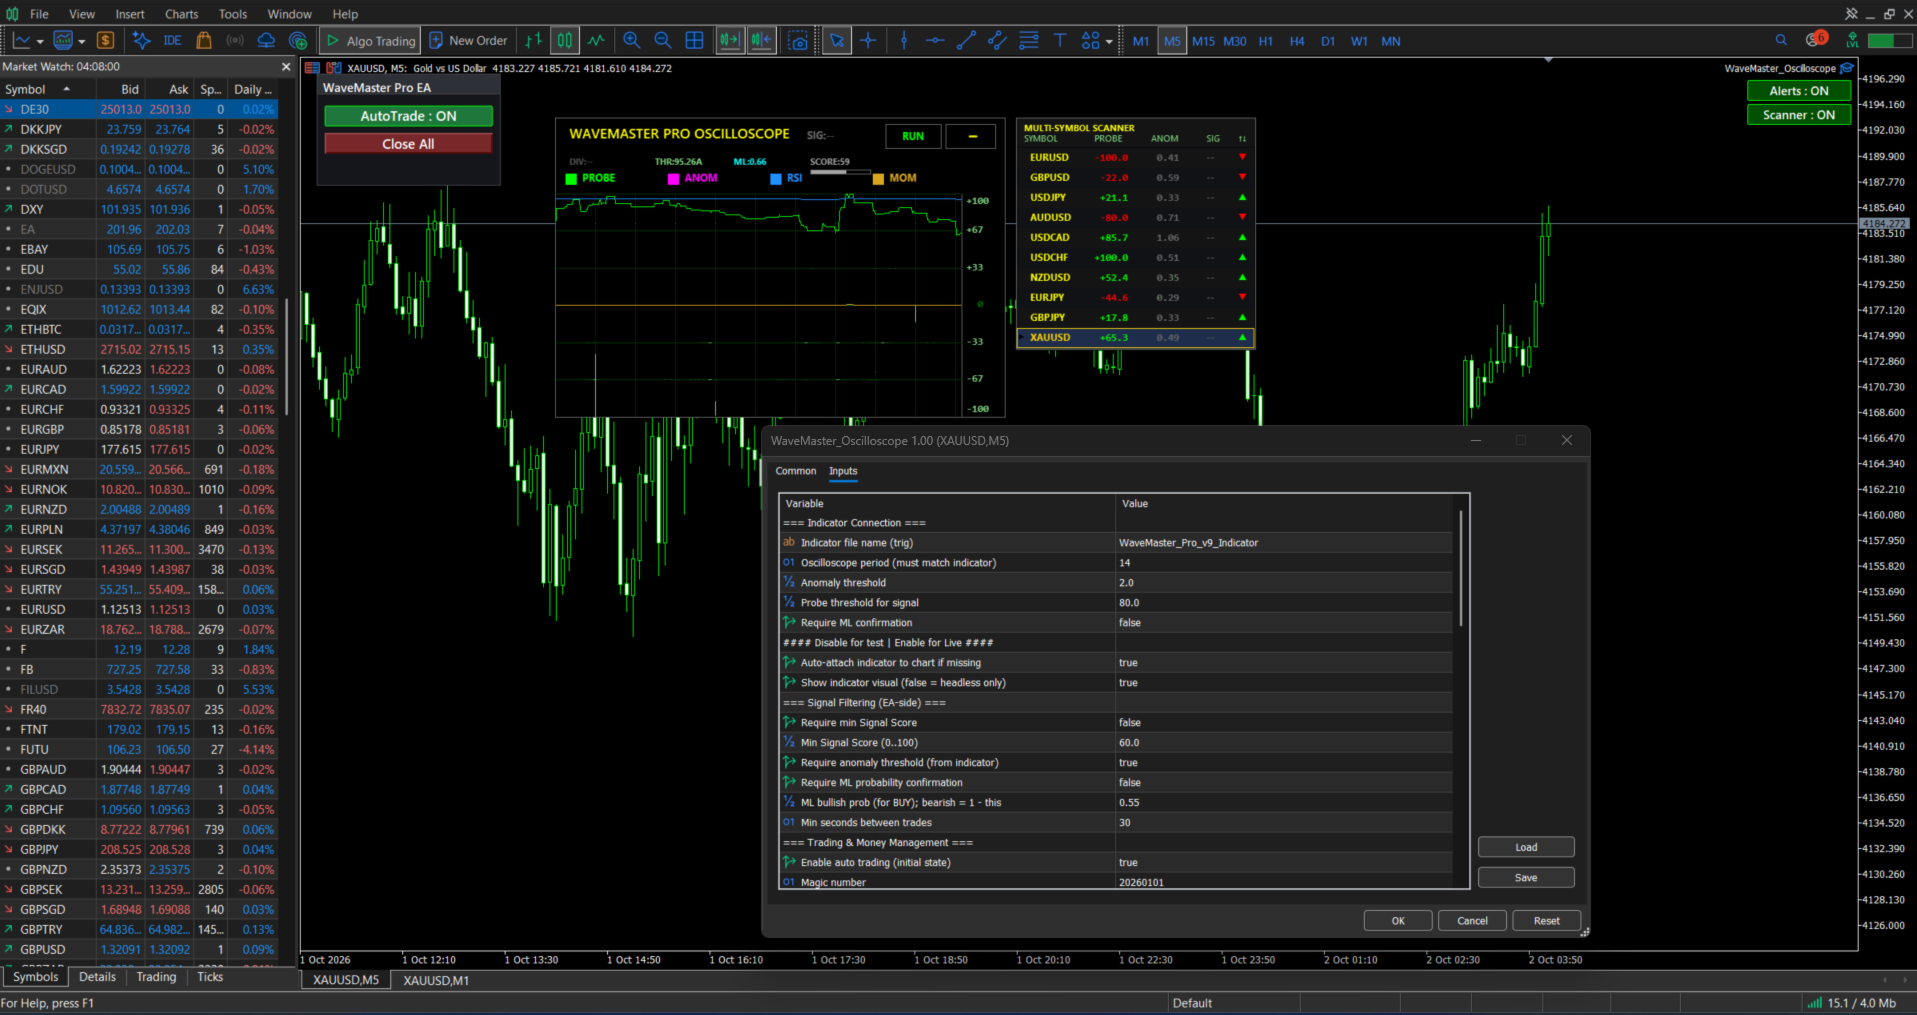
Every signal generated by the indicator is exported into a clean, structured buffer — readable by any Expert Advisor through the standard iCustom() interface.
To make things even easier, we are providing the complete source code of a ready-to-use EA absolutely free, so you can connect the indicator to live trading in minutes — no guesswork, no hidden fees, no black boxes.
Free EA Source Code: (Download The EA on Free codebase)
The EA supports:
- Automatic indicator detection and attachment
- Configurable risk management (fixed lot or % per trade)
- ATR-based or fixed SL / TP
- Break-even and trailing stop
- Daily trade and daily loss limits
- Full multi-session filters
- Built-in control panel with one-click AutoTrade toggle
Who Is This For?
- Discretionary traders who want to feel the market's rhythm, not just read numbers
- Quantitative traders who need clean signal buffers for their own systems
- Automation developers who want a professional indicator foundation with a working EA example
- Anyone tired of cluttered, lifeless sub-windows
The Bottom Line
WaveMaster Oscilloscope gives you something the market rarely offers: clarity.
Not another indicator.
Not another dashboard.
A precision instrument for reading the language of price — visual, live, intelligent, and ready to automate.
Welcome to WaveMaster Oscilloscope.
Watch the market. Understand the signal.