Smart Volume Zone
- Indicadores
- Versão: 2.11
- Atualizado: 22 agosto 2026
- Ativações: 5

Launch price: 30 USD - price will increase after the first purchases, so early buyers lock in this rate.
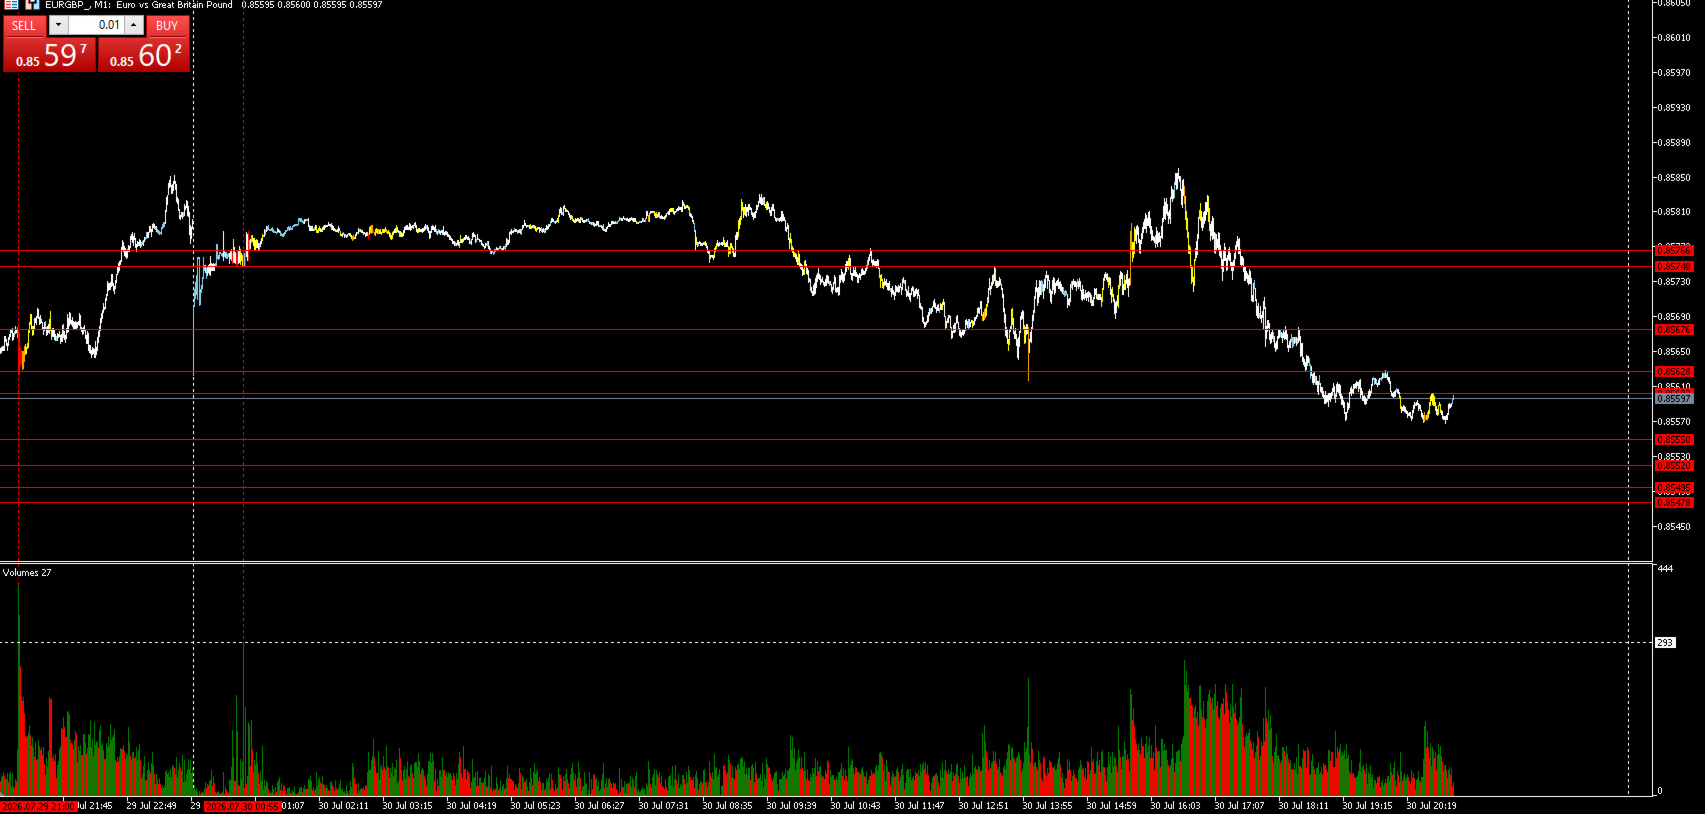
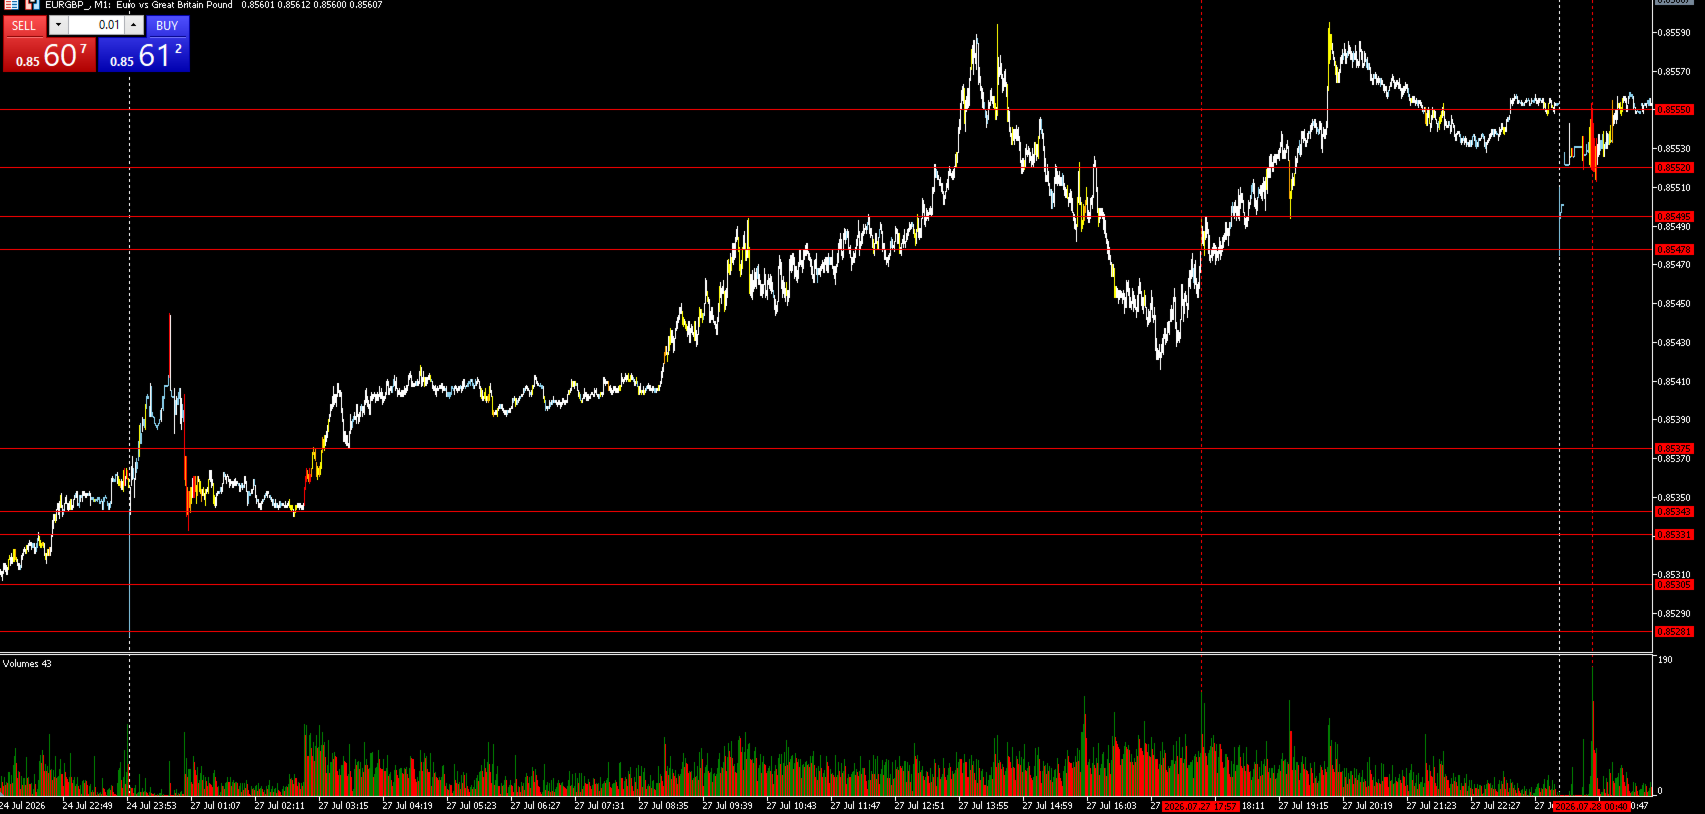
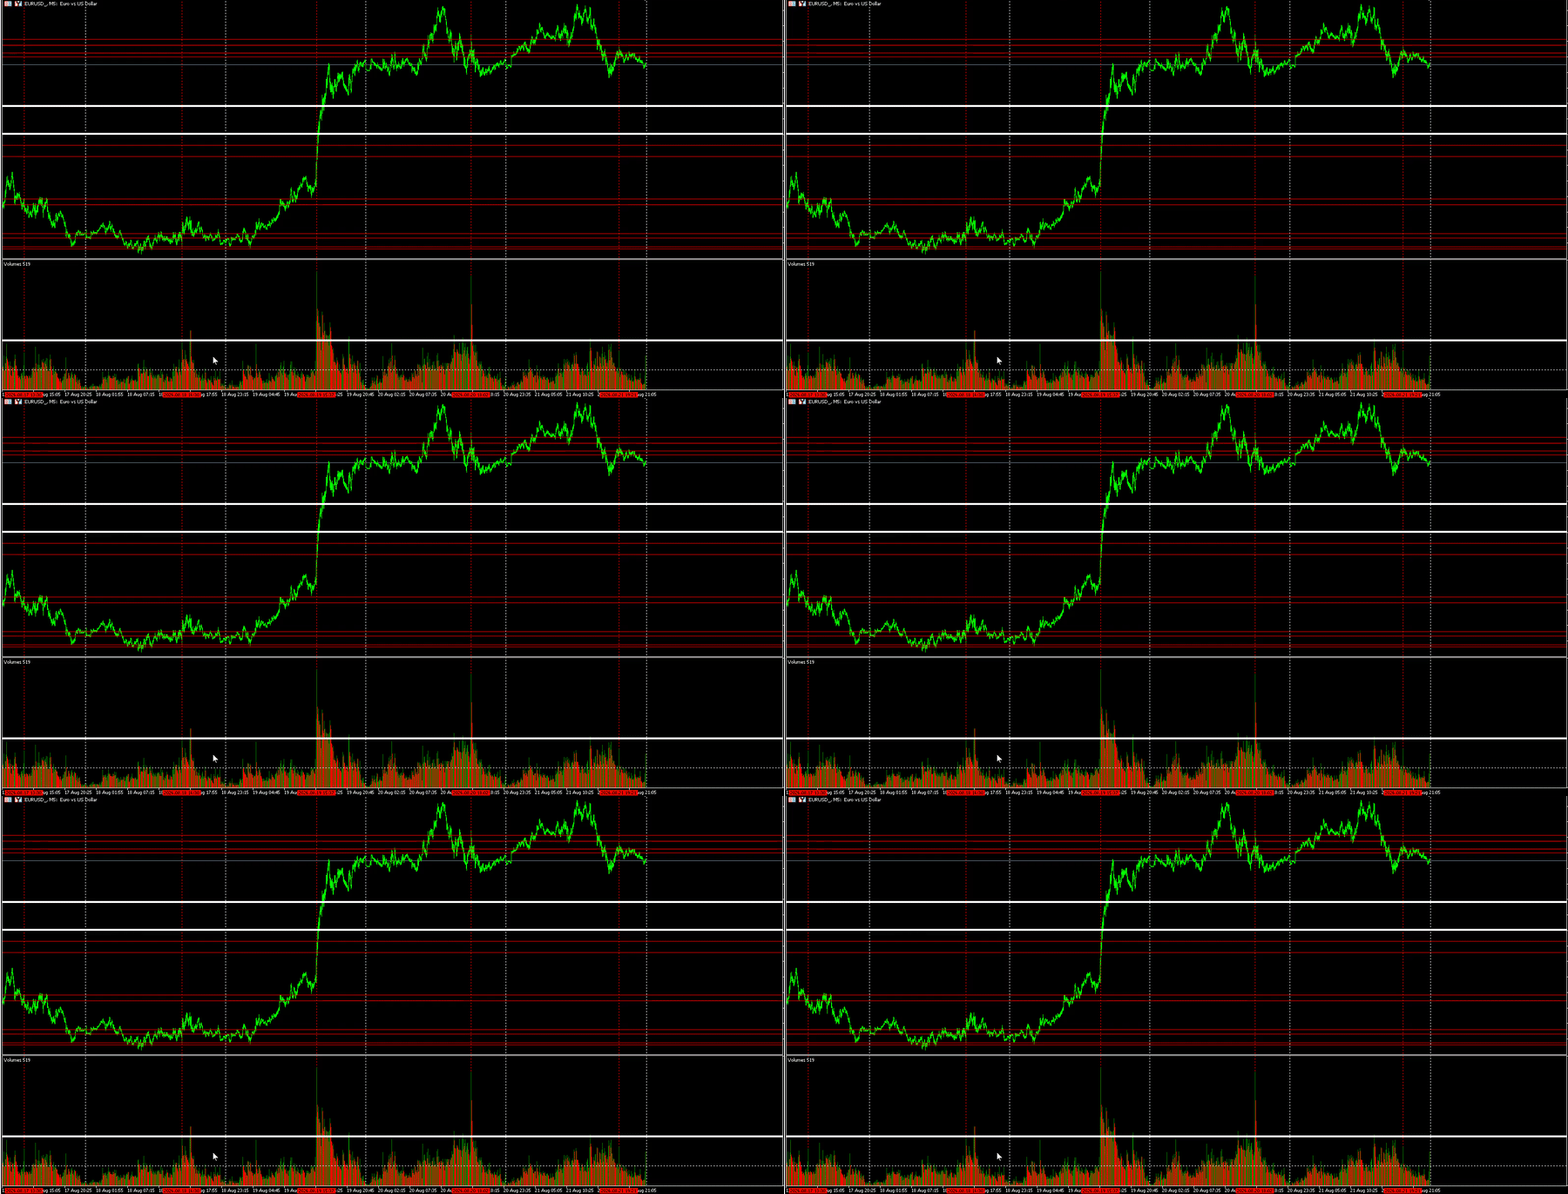
Smart Volume Zone marks the trading candle with the highest tick volume within the last N trading days (configurable, default 10) and highlights it directly in the terminal's native Volumes panel, with no separate window and no third-party dependency.
How it works: the indicator scans every M1 candle within each of the last N days, finds the single highest-volume candle per day, then compares across days to find the absolute highest volume in the whole period. That level is drawn as a solid horizontal line in the Volumes sub-window, making it easy to compare current activity against the recent extreme.
Features:
- Automatically opens the terminal's built-in Volumes panel if it is not already open, and closes it again on removal, but only if the indicator itself opened it. If the panel was already open, nothing changes.
- Line color, width and style are fully configurable via inputs.
- Works on any symbol, timeframe and account type.
- The marked level only updates going forward as new candles form.
How traders use it:
Unusually high volume can point to moments of strong market participation, often linked to news releases, session opens, or large orders entering the market. Comparing current volume against the recent high point set by this indicator helps gauge whether current activity is exceptional or ordinary.
This is a visual analysis tool. It does not open, modify or close trades.