Quant Analytics

Quant Analytics 

Short description (for the product summary field)

Quant Analytics turns your raw trade history into a full quantitative performance report — right inside MetaTrader 5. A dark, on-chart P/L calendar for daily use, plus a one-click HTML export with the same depth of analysis you'd expect from a dedicated trading journal: drawdown, Monte Carlo, Kelly, Omega, MAE/MFE, rolling Sharpe, and more.

Full description

See your trading the way a quant would — without leaving MetaTrader 5.

Most account-history tools give you a balance line and a win rate. Quant Analytics gives you an actual performance audit: every closed trade broken down by symbol, weekday, hold time, and direction, plus the risk-adjusted metrics that professional traders and prop firms actually look at.

On the chart:

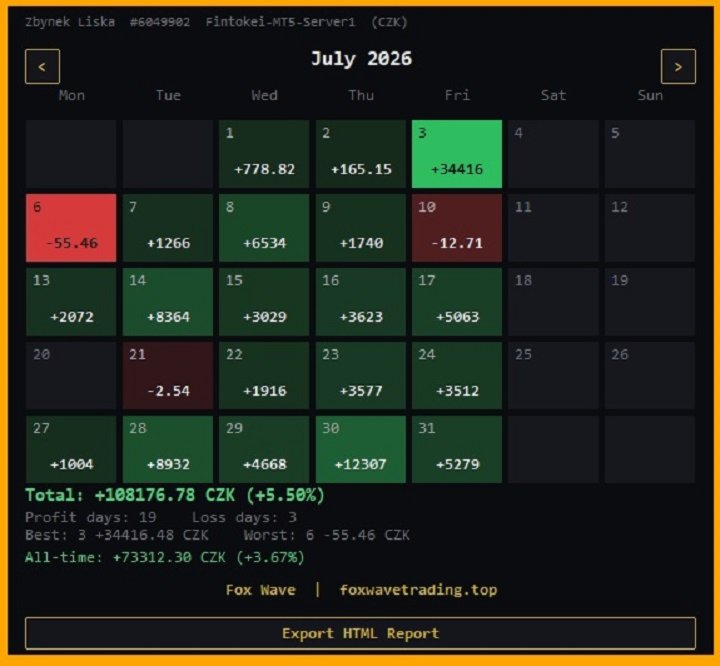
  • A clean, dark calendar panel showing daily P/L color-coded by size — green for profit days, red for losses, intensity scaled to how big the day was.
  • Month navigation with one click, panel auto-resizes to fit however many weeks the month needs.
  • Live summary: total P/L and %, profit/loss day counts, best/worst day, all-time P/L since your very first trade.
  • Starting capital is reconstructed correctly even for the account's founding month, when a deposit and the first trade don't land on the same day.

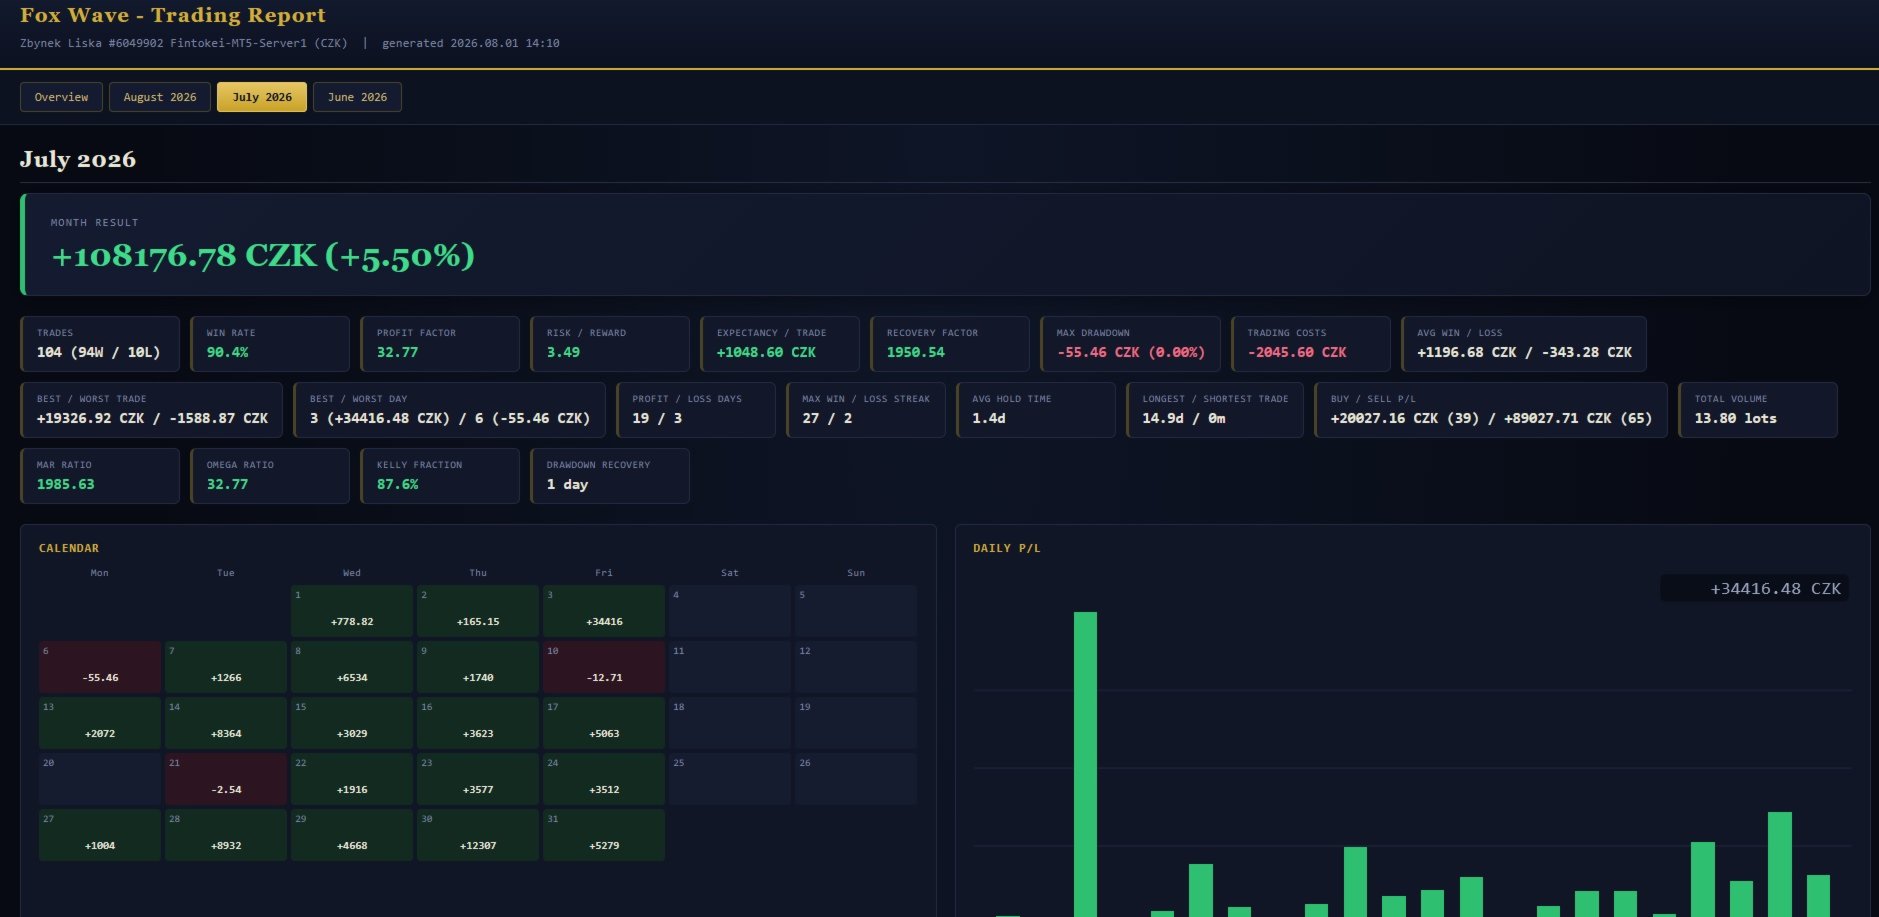
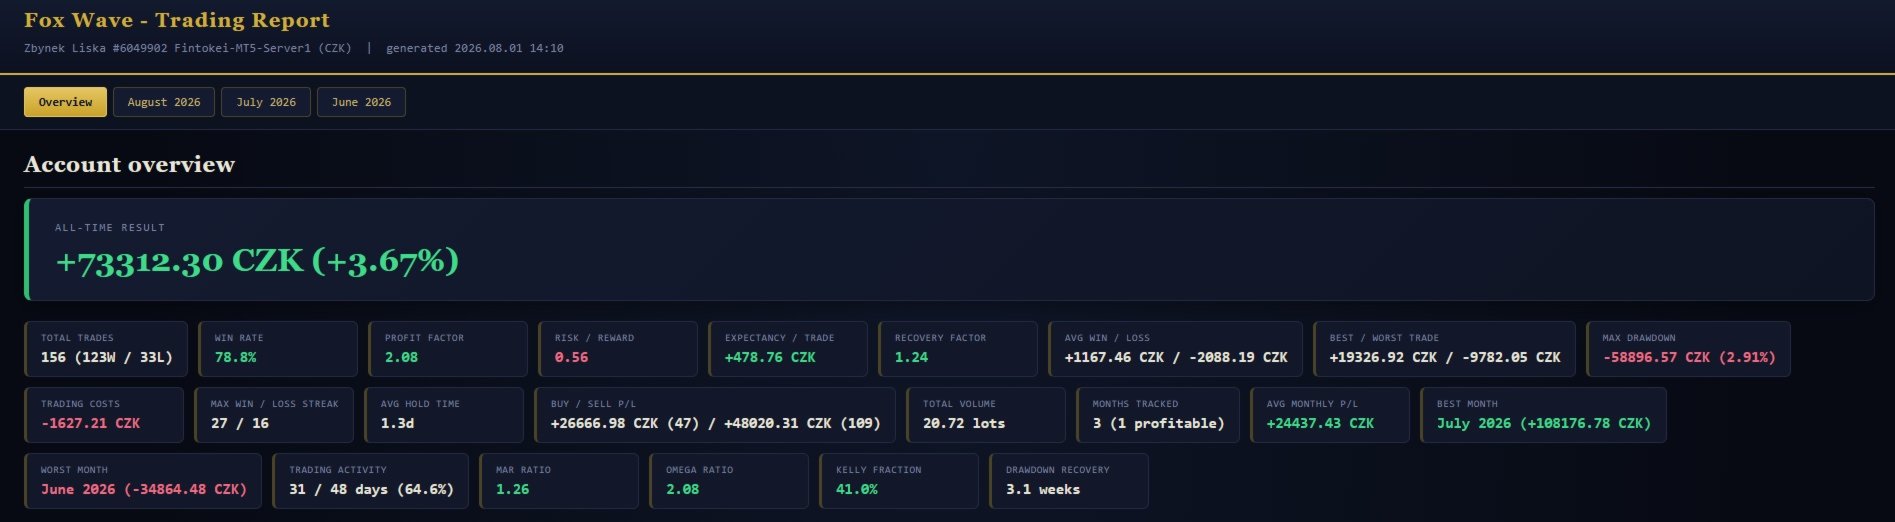
One click — full HTML report: Hit "Export HTML Report" and get a self-contained, offline HTML file (dark themed, no external dependencies) with a tab for every month you've ever traded, plus an all-time Overview page:

  • Core performance: win rate, profit factor, expectancy per trade, average win/loss, best/worst trade, win/loss streaks, buy vs. sell split, total volume.
  • Risk metrics: max drawdown (£/%), recovery time expressed in days/weeks/months (not just a raw number), recovery factor, MAR ratio, Omega ratio, Kelly fraction.
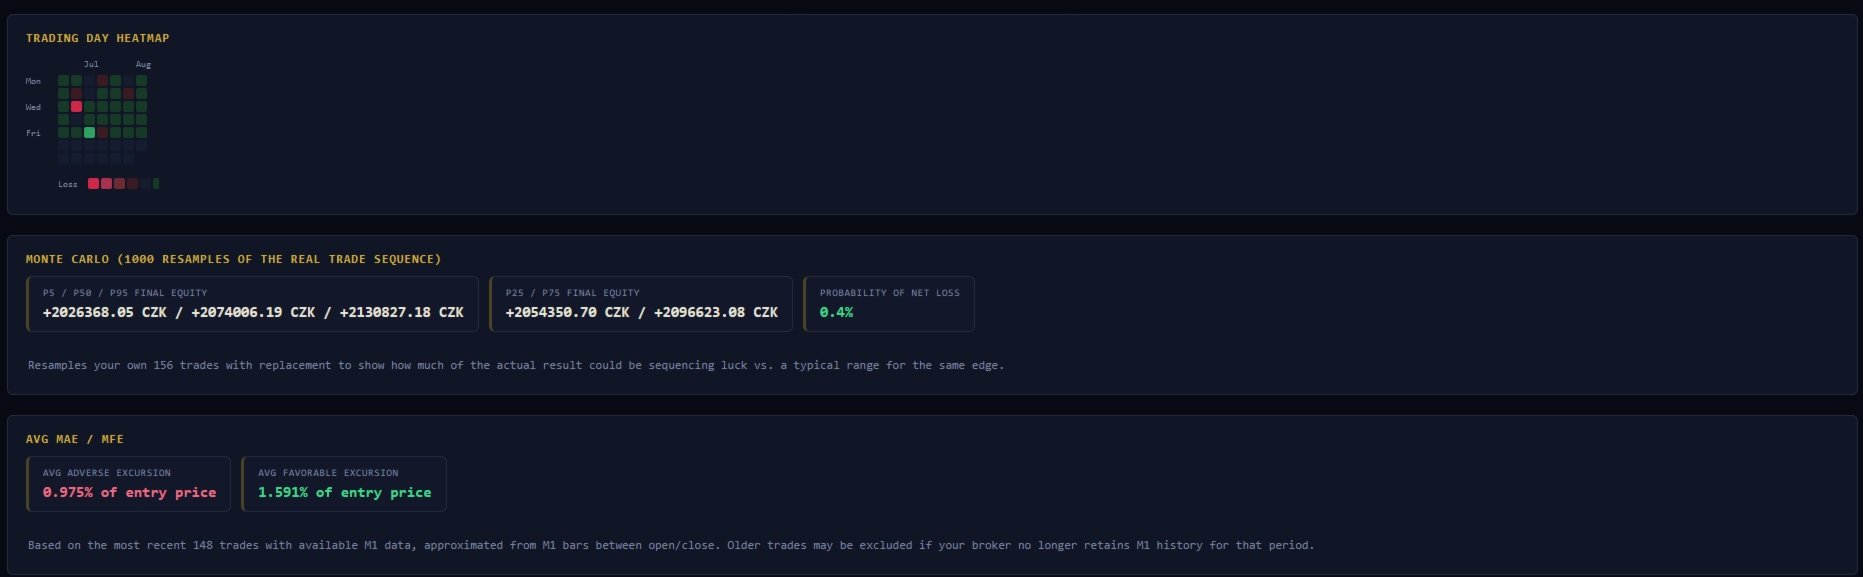
  • Distribution & simulation: a histogram of your trade P/L, a Monte Carlo simulation (1,000 resamples of your actual trade sequence) showing the P5–P95 range of outcomes and probability of a net loss — so you can see how much of your result is edge vs. sequencing luck.
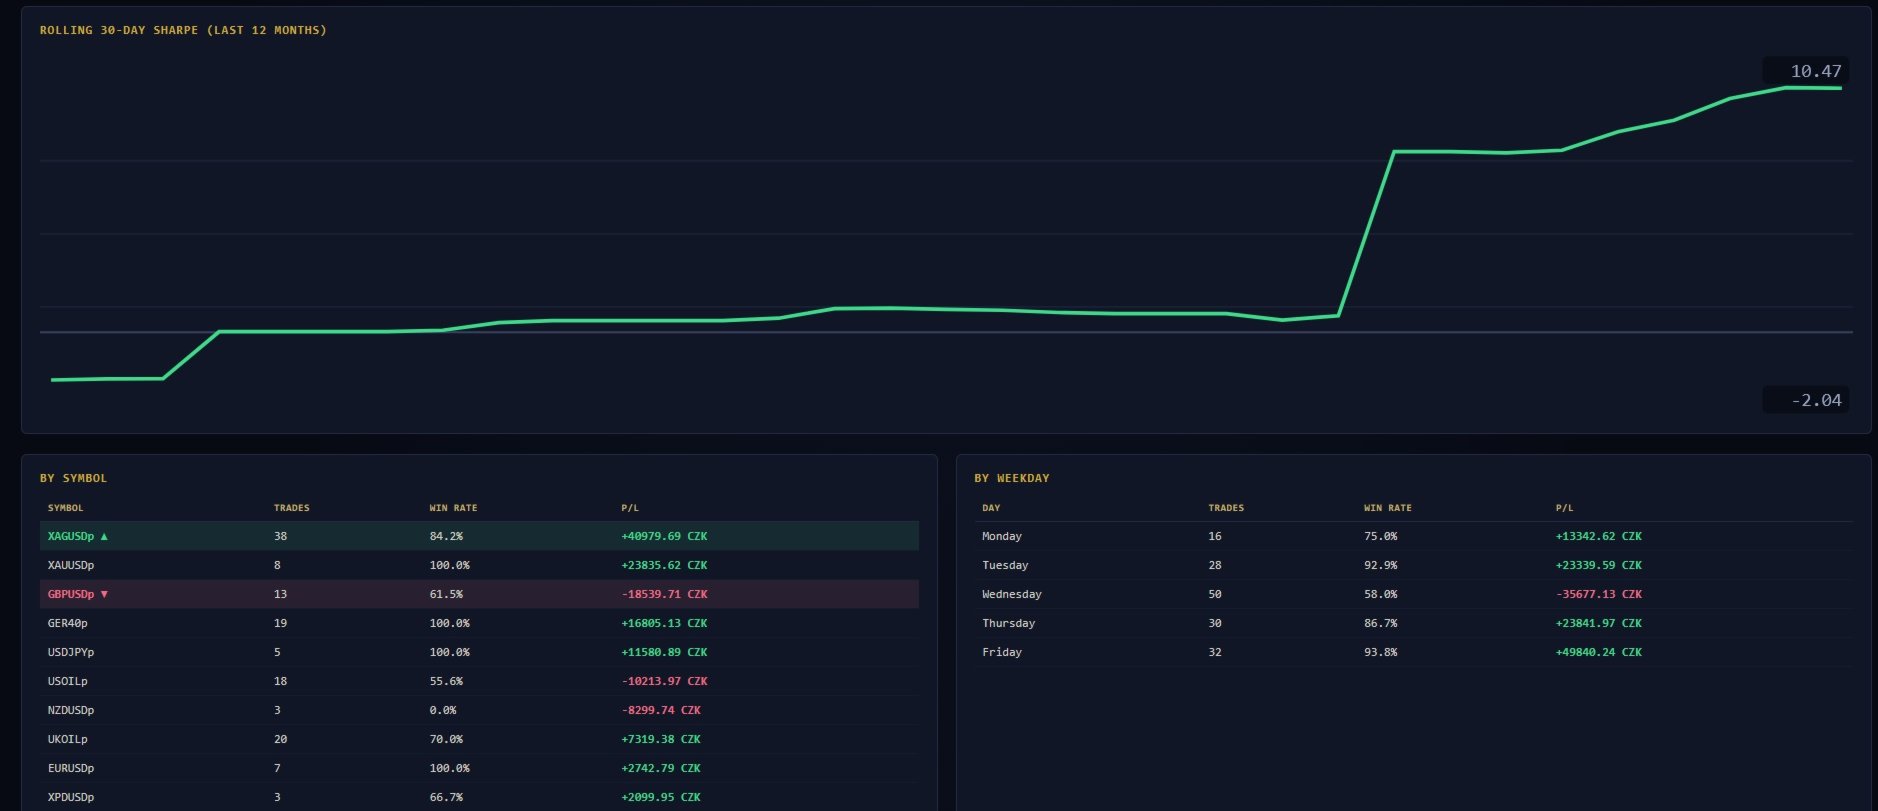
  • Time-based views: a GitHub-style trading-day heatmap across your whole history, a rolling 30-day Sharpe ratio over the last 12 months, and a by-weekday / by-hold-time breakdown.
  • Approximate MAE/MFE: average adverse/favorable excursion per trade (as % of entry price), computed from M1 bar data for your most recent trades.
  • Full trade log for every month, with symbol, direction, open/close time, volume and profit.

Every chart is inline SVG — nothing loads from the internet, and the file opens in any browser, forever, even offline.

Under the hood:

  • Only counts real trading deals (buy/sell) — deposits, withdrawals, credits and corrections never pollute your P/L.
  • Currency-aware formatting (USD, EUR, GBP, CZK, JPY and others).
  • Optional symbol filter, so you can generate a report scoped to a single instrument.
  • Best/worst contributing symbol is visually highlighted in the symbol breakdown, so it doesn't get lost in a long list.

A note on data-dependent metrics: MAE/MFE needs M1 price history for the symbols and periods in your trade history. If your terminal hasn't downloaded that data, the report will tell you clearly instead of showing a misleading zero — just open the relevant symbol's M1 chart once and re-export.

Inputs:

  • Panel corner, offset X/Y
  • Optional symbol filter (blank = whole account)
  • Accent color
  • Refresh interval (seconds)

Who it's for: discretionary and systematic traders, prop firm challenge participants, and anyone who wants an honest, data-driven read on their own trading — not just a balance curve.
作者のその他のプロダクト
FoxWave EdgeSnap — Multi-Timeframe Reversal Scanner with Quality Filter FoxWave EdgeSnap by Fox Wave watches your symbol across every timeframe simultaneously and flags the exact moment price breaks outside its dynamic volatility envelope and snaps back inside — a well-known mean-reversion pattern — then runs each signal through a quality filter before it ever reaches your eyes, so you're not chasing every minor wobble. Key features: Multi-timeframe scan (M1 through MN1, fully toggle-able) — one
If you need more information than a few numbers in the iExposure index, this indicator is for you. Better iExposure indicator is an improvement over the original information, such as: Separate profit column for BUY and SELL Separate SL column for BUY and SELL Separate TP column for BUY and SEL Average Price as Horizontal Line in Chart Pip Value Profit https://www.facebook.com/groups/prop4y iExposure will show the opening of trading positions in tabular form in the sub-window below the main wi
If you need more information than a few numbers in the iExposure index, this indicator is for you. Better iExposure indicator is an improvement over the original information, such as: Separate profit column for BUY and SELL Separate SL column for BUY and SELL Separate TP column for BUY and SEL Average Price as Horizontal Line in Chart Pip Value www.foxwave.eu
Fox Wave Pattern Scanner  SHORT DESCRIPTION  Multi-timeframe candlestick pattern scanner: 24 patterns across M5-D1, live dashboard, on-chart markers, one-click TF toggles, alerts. FULL DESCRIPTION Fox Wave Pattern Scanner continuously reads your chart's symbol across six timeframes at once and reports every candlestick pattern it finds in a clean dark dashboard — so you never have to manually flip through timeframes looking for a setup again. Instead of scrolling between M5, M15, M30, H1, H4 and
Basic tool Showing annual candle, range for Day, range for Week, range for Month, range for Year. Showing fibonacci for Day fibonacci for Week, fibonacci for Month, fibonacci for Year. Showing percent change for Day, percent change for Week, percent change for Month, percent change for Year. Showing distance of the current value the previous close for Day, Week, Month, Year.
What are Fibonacci Numbers and Lines? Fibonacci numbers are used to create technical indicators using a mathematical sequence developed by the Italian mathematician, commonly referred to as "Fibonacci," in the 13th century. The sequence of numbers, starting with zero and one, is created by adding the previous two numbers. For example, the early part of the sequence is 0, 1, 1, 2, 3, 5, 8, 13, 21, 34, 55, 89,144, 233, 377, and so on. The Fibonacci sequence is significant because of the so-calle
This is a simple and very effective utility for closing in profir or in loss. Constant overview of daily Draw Down, Current profit and Daily profit This utility will save your deposit in case of a sharp market change. Just add it to any free chart and use it for your daily trading. Thanks to the minimal set of parameters, you can easily set up the utility for any symbol in MT4
oxWave EdgeSnap — Multi-Timeframe Reversal Scanner with Quality Filter FoxWave EdgeSnap by Fox Wave watches your symbol across every timeframe simultaneously and flags the exact moment price breaks outside its dynamic volatility envelope and snaps back inside — a well-known mean-reversion pattern — then runs each signal through a quality filter before it ever reaches your eyes, so you're not chasing every minor wobble. Key features: Multi-timeframe scan (M1 through MN1, fully toggle-able) — one
FOX WAVE — EDGESNAP EA Catch the reversal before everyone else. FOX WAVE – EdgeSnap EA is a fully automated multi-symbol Expert Advisor that continuously scans your entire trading universe for high-quality reversal opportunities. Instead of monitoring dozens of charts, EdgeSnap does the work for you. It ranks every valid setup, calculates the correct position size from your predefined account risk, manages trades automatically from entry to exit, and displays everything on a real-time dashboard
Easy EA for closing positions with profit or loss. All positions of chart's symbol are counted separately. Settings: TPforSymbol — set profit amount to indicate when to close every positions for the symbol of the chart. Swap and commission are decreasing your profit. SLforSymbol — set SL amount to indicate SL for every positions for the symbol of the chart. Swap and commission are increasing your loss. SLforSyblol is always below/equal zero.
This multi-currency annual dashboard analyzes the nearest high and low to the current price for a chosen number of recent years. It displays how many pips away the price is from the nearest high or low. You can set a pip threshold, and the alert will notify you when the price gets close to the specified levels. In real-time, the dashboard also provides an overview of the closest high or low values for each specific year, helping you make informed trading decisions.
Key level analysis : The indicator tracks the nearest annual high and low to the current price over a chosen number of years. Proximity alerts : It triggers an alert when the price reaches a specified number of pips from the nearest high or low. Customizable notification intervals : You can set how often alerts repeat, for example, every 30 minutes. Historical perspective : Enables long-term tracking of market levels and effective planning of trading strategies. Multi-currency support : This ind
iExposure Fox Wave – Comprehensive Position Monitoring Indicator iExposure Fox Wave is an advanced MetaTrader indicator designed to provide detailed monitoring of all open trading positions in a clear, tabular format. This tool is perfect for traders who want all essential trade information in one place. Key Features: Symbol: Displays the instruments (currency pairs or other symbols) with open positions. Deals: Number of open trades (transactions) for each symbol. Buy lots & Buy price: Total vol
RangeDashboard – Multi-symbol Daily, Weekly, and Monthly Range Overview with Alerts RangeDashboard is a powerful and user-friendly indicator that displays the current range (high-low) of selected currency pairs or instruments over a chosen timeframe (D1, W1, MN1) directly on the chart. It allows you to input a customizable list of symbols, add suffixes if needed, and select the timeframe from which the ranges are calculated. Key Features: Dynamic calculation of ranges for any number of symbols o
Fox Wave PSAR – PSAR Dashboard for Multiple Symbols and Timeframes Description: Fox Wave PSAR is a powerful indicator for MetaTrader 5 that allows you to monitor the Parabolic SAR (PSAR) across multiple symbols and timeframes directly in a clear and convenient dashboard. It is ideal for scalping, intraday, and long-term trading strategies. Key Features: Clear dashboard with a list of symbols and their current PSAR status. Supports any number of symbols and customizable suffixes (e.g., ".m"). Di
New High / Low Dashboard Scanner is not a common indicator. It is a market-structure control system designed to monitor, in real time, the creation of new Highs and Lows across Daily, Weekly, Monthly, and Yearly time horizons — while simultaneously measuring the exact distance of price from these critical levels in pips. This tool is built for traders who do not want to react late, but instead want to stand at the origin of market movement . What the system does The dashboard continuously scan
Short Description Fox Wave Account Nexus is a professional dashboard for real-time monitoring of multiple MetaTrader 5 accounts across different terminals from a single chart. Full Description  Fox Wave Account Nexus Professional Multi-Account Monitoring Dashboard for MetaTrader 5 Fox Wave Account Nexus is a powerful visual dashboard designed for traders who operate multiple MT5 accounts simultaneously and need instant, centralized control . The indicator collects live data from all con
Fox Wave Pro Copier - Professional Multi-Master Trade Copier Copy trades from multiple Master accounts simultaneously with advanced risk management Key Features Multi-Master Architecture Copy from unlimited master accounts simultaneously Automatic master account detection or manual configuration Real-time trade synchronization via file system Independent risk management for each master Advanced Risk Management Individual risk settings per master account Automatic lot size calculation based
TREND SCANNER PRO - Multi-Timeframe Trend Analysis Dashboard Professional real-time trend scanner that monitors up to 15 currency pairs across 8 timeframes simultaneously. Get instant market overview with epic visual dashboard, smart alerts, and zero lag performance. KEY FEATURES
Professional Averaging Calculator - Essential Risk Management Tool for Every Trader Whether you're a beginner learning position averaging or a professional managing complex grid strategies, this calculator is your must-have tool. Beginners instantly see how averaging works, understand maximum loss scenarios, and learn proper risk management before entering trades - no more "I didn't know I could lose that much" surprises. Professionals save time and eliminate calculation errors with instant simu
SMC Pro — Smart Money Concepts All-in-One The only indicator you need to trade like the institutions. SMC Pro combines five core Smart Money Concepts tools into a single, clean, and fully customizable indicator for MetaTrader 5. No repainting. No clutter. Everything you need to read the market the way banks and hedge funds do. What it does Order Blocks Automatically detects bullish and bearish Order Blocks — the price zones where institutional orders were placed before a major move. The indic
Calculate the exact entry price or lot size needed to reach your target average — directly on the chart. Full description A lightweight MT5 indicator that solves a common trading problem: if I add to my position at market price, what volume do I need to reach my target average? Or the reverse: if I want to add a fixed lot size, at what price must I enter? The panel reads your open positions automatically, displays the current average entry price with a dashed line on the chart, and lets you s
Spread Recorder — Multi-Symbol Max/Min Dashboard Spread Recorder is a real-time multi-symbol dashboard that continuously monitors live spreads across your entire watchlist and permanently records the maximum and minimum spread ever seen for each symbol — with timestamps. Key features: Monitor 10, 28, 50+ symbols simultaneously from a single customizable text file Auto-adaptive grid layout — the panel automatically resizes its rows and columns to fit however many symbols you load, from a handful
Swap Monitor — Multi-Symbol Buy/Sell Swap Dashboard with Alerts Swap Monitor is a real-time multi-symbol dashboard that displays live SELL and BUY swap rates for your entire watchlist in one compact, color-coded panel — and can alert you the instant any swap rate changes. Key features: Monitor 10, 28, 50+ symbols simultaneously from a single customizable text file Auto-adaptive grid layout — the panel automatically resizes to fit however many symbols you load Displays both SELL and BUY swap valu
FoxWave Volume Suite combines three essential volume-based tools into a single indicator: a horizontal Volume Profile with Point of Control and Value Area, a real-time volume spike detector with instant alerts, and a buy/sell pressure delta gauge. No need to run three separate indicators — everything you need to read volume is in one clean Fox Wave panel. What it does Volume Profile (POC / VAH / VAL) Builds a horizontal histogram showing how much volume traded at each price level over your cho
FoxWave SMC Trend Suite  SHORT DESCRIPTION  Smart Money Concepts trend tool: Market Structure (BOS/CHoCH), Order Blocks, FVG and EQH/EQL — fully toggleable, with alerts. FULL DESCRIPTION FoxWave SMC Trend Suite brings the four foundational building blocks of Smart Money Concepts trading into a single, clean indicator: Market Structure shifts (Break of Structure / Change of Character), Order Blocks, Fair Value Gaps, and Equal Highs/Equal Lows liquidity pools. Every component can be switched on or
Profit Loss Tracker A clean, draggable on-chart panel that shows your floating profit/loss in real time — one symbol at a time or your entire account at once — with permanent high/low watermark history and one-click close. Stop scrolling through the Trade tab or doing mental math. zProfit Loss Tracker keeps your floating P/L, your best and worst moments on every symbol, and your account health always visible in a compact, modern panel — and lets you close positions with a single click, right whe
One purchase. Two professional trading tools. Buy EdgeSnap EA today and receive this Edge Snap Indicator  as a complimentary bonus. Simply contact me on MQL5 after your purchase, and I'll send it to you personally. FOX WAVE — EDGESNAP EA A fully automated multi-symbol trading robot that scans your entire Market Watch for price-reversal setups, sizes every trade from account risk with built-in margin and volume safety caps, manages partial profit-taking and trailing on its own, and shows you e
FoxWave EdgeSnap Multi-Symbol — Scan Every Pair for Reversal Setups at Once FoxWave EdgeSnap Multi-Symbol by Fox Wave takes the same quality-filtered reversal detection from EdgeSnap and runs it across every symbol you trade at once — Market Watch or a custom list, one timeframe, one panel — so instead of flipping through 20+ charts looking for a setup, the setup finds you. Key features: Scans your entire Market Watch automatically, or a custom symbol list with broker-suffix support (up to 60 sy
フィルタ:
レビューなし
レビューに返信