Market Maker Signal Days MT5
- Indicadores
- Versão: 6.1
- Atualizado: 12 outubro 2026
- Ativações: 5

Market Maker Signal Days v5.0: On-Chart Companion Indicator
"Always think of your entry point as last night's close." – Paul Tudor Jones
Introduction
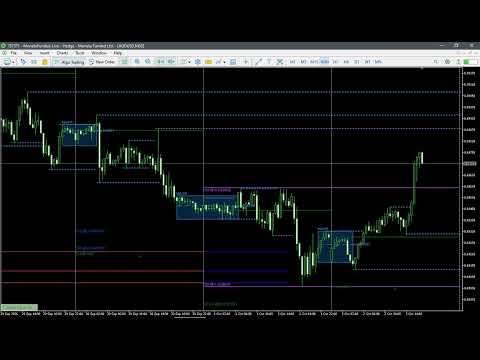
Attention: The Market Maker Reversal Scanner tells you which instruments to look at. Signal Days tells you what you're looking at once you get there. Version 5.0 now draws daily signals, liquidity levels and consolidation zones on the same chart, on a rebuilt engine.
Interest: Attach it to any chart. It reads the daily timeframe, applies the same scoring engine as the scanner (synced to Scanner v8.2), and draws the result on your price action:
- signal labels with tier and direction
- extreme levels
- a first-day-of-month reference
- a marker on the session the setup is meant to play out in
There is no separate panel and no second window.
What's new in v5.0
- Liquidity levels. Swing highs and lows on up to three timeframes (defaults H1, H4, D1). Unbroken levels extend to the right. Broken levels stop at the bar that broke them.
- Consolidation zones. Major (tight) and minor (looser) boxes, sized in ATR multiples. Major zones also draw a tick-volume-weighted average-price line.
- Rebuilt engine. Daily history is loaded once per scan and all extreme detection runs in a single pass. The terminal does far less work than in v4.x. Liquidity and zones recalculate only when something actually changes.
- Audit fixes. The Prior-Month-Break tag no longer uses look-ahead data. Session-closed detection uses server time. Inputs are validated. Object names can't collide between instances.
This is an analysis overlay. It does not place, modify or close trades, and it makes no claim about win rate or profitability. It reads bar data only, with no access to order flow or broker positioning.
How it scores (max 10, shared with the scanner)
| Component | Max | Rule |
|---|---|---|
| Extreme | 6 | Highest/lowest close of the month = 6. Of the week = 4. Monthly high/low wick = 2. Weekly high/low wick = 1. |
| Signal | 3 | First Red/Green Day and 3 higher/lower closes need a qualifying extreme or score 0. CIB and 3-Day Breakout score 3 at an extreme, 1 off one. Inside Day and Outside Day score 3 on structure alone. |
| Timing | 2 | Backside of the month, first trading day of the month, midweek. Capped at 2. |
| Template | 1 | Signal-day pattern landing in the Wednesday/Thursday slot. |
| Setup credit | +2 | Only for an Inside Day or Outside Day that sits at no extreme. |
The total is capped at 10. Tiers are ELITE, PRIME, STRONG, WATCH, ALERT. Some pattern classes are tier-anchored, with a minimum or maximum tier set by the framework. The hover breakdown marks any anchored score "(tier-anchored)", so the number is never hidden. A CHAIN badge marks a First Red/Green Day riding a full three-close pump into a matching close-based extreme.
Key Features
Desire: everything below is built to reduce chart clutter while keeping the full reasoning one hover away.
- Trade DAY marker. Marks the session the setup is meant to play out in, normally the next trading day. When the signal bar is a Friday, it skips forward to Monday.
- FDTM reference lines. The high and low of the first day of each new trading month, drawn as levels.
- Prior Day Close line. A flat line at yesterday's close, redrawn for each day.
- Liquidity levels (new). Three independent timeframe sets, each with its own colour, style and width. Choose wick or close as the breach rule. Set the swing size and how many levels to show per side. Keep or hide broken levels.
- Consolidation zones (new). Show major only, minor only, or both. Outline, fill, or fill-only styles. Optional labels.
- Context tags on every signal. FDTM, Midweek, Thursday, Backside, Prior-Month Break and Monday In-Play, so you can see why a bar qualifies.
- Clean by default. The chart shows signal name, direction and tier. Hover any marker for the score breakdown, tags and week phase.
- Works on any timeframe. Analysis always runs on daily bars. Above H1, labels auto-hide to arrows only.
- One-click ON/OFF button. Pin it to any corner, with custom colours. The state is remembered when you switch timeframe or restart.
- Three built-in themes (Gray, Dark, White) plus a fully custom palette for signals, tiers, extreme lines and Trade DAY.
- Signal filters. Toggle each signal type, show CHAIN-only, and switch monthly and weekly extreme checking independently.
Settings and Trade Discipline
This tool does not manage trades, size positions or set stops. Risk management stays with you. The settings below control how selective the chart is, which is the discipline layer.
- InpMinStrength (default 4 = PRIME and above): the floor for what gets drawn. Set it to 3 to include STRONG.
- InpLookback (default 60): daily bars scanned.
- InpFRD_MinPumpDays (default 1): consecutive higher/lower closes required before a First Red/Green Day. Set it to 3 for the strict version.
- InpFRD_RequireFalseBreak (default off): the reversal candle must poke a new week/month extreme and fail.
- InpCIBExtremeOnlyTradeable (default on): close-in-breakout signals only score at a genuine extreme.
- InpShowInPlayTriggers (default off): shows non-extreme CIBs as a 1-point "IN PLAY" watchlist item.
- InpUseTemplateDayBonus: turn off the Wednesday/Thursday point if you don't trade that structure.
- InpShowChainOnly: hide everything except CHAIN setups.
- InpShowMeterRow (default off): print the score breakdown inline instead of in the tooltip.
- InpExactTradingDays (default off): off = scanner-parity calendar approximation; on = real trading-day distance.
- Liquidity and zone inputs: timeframes, swing bars, breach mode, max levels, ATR multiples and minimum bars. Set a liquidity timeframe to "Off" to disable it.
- InpInstanceTag: only needed if you run two copies on the same chart.
Risk notice: signals are a framework for analysis, not trade instructions. Past signal quality does not predict future results. Always test on a demo account and apply your own risk rules.
FAQ
Does this replace the scanner? No. The scanner covers your whole Market Watch and tells you which instruments qualify. This attaches to one chart and shows the full context once you're there.
Does it send alerts? No. It is a visual overlay only, with no pop-up, sound, push or email alerts. Notifications are the scanner's job.
Does it repaint? Signals are calculated only on closed daily bars, so the forming daily bar never produces a signal. Some live elements do update as price moves: a first-day-of-month level while that day is still forming, liquidity levels when price breaks them, and a zone box that reaches the current bar.
What does the Trade DAY marker mean? It marks the session the framework expects the setup to play out in. It is not a trade instruction. Where and whether you enter is your own read of the lower timeframe.
Why does an Inside Day or Outside Day sometimes score without an extreme? They are weekly-template signals that the framework treats as valid on structure alone. Without an extreme they receive the +2 setup credit instead of extreme points. Every other signal type needs a qualifying extreme to score.
What timeframe should I attach it to? Any. Use whichever you trade entries on. The daily context appears on it either way.
Will it slow my terminal? v5.0 loads daily history once per scan and recalculates liquidity and zones only when needed. Keep the lookback and the number of liquidity levels reasonable on slow machines.
Do I need daily history loaded? Yes. If the data is still downloading when you attach it, it retries automatically.
Existing v4.x users: v5.0 removes leftover v4.x objects on attach ( InpPurgeV4Objects ). Defaults changed (theme, minimum strength, in-play and extreme-line visibility), so review your settings after updating.
Can I run it with the scanner? Yes. They read independently and use separate object names.
Action: add Signal Days v5.0 to the chart you already trade and let the daily context sit under your entries.