Graded Liquidity Sweep
- Indicadores
- Versão: 2.60
- Atualizado: 31 outubro 2026
- Ativações: 5

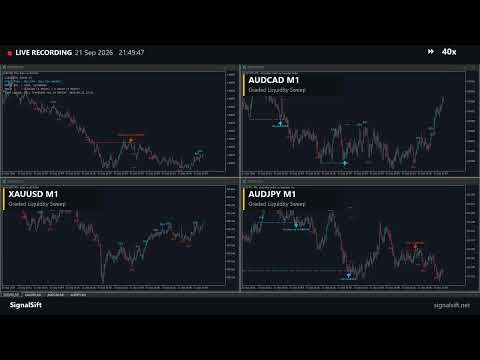
This indicator marks the candles where price runs through a liquidity level and turns back. It finds and ranks the levels by itself, so there is nothing to draw by hand. It is made for manual trading on any symbol and timeframe.
What you see on the chart
- A buy or sell arrow on the candle that confirms the reversal. Arrows appear only after that candle has closed, and they do not repaint.
- For every signal: the level that was swept, a stop level and two target levels.
- A label with the type of level that was swept and its strength: Minor, Medium or Major.
- A label where the market breaks structure, shown on the chart as "BOS" (break of structure).
- A status panel with the current market bias, where price sits in its range, how many active levels there are above and below price, and the last signal.
One setting
- Minimum grade allowed to signal: Minor, Medium or Major. Minor accepts a sweep of any swing point and gives the most arrows. Medium, the default, needs a structure high or low, or equal highs and lows. Major only signals at the previous day, week or month and higher timeframe structure, so arrows are fewer.
Everything else is tuned and fixed, so there is nothing else to set up. Attach it to a chart and it starts working.
Notes
- The indicator does not open or manage trades.
- It has no output buffers, so its signals cannot be read by Expert Advisors or other indicators.
- It works on a chart and in the Strategy Tester in visual mode.
- Signals are calculated on closed candles only.
- Distances are measured in Average True Range, so it behaves the same way on forex, metals, indices and crypto.
- It is a tool for reading liquidity, not a trading system. Use it together with your own analysis and risk management.