GDS Renko Ghost
- Indicadores
-
Andrey Goida
 MT5 developer focused on XAUUSD, Renko tools, and structured trading systems.
Building practical indicators, panels, and research-driven solutions for traders who value clarity, logic, and disciplined execution. - Versão: 1.25
- Atualizado: 15 maio 2026
GDS Renko Ghost
Free Renko Market Memory Visualization Indicator for MetaTrader 5
GDS Renko Ghost is a free MetaTrader 5 indicator for traders who use Renko charts and want to study how similar Renko structures behaved in the past.
The indicator visualizes historical Renko memory: similar past structures, continuation paths, consensus behavior and uncertainty zones.
It does not give buy or sell signals. It does not predict price movement. It is a visual research and context tool for manual Renko analysis.
The core idea
The market often creates similar Renko structures over time.
GDS Renko Ghost searches historical Renko behavior and displays a visual memory field around the current structure. This helps the trader compare the present Renko pattern with similar historical patterns.
Ghost is not about predicting the future. Ghost is about making historical Renko memory visible.
What it helps you read
Historical Renko memory
See how similar Renko structures appeared and evolved in the past.
Ghost continuation paths
Transparent Renko paths show historical continuations after similar structures.
Consensus behavior
A visual path helps summarize where historical examples had more agreement.
Uncertainty field
A wider or more dispersed field suggests that similar historical structures behaved less consistently.
Structure comparison
Use Ghost as a research layer to compare current Renko structure with past market behavior.
How to read Ghost
- solid Renko bricks show the current structure
- transparent ghost bricks show historical continuation examples
- a cleaner memory field suggests stronger historical agreement
- a wider field suggests more uncertainty or divergence
- the visual path is context, not a forecast
Typical workflow
- Build or open a Renko chart in MetaTrader 5.
- Add GDS Renko Ghost to the chart.
- Review the current Renko structure.
- Observe historical ghost paths and consensus behavior.
- Compare Ghost context with zones, momentum and structure tools.
- Use the information as part of a manual trading plan.
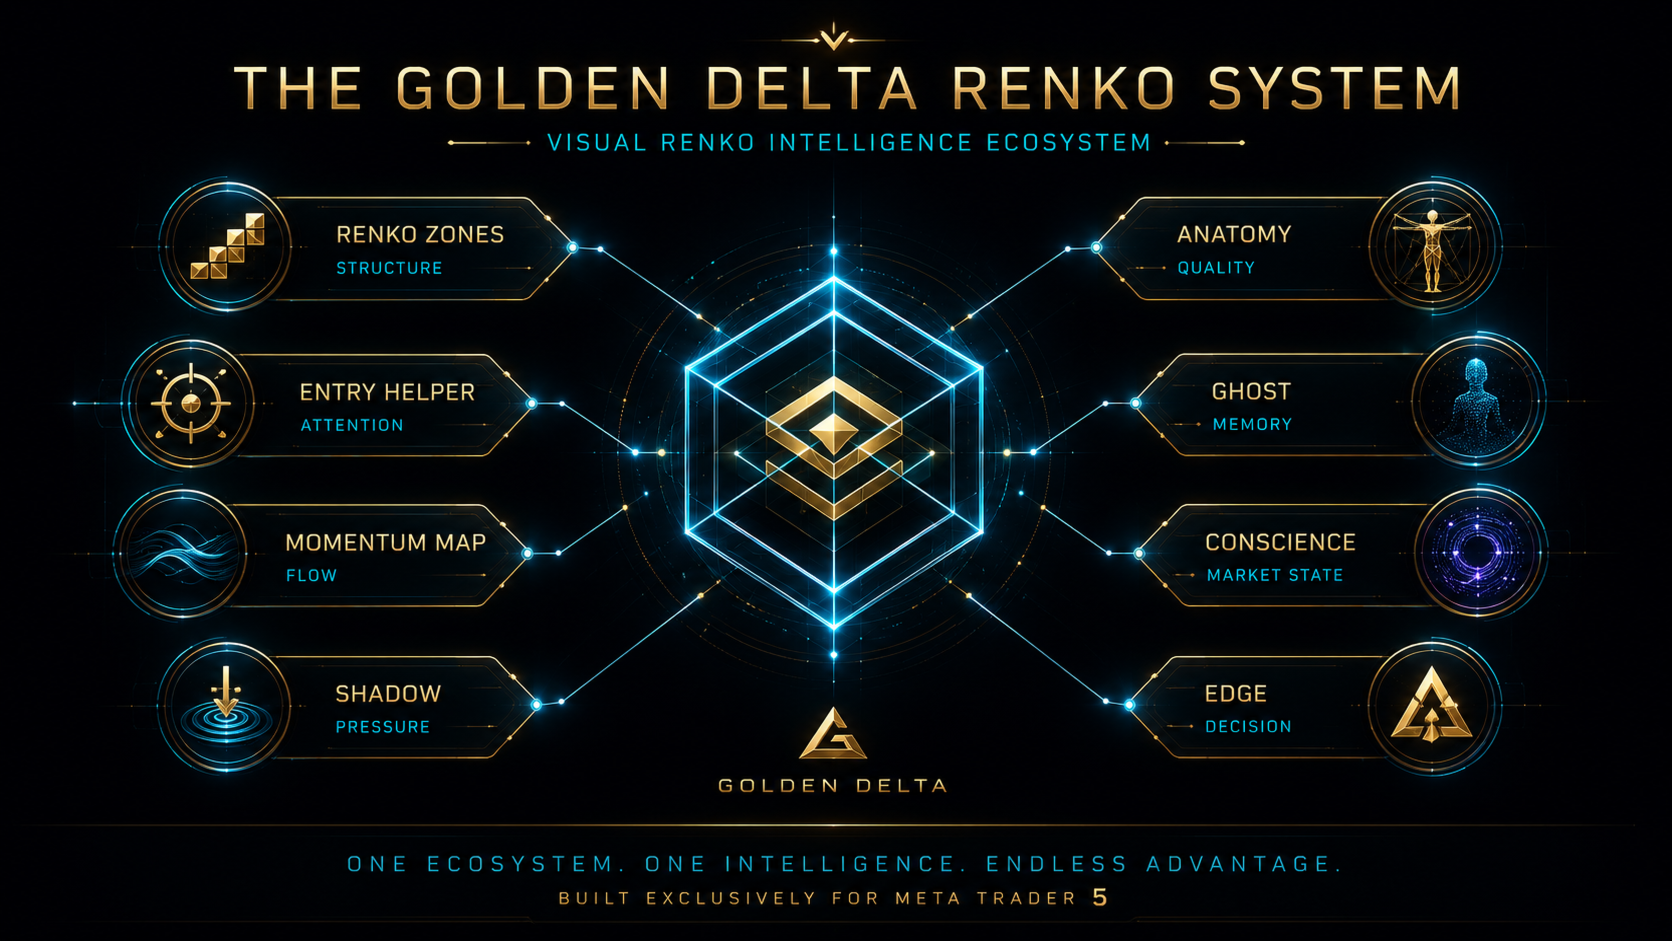
How it fits the Golden Delta ecosystem
- GDS Renko Anatomy - free Renko movement anatomy and structure-reading layer.
- GDS Renko Shadow - free hidden pressure and momentum context layer.
- GDS Renko Pulse - free activity and momentum rhythm context.
- GDS Renko Structure - free Renko structure-reading layer.
- GDS Renko Zones Intelligence - premium zone score, freshness, active verdict and Top Zones context.
- GDS Renko Mirror MT5 - premium multi-scale Renko structure comparison.
- GDS RiskLab TradeDesk Renko Pro Edge - advanced manual execution and risk-control cockpit.
Who it is for
- Renko traders who want historical structure context
- MetaTrader 5 users building a free Renko research workspace
- XAUUSD, forex, index or crypto traders using Renko charts
- manual traders who want context instead of signal arrows
- users exploring the Golden Delta Renko ecosystem
Useful for
- Renko market memory visualization
- historical structure comparison
- continuation behavior research
- uncertainty and consensus review
- brick-based market structure analysis
What it is not
- not a buy/sell signal indicator
- not an automatic trading robot
- not a prediction tool
- not financial advice
- not a guarantee of trading results
Important: GDS Renko Ghost is a visual research and context indicator for manual Renko analysis. It does not place trades, does not predict price movement and does not guarantee any trading result. Always test settings on a demo account before live trading and use proper risk management.
Renko, MT5, Renko Ghost, Market Memory, Renko Indicator, Free Indicator, XAUUSD, Historical Patterns, MetaTrader 5, Renko Trading, Manual Trading, Golden Delta