RCCMA Custom Moving Average for RCC
- Indicadores
-
Yutaka Okamoto
 I specialize in developing high-quality indicators for both MT5 and MT4 platforms.
With a strong background in programming and a keen eye for market analysis,
I strive to create innovative and effective tools that help traders make informed decisions and achieve success in their trading journey. - Versão: 1.1
- Atualizado: 28 abril 2023
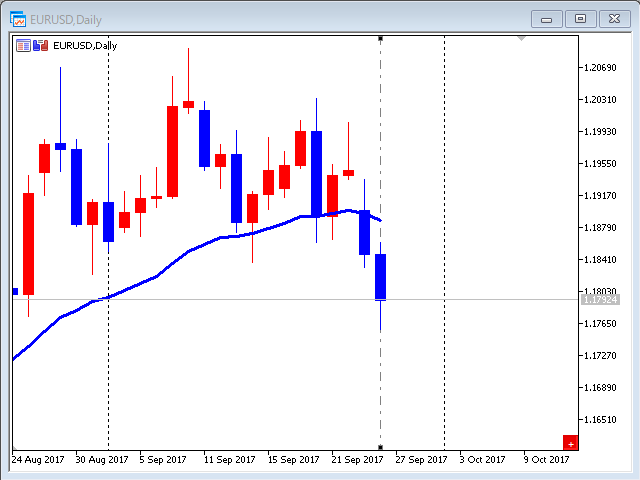
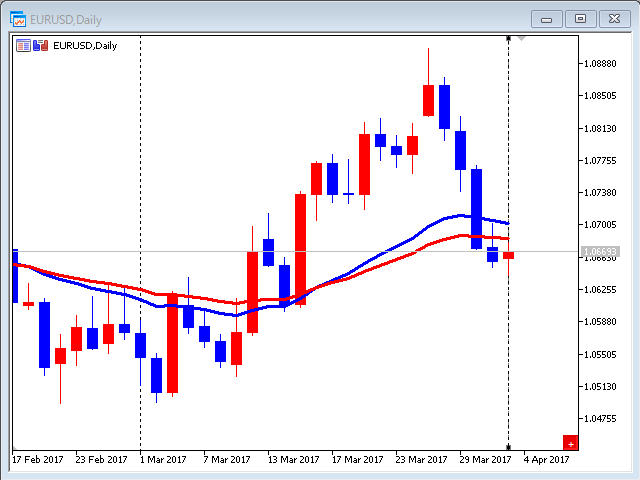
RCCMA is a general moving average indicator that works with ReviewCandleChart.
Original is "Custom Moving Average" provided by MetaQuotes Software Corp. Based on that source code, I corresponded to ReviewCandleChart.
Advantages
- When ReviewCandleChart is ON, no line will be displayed on the right side from the vertical reference line.
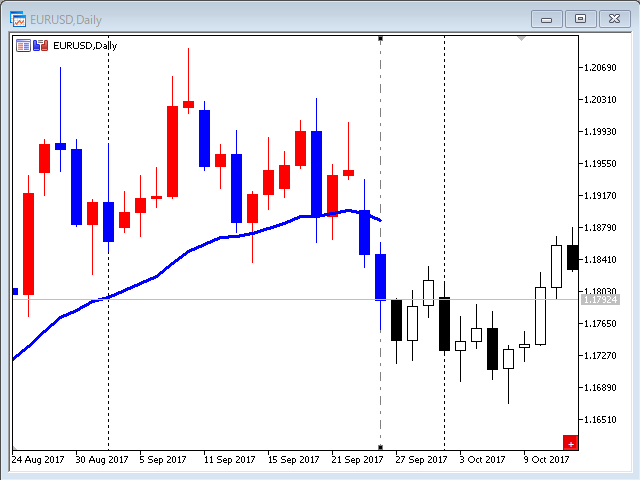
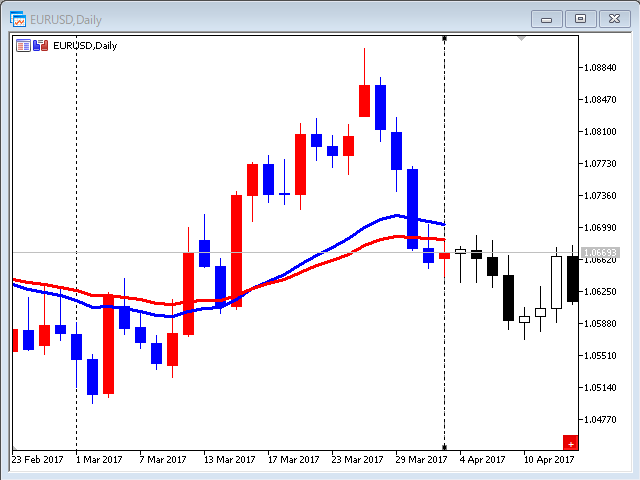
- When ReviewCandleChart is ON and you press a key such as "Z" or "X" Following that, the MA is drawn.
- When ReviewCandleChart is OFF, the same drawing as the original "Custom Moving Average" is made.
Usage tips
The product has proven to be efficient in conjunction with the ReviewCandleChart.
Indicator parameters
- Period - [13]
- Shift - [0]
- Method - [Smoothed]
- Simple
- Exponential
- Smoothed
- Linear weighted
Developer
Yutaka Okamoto, professional programmer.


O usuário não deixou nenhum comentário para sua avaliação