PerfomanceDashboard
- Utilitários
- Versão: 1.642
- Atualizado: 23 julho 2026

PerformanceDashboard — Advanced Trade Analytics for MT5
PerformanceDashboard is a lightweight indicator designed to analyze trading performance directly from your MetaTrader 5 account history.
It allows you to evaluate multiple Expert Advisors (EAs) simultaneously using Magic Numbers, providing clear and structured insights into your trading results.
USER GUIDE
Key Features
Multi-Strategy Analysis
- Automatic Magic Number detection
- Manual Magic Number input
- EA identification from trade and order comments
- Optional support for manual trades with Magic Number 0
- Individual strategy selection
- ALL, NONE and HIDE controls
- Automatic preservation of selected Magic Numbers
- Paginated Magic Number navigation for large EA portfolios
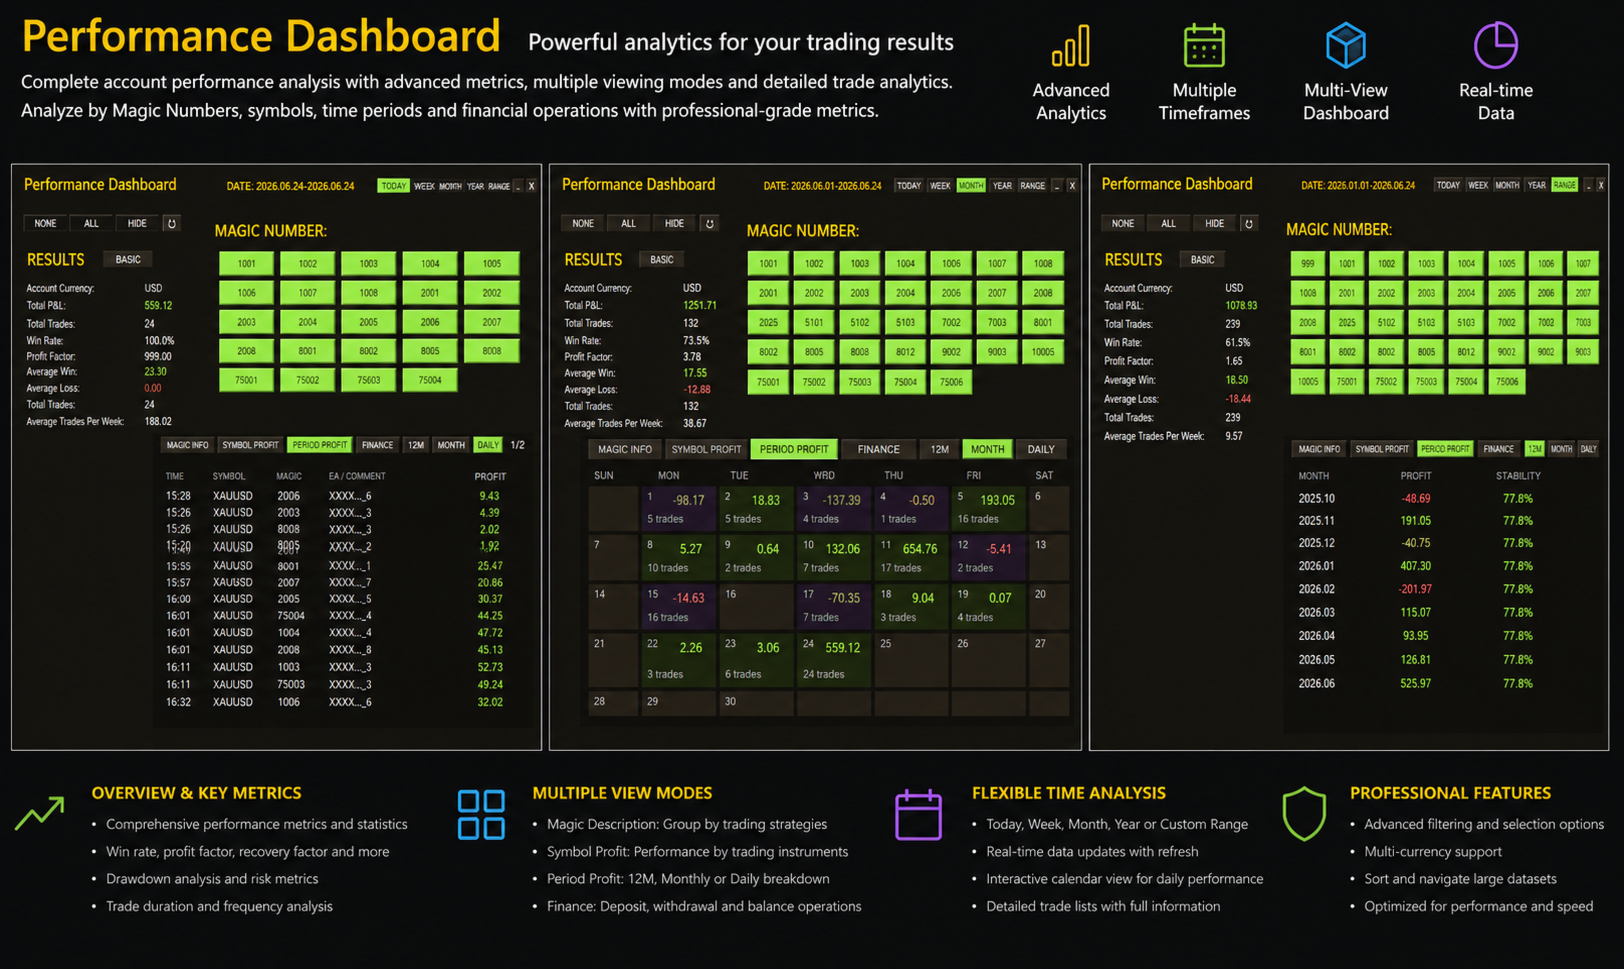
Flexible Analysis Periods
Quickly analyze performance for:
- TODAY
- WEEK
- MONTH
- YEAR
- Custom RANGE
- FIRST TRADE
The First Trade filter automatically sets the analysis start date to the earliest trade of the currently selected Magic Numbers and updates when the strategy selection changes.
Built-in action hints explain the purpose of the main period and Refresh controls.
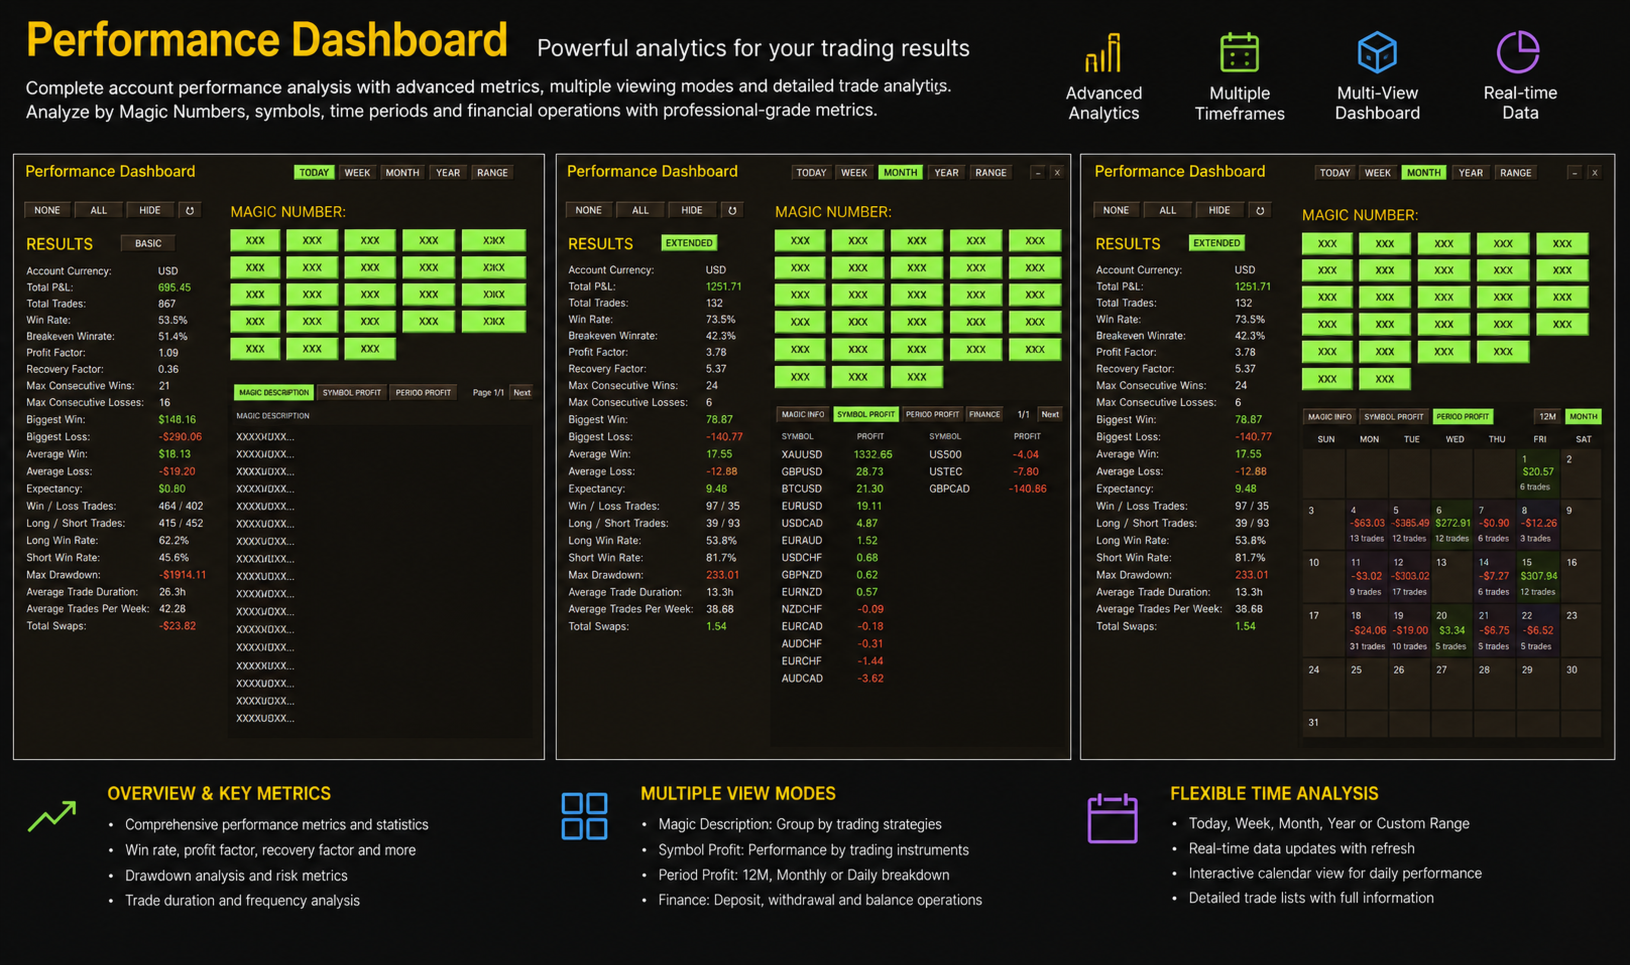
Basic and Extended Overview
Switch between compact and detailed performance views.
Basic Overview
- Account Currency
- Total P&L
- Total Trades
- Win Rate
- Profit Factor
- Average Win
- Average Loss
- Average Trades Per Week
Extended Overview
- Breakeven Win Rate
- Recovery Factor
- Annualized Sharpe Ratio
- LR Correlation
- Z-Score
- Maximum Consecutive Wins
- Maximum Consecutive Losses
- Biggest Win
- Biggest Loss
- Expectancy
- Winning and Losing Trades
- Long and Short Trades
- Long and Short Win Rates
- Maximum Drawdown
- Average Trade Duration
- Total Swaps
- Estimated Slippage Impact
Trading commissions, swaps and broker fees are included in balance and performance calculations where available.
Estimated Slippage Impact
The dashboard estimates the financial impact of slippage for supported trade events.
Slippage calculations support:
- Forex
- Gold
- CFDs
- Pending-order entries
- Stop Loss exits
- Take Profit exits
In Extended Daily view, the estimated slippage impact is displayed directly below each closed trade.
The Extended Overview also shows the combined estimated impact for the selected strategies and analysis period.
Values are displayed as N/A when the required execution data is unavailable.
Period Profit
Analyze performance across several time-based views.
12-Month Overview
- Monthly profit
- Optional percentage return
- Monthly stability
- Automatic pagination
Monthly Trading Calendar
- Daily profit
- Number of closed trades
- Optional daily percentage return
- Adaptive calendar layout
- Visual highlighting of profitable and losing days
Daily Trade Report
Each closed trade includes:
- Closing time
- Symbol
- Magic Number
- EA name or comment
- Lot size
- Profit
- Optional percentage return
- Estimated Slippage Impact in Extended mode
Symbol Profit
Review performance by trading instrument.
- Profit by symbol
- Automatic aggregation of all selected strategies
- Ranking from the most profitable to the least profitable symbol
- Multi-page navigation for large symbol lists
Magic Info
Review detected strategies and their associated trade comments.
- Magic Number
- EA or strategy description
- Optional profit by Magic Number
- Two-column layout
- HIDE mode for displaying only selected strategies
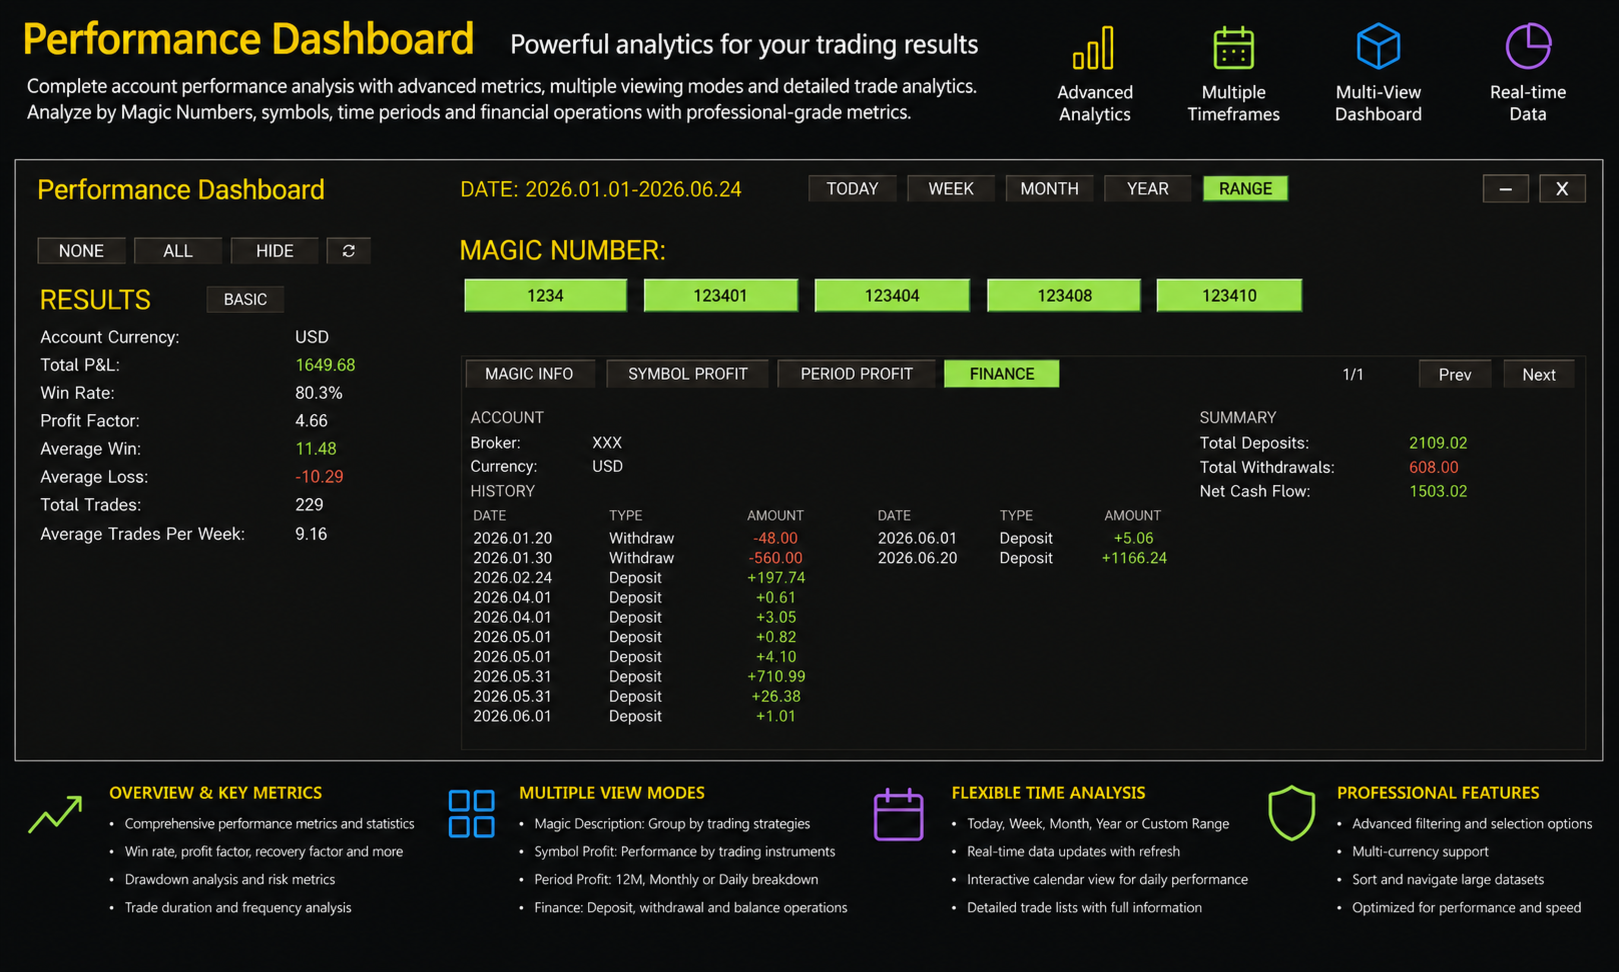
Finance
The Finance section separates account funding operations from trading performance.
It displays:
- Current Balance
- Total Deposits
- Total Withdrawals
- Deposit and withdrawal history
- Broker
- Account Currency
Reliable Trade Detection
The dashboard reconstructs closed positions from account deal history rather than relying only on individual exit deals.
This improves support for:
- Positions opened before the selected analysis period
- Positions closed manually
- Partial closing activity
- Close By operations
- Exit deals with Magic Number 0
- Trading fees charged separately by the broker
Performance and Usability
- Automatic data refresh
- Manual Refresh button
- Cached trade-history calculations
- Cached Magic Number scanning
- Cached Daily and slippage calculations
- BASIC and EXTENDED display modes
- Minimize and close controls
- Adjustable panel position and dimensions
- Improved cleanup when removing the dashboard
- High-DPI interface scaling
- No external libraries or services required
Designed For
- Multi-EA portfolios
- Prop firm accounts
- Portfolio traders
- Strategy monitoring
- Live account analysis
- Manual and automated trading
- Comparing Expert Advisors by Magic Number
- Monitoring execution quality and trading costs
How It Works
- Attach Performance Dashboard to any chart.
- Select automatic or manual Magic Number detection.
- Choose the required strategies.
- Select TODAY, WEEK, MONTH, YEAR, RANGE or FIRST TRADE.
- Switch between BASIC and EXTENDED results.
- Use Magic Info, Symbol Profit, Period Profit and Finance for deeper analysis.
All calculations are performed directly from your MetaTrader 5 account history.
Performance Dashboard turns raw account history into a clear overview of strategy performance, portfolio behavior and execution quality.


Very nice tool. I had some issues with the many expert advisors who has different magic numbers. After contacting the developer he solved the problem for us from CWDT so we could work further with this amazing Utilitiy. Highly recommended if you want to check out in 1 view which strategies are the good ones over certain time period.