Power Assisted Trend Following

# Power Assisted Trend Following Indicator

## Overview

The PowerIndicator is an implementation of the "Power Assisted Trend Following" methodology developed by Dr. Andreas A. Aigner and Walter Schrabmair. This indicator builds upon and improves J. Welles Wilder's trend following concepts by applying principles from signal analysis to financial markets.

The core insight of this indicator is that successful trend following requires price movements to exceed a certain threshold (typically a multiple of the Average True Range). By measuring the "power" of both signal and noise components in price movements, this indicator helps traders identify when a market is in a strong enough trend to trade profitably.

## Theoretical Background

### The Problem with Traditional Trend Following

J. Welles Wilder's "Volatility System" (published in his 1978 book "New Concepts in Technical Trading Systems") uses a trailing stop-loss based on the Average True Range (ATR). The system follows new highs/lows with a trailing stop and reverses direction when the stop is triggered.

However, as demonstrated in the research, this system only works profitably when the trend's amplitude exceeds a certain multiple of the stop-loss range:

- When price fluctuations are equal to or smaller than the stop-loss (1× ATR), the system constantly gets stopped out and loses money
- At 2× ATR, the system still loses money but less than at 1× ATR
- At 3× ATR, the system breaks even
- At 4× ATR or higher, the system becomes profitable

This creates the need for a method to measure when a market is trending strongly enough to trade.

### The Power Concept

The PowerIndicator applies concepts from signal analysis, specifically the notion of "power" in signals. In physics, power for periodic signals is defined as the average energy over a period. The researchers adapted this concept to financial markets by:

1. Calculating the "power" of price movements
2. Separating this power into "signal" (trend) and "noise" (deviation from trend) components
3. Comparing these power measurements to a threshold based on the ATR

This approach provides a more accurate way to identify tradable trends than Wilder's Directional Movement indicators (DX, ADX, ADXR).

## Mathematical Foundation

The indicator calculates several key metrics:

### 1. Power of a Price Series

For a window of N periods, the power at time j is calculated as:

```
Power(j,N) = (1/N) * Σ(|P(j-n)/P(j-N+1)|²)
```

Where:
- P(j-n) is the price n periods ago
- P(j-N+1) is the price at the start of the N-period window
- The sum runs from n=0 to N-1

### 2. Power of Signal and Noise

The price series is decomposed into:
- Signal: The N-period moving average (MA)
- Noise: The deviation of price from the moving average

The power of each component is calculated as:

**Power of Signal:**
```
PowerOfSignal(j,N) = (1/N) * Σ(|MA(j-n,N)/P(j-N+1)|²)
```

**Power of Noise:**
```
PowerOfNoise(j,N) = (1/N) * Σ(|(P(j-n) - MA(j-n,N))/P(j-N+1)|²)
```

### 3. Power Threshold

The power threshold is based on the ATR normalized by the Standard Instrument Constant (SIC):

```
PowerThreshold(j) = |ATR(j)/SIC(j)|²
```

Where SIC is defined as 1% of the current price.

### 4. Power Ratios

The final metrics used for trading decisions are:

**Signal Power Ratio:**
```
R(Signal) = √((PowerOfSignal(j,N) - 1)/PowerThreshold(j))
```

**Noise Power Ratio:**
```
R(Noise) = √(PowerOfNoise(j,N)/PowerThreshold(j))
```

These ratios represent how many multiples of the ATR the signal and noise components are, respectively.

## Components of the PowerIndicator

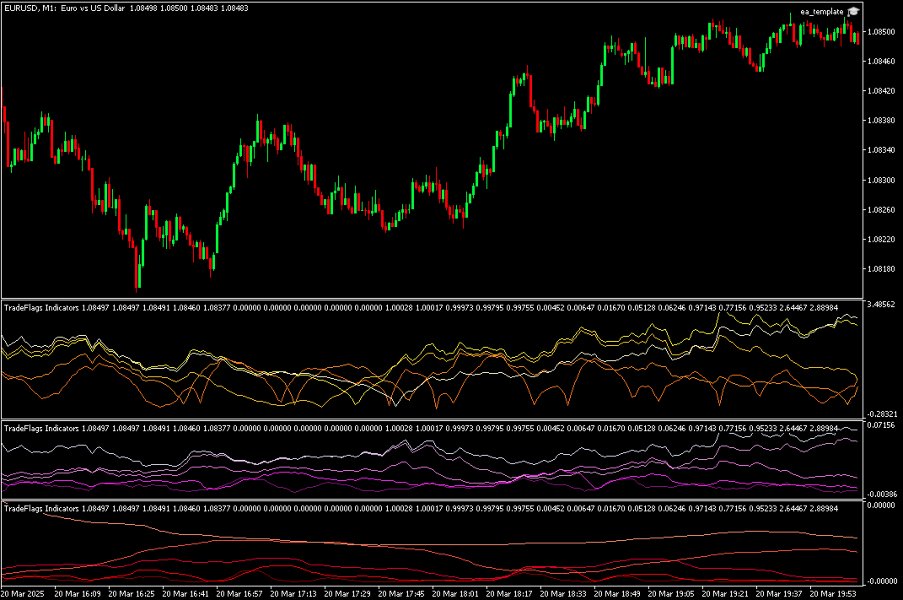
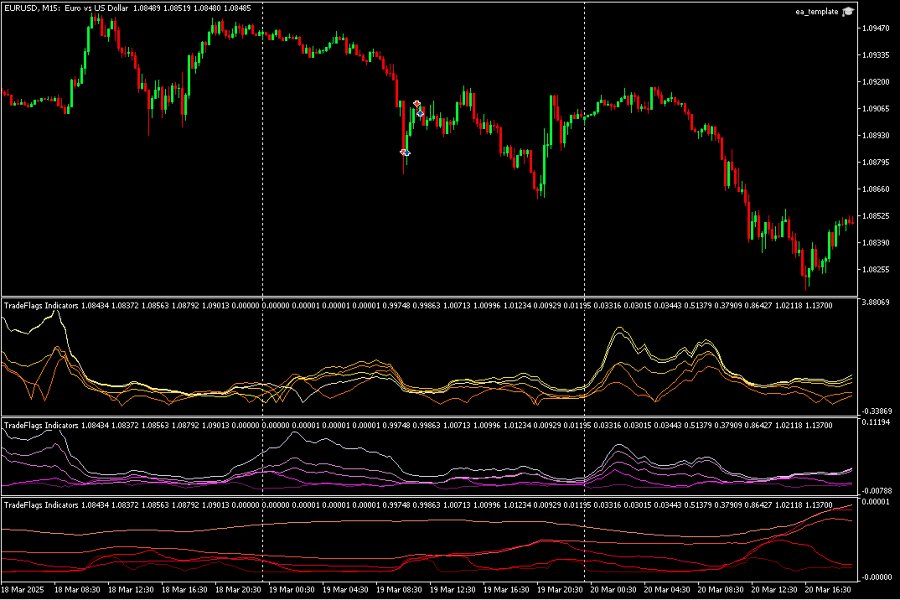
The PowerIndicator.mq5 implementation calculates and displays five sets of metrics, each for five different time periods (10, 20, 50, 100, and 200):

### 1. Price Moving Averages (PMA)
Simple moving averages of price for different periods. These serve as the basis for the signal component.

### 2. Sum Energy (SE)
Measures the normalized squared deviations of price from its moving average. This represents the raw energy of price movements relative to the starting price of each window.

### 3. Sum Energy Moving Average (SEMA)
Measures the squared ratio of moving average to price from period days ago. This represents the energy of the trend component.

### 4. Power Ratio Noise
The square root of the ratio between Sum Energy and the power threshold. This shows how many multiples of the ATR the noise component is.

### 5. Power Ratio Signal
The square root of the ratio between the absolute difference of Sum Energy MA from 1 and the power threshold. This shows how many multiples of the ATR the signal component is.

## Interpretation and Trading Applications

### When to Use the Indicator

The research shows that the Power Ratio of Noise has a stronger relationship to profitability than the Signal Power Ratio, with the 50-day calculation showing the strongest correlation (R² = 0.37).

Based on the research findings:

1. **Trend Strength Assessment**: Higher Power Ratio values (especially above 4) indicate stronger trends that are more likely to be profitable for trend following strategies.

2. **Market Selection**: Use the Power Ratios to rank different markets or securities, focusing on those with the highest values.

3. **Entry Timing**: Consider entering trend following trades when:
- The Power Ratio Noise exceeds 4
- The trend direction is clear (price above/below moving average)

4. **Exit Considerations**: Monitor for decreasing Power Ratios as potential early warning of trend weakness.

### Optimal Settings

The research found:

- A multiplier of 4× ATR for stop-loss placement provides the best results
- The 50-day calculation period shows the strongest correlation with profitability
- Both 30-day and 100-day periods also show significant correlations

## Configuration Options

The PowerIndicator.mq5 implementation provides several configuration options:

```
input int ATR_Period = 14; // ATR Period
input bool Show_PMA = false; // Show Price Moving Averages
input bool Show_SumEnergy = false; // Show Sum Energy
input bool Show_SumEnergyMA = false; // Show Sum Energy MA
input bool Show_PowerRatioNoise = true; // Show Power Ratio Noise
input bool Show_PowerRatioSignal = true; // Show Power Ratio Signal
```

By default, only the Power Ratio Noise and Power Ratio Signal components are displayed, as these are the most directly useful for trading decisions.

## Visual Representation

The indicator uses color coding to distinguish between different time periods:

- **Blue** color scheme for Price Moving Averages (PMA)
- **Red** color scheme for Sum Energy
- **Green** color scheme for Sum Energy MA
- **Purple/Magenta** color scheme for Power Ratio Noise
- **Orange/Yellow** color scheme for Power Ratio Signal

For each metric, darker colors represent shorter time periods (10, 20) while lighter colors represent longer time periods (100, 200).

## Advantages Over Traditional Indicators

The research demonstrates that the Power Ratio metrics outperform Wilder's traditional trend indicators:

- Power Ratio Noise (50-day): R² = 0.37
- ADX: R² = 0.06
- ADXR: R² = 0.07
- DX: R² = 0.05

This indicates that the Power Assisted Trend Following approach provides a more accurate assessment of trend strength and profitability potential.

## Conclusion

The PowerIndicator implements an advanced approach to trend following that addresses a fundamental limitation of traditional methods: determining when a trend is strong enough to trade profitably.

By applying concepts from signal analysis, the indicator provides a more robust framework for:
1. Assessing trend strength
2. Selecting markets with the strongest trends
3. Timing entries into trend following strategies
4. Setting appropriate stop-loss levels

The empirical testing shows that this approach outperforms traditional trend indicators, making it a valuable tool for traders who rely on trend following strategies.

Produtos recomendados
Super Trend Strategy
Minh Khoa Nguyen
5 (1)
The SuperTrend Strategy is a widely-used technical indicator based on the Average True Range (ATR), primarily employed as a trailing stop tool to identify prevailing market trends. The indicator is designed for ease of use while providing reliable insights into the current market trend. It operates based on two key parameters: the period and the multiplier . By default, it uses a period of 15  for the ATR calculation and a multiplier of 3 . The Average True Range (ATR) plays a crucial role in th
FREE
HMA Color with Alerts MT5
Pavel Zamoshnikov
4.74 (54)
Hull Moving Average (HMA) is well-deservedly popular among traders because of the effective averaging of market noise and a relatively small delay. The current MetaTrader 5 version changes its color when the movement direction changes. Sound and text signals are available. It also supports sending email and push messages. It is possible to trigger a signal on the current incomplete bar, although such a signal may be canceled before completion if conditions are no longer appropriate. One of the p
FREE
Descrição geral Este indicador é uma versão aprimorada do Canal Donchian clássico, enriquecida com funções práticas para o trading real. Além das três linhas padrão (máxima, mínima e linha do meio), o sistema detecta breakouts e os mostra visualmente com setas no gráfico, exibindo apenas a linha oposta à direção da tendência atual para uma leitura mais limpa. O indicador inclui: Sinais visuais : setas coloridas nos breakouts Notificações automáticas : alerta pop-up, push e e-mail Filtro RSI : pa
FREE
Follow The Line MT5
Oliver Gideon Amofa Appiah
4.53 (30)
This indicator obeys the popular maxim that: "THE TREND IS YOUR FRIEND" It paints a GREEN line for BUY and also paints a RED line for SELL. (you can change the colors). It gives alarms and alerts of all kinds. IT DOES NOT REPAINT and can be used for all currency pairs and timeframes. Yes, as easy and simple as that. Even a newbie can use it to make great and reliable trades. NB: For best results, get my other premium indicators for more powerful and reliable signals. Get them here: https://www.m
FREE
This indicator is a zero-lag indicator and displays  strength of trend change . True Trend  Oscillator Pro works best in combination with True Trend Moving Average Pro that displays exact trend as is. Oscillator value is exact price change in given direction of the trend. True Trend Moving Average Pro: https://www.mql5.com/en/market/product/103586 If you set PERIOD input parameter to 1 this indicator becomes a sharpshooter for binary options. Developers can use True Trend Oscillator in Exper
FREE
Menora Indicator
Arnold Kurapa
4.5 (2)
Menora (All In One) Indicator. This is the advanced and premium indicator for the Magic Trend, a free indicator.  It has 3 output signals driven by different market conditions. This indicator has a double function of working as an indicator and utility at the same time. Specifications  1]  3 output signals a) Slow Moving Average with color change - The MA has a non-repaint color change, which makes it perfect for entry signals. b) Fast Moving Average (the original Magic Trend line) - Gives a
FREE
Mitimom
Danil Poletavkin
The indicator is based on Robert Miner's methodology described in his book "High probability trading strategies" and displays signals along with momentum of 2 timeframes. A Stochastic oscillator is used as a momentum indicator. The settings speak for themselves period_1 is the current timeframe, 'current' period_2 is indicated - the senior timeframe is 4 or 5 times larger than the current one. For example, if the current one is 5 minutes, then the older one will be 20 minutes The rest of the s
FREE
Infinity Predictor MA
Murtadha Majid Jeyad Al-Khuzaie
Infinity Predictor MA Infinity Predictor MA is a next‑generation forecasting indicator that transforms the traditional Moving Average into a powerful predictive tool. Unlike standard MAs that only smooth past data, this indicator projects the moving average line up to 40 bars into the future, giving traders a unique perspective on potential market direction. The engine behind Infinity Predictor MA combines multiple advanced regression models to capture both smooth trends and sudden market shi
FREE
Support and Ressistance
Raphael Lorenz Baumgartner
Suporte e Resistência do Último Dia Plataforma: MetaTrader 5 Tipo: Indicador personalizado Exibição: Janela do gráfico (sobreposição) Funções: Calcula zonas de suporte e resistência com base nos máximos e mínimos do dia anterior. Usa uma janela deslizante ( SampleWindowSize ) para detectar faixas de preço recentes. Detecta suporte quando a faixa de preços atual está abaixo dos extremos anteriores. Detecta resistência quando a faixa de preços está acima. Mostra quatro buffers: LDResistanceHigh –
FREE
MACD Enhanced
Nikita Berdnikov
5 (1)
Introducing the MACD  Enhanced – an advanced MACD (Moving Average Convergence Divergence) indicator that provides traders with extended capabilities for trend and momentum analysis in financial markets. The indicator uses the difference between the fast and slow exponential moving averages to determine momentum, direction, and strength of the trend, creating clear visual signals for potential entry and exit points. Attention! To achieve the best results, it is recommended to adapt the indicator
FREE
Are you tired of drawing trendlines every time you're analyzing charts? Or perhaps you would like more consistency in your technical analysis. Then this is for you. This indicator will draw trend lines automatically when dropped on a chart. How it works Works similar to standard deviation channel found on mt4 and mt5. It has 2 parameters: 1. Starting Bar 2. Number of bars for calculation The   starting bar   is the bar which drawing of the trend lines will begin, while the   number of bars for c
FREE
HMA5
Sergey Sapozhnikov
4.3 (10)
Hull Moving Average is more sensitive to the current price activity than a traditional Moving Average. It faster responds to trend change and more shows the price movement more accurately. This is a color version of the indicator. This indicator has been developed based in the original version created by Sergey <wizardserg@mail.ru>. Suitable for all timeframes. Parameters Period - smoothing period, recommended values are 9 to 64. The larger the period, the softer the light. Method - smoothing m
FREE
This is a free version of the indicator, the period between the vertical lines is always 30 bars. In the paid version the period can be set by user, so a configuration with many ThreePointsChannel indicators with different periods is possible. The principle of construction - on top of any number of bars set by the user, a channel is constructed with maximum and minimum lines so that the bars touch the maximum and minimum of the channel at exactly three points. The name of the indicator follows
FREE
Indicator and Expert Adviser  EA Available in the comments section of this product. Download with Indicator must have indicator installed for EA to work. Mt5 indicator alerts for bollinger band and envelope extremes occurring at the same time. Buy signal alerts occur when A bullish candle has formed below both the lower bollinger band and the lower envelope  Bar must open and close below both these indicators. Sell signal occur when A bear bar is formed above the upper bollinger band and upper
FREE
Stat Monitor 5
Sergei Linskii
5 (1)
Stat Monitor is a good information indicator. Benefits of the indicator: The indicator provides useful information - the current spread, the cost of one lot of the symbol, trading leverage and the recommended lot size for trading. You can use the indicator on the MetaTrader 5 trading platform of any broker. The indicator provides useful information. Version of the Stat Monitor indicator for MetaTrader 4 I wish you all good luck in trading and stable profit!
FREE
Important Lines
Terence Gronowski
4.87 (23)
This indicator displays Pivot-Lines, preday high and low, preday close and the minimum and maximum of the previous hour. You just have to put this single indicator to the chart to have all these important lines, no need to setup many single indicators. Why certain lines are important Preday high and low : These are watched by traders who trade in a daily chart. Very often, if price climbs over or falls under a preday low/high there is an acceleration in buying/selling. It is a breakout out of a
FREE
Dynamic Supply and Demand indicator automatically identifies and displays Supply and Demand Zones on your chart based on price action patterns and market structure.  These zones represent areas where institutional buying or selling pressure has historically occurred, making them key levels for potential price reactions. This form of indicator takes inspiration from ICT as well as traditional Support & Resistance formation. **For the first 50 candles (number depends on LookBackCandles) when indic
FREE
YOU CAN NOW DOWNLOAD FREE VERSIONS OF OUR PAID INDICATORS . IT'S OUR WAY OF GIVING BACK TO THE COMMUNITY ! >>>    GO HERE TO DOWNLOAD This system is an Heiken Ashi system based on RSI calculations . The system is a free open source script originally published on TradingView by JayRogers . We have taken the liberty of converting the pine script to Mq4 indicator . We have also added a new feature which enables to filter signals and reduces noise on the arrow signals. Background HEIKEN ASHI Th
FREE
Magic 7 Indicator
Marek Pawel Szczesny
Overview Magic 7 Indicator is a comprehensive MetaTrader 5 (MQL5) indicator that identifies seven different trading scenarios based on candlestick patterns and technical analysis. The indicator combines traditional price action patterns with modern concepts like Fair Value Gaps (FVG) to provide trading signals with precise entry points and stop loss levels. Features 7 Trading Scenarios : Each scenario identifies specific market conditions and trading opportunities Visual Signals : Clear buy/sell
FREE
Reversal Candles MT5
Nguyen Thanh Cong
4.83 (6)
Introduction Reversal Candles is a cutting-edge non-repainting   forex indicator designed to predict price reversals with remarkable accuracy through a sophisticated combination of signals. Signal Buy when the last closed candle has a darker color (customizable) and an up arrow is painted below it Sell when the last closed candle has a darker color (customizable) and a down arrow is painted above it
FREE
Dual RSI
Paul Conrad Carlson
3 (1)
Indicator alerts for Dual Relative strength index rsi. Large rsi preset at 14 is below 30 small rsi preset at 4 is below 10 for buy bullish signals . Large rsi preset are 14 is above 70 small rsi preset at 4 is above 90 for sell bearish signals . Includes mobile and terminal alerts. draws lines when alerts. This indicator can help identify extremes and then the tops or bottoms of those extremes .
FREE
Multi-timeframe trend indicator based on the ADX / ADXWilder indicator with Fibonacci levels The indicator shows trend areas using ADX or ADXWilder indicator data from multiple timeframes. The impulse mode of the indicator allows you to catch the beginning of a trend, and several "Screens" with different timeframes allow you to filter out market noise. Fibonacci levels are added to the price chart, which have flexible settings. How the indicator works: if PDI is greater than NDI, then   it`s
FREE
Auto Fibonacci
Ali Gokay Duman
5 (3)
This indicator calculates fibonacci levels via moving averages trend and draw these lines. You can change fast and slow Moving Averages settings for customization. Inputs: Fast MA Time Period :  64 Fast MA Shift: 0 Fast MA Method: Smoothed Fast MA Apply To: Median Price Slow MA Time Period: 32 Slow MA Shift: 0 Slow MA Method: Smoothed Slow MA Apply To: Median Price ZigZag: False ZigZag Color: Red ZigZag Type: DashDot ZigZag Width: VeryThin Fibo Settings TrendFibonacci: True FiboTrendColor: Black
FREE
HA Heikin Ashi
Giuseppe Papa
5 (1)
L'indicatore "Heikin Ashi" è stato progettato per migliorare l'analisi dei grafici finanziari con un sistema di candele Heikin Ashi. Le candele Heikin Ashi sono un metodo avanzato per visualizzare il prezzo, che aiuta a filtrare il rumore del mercato, rendendo più chiara l'interpretazione dei trend e migliorando la qualità delle decisioni di trading. Questo indicatore consente di visualizzare le candele Heikin Ashi al posto delle candele giapponesi tradizionali, rendendo l'analisi grafica più pu
FREE
Indicador Heiken Ashi MT5 Eleve sua análise de mercado com o Indicador Heiken Ashi MT5. Esta poderosa ferramenta transforma os dados de preços padrão em velas mais suaves, focadas em tendências, facilitando a identificação de tendências de mercado e potenciais pontos de reversão. Características principais: Identificação clara de tendências: Distingue visualmente entre tendências de alta e baixa com cores de velas distintas. Redução de ruído: Filtra as flutuações de preços, proporcionando uma v
FREE
Coral Indi
Dinh Duong Luong
Coral trend is   a trend-following indicator that is widely popular among FOREX traders . It is usually used as a confluence with other indicators. It uses combinations of moving averages with complex smoothing formulas! It has two configurable parameters: Coefficient   - smoothing ratio (*) Applied price Calculation: Coral = (-0.064) * B6 + 0.672 * B5 - 2.352 * B4 + 2.744 * B3
FREE
Statistical Arbitrage Spread Generator for Cointegration [MT5] What is Pair Trading? Pair trading is a market-neutral strategy that looks to exploit the relative price movement between two correlated assets — instead of betting on the direction of the market. The idea? When two assets that usually move together diverge beyond a statistically significant threshold, one is likely mispriced. You sell the expensive one, buy the cheap one , and profit when they converge again. It’s a statistica
FREE
如果产品有任何问题或者您需要在此产品上添加功能,请联系我 Contact/message me if you encounter any issue using the product or need extra feature to add on the base version. Floating Highest Lowest MT5 provides you an intuitive and user-friendly method to monitor the floating highest (profit) and lowest (loss) that all your trades together ever arrive. For example, I opened 3 orders, which arrived at $4.71 floating profit when trade following trend. Later when the trend is against me, these 3 orders arrive $30 in loss, and a
FREE
O indicador identifica quando ocorre uma divergência entre o preço e um indicador ou oscilador. Ele identifica divergências regulares e ocultas. Combinado com suas próprias regras e técnicas, este indicador permitirá que você crie (ou aprimore) seu próprio sistema poderoso. Recursos Pode detectar divergências para os seguintes osciladores / indicadores:       MACD, OsMA, Stochastics, RSI, CCI, RVI, Awesome, ADX, ATR, OBV, Índice composto, MFI e Momentum. Apenas um oscilador / indicador pode ser
FREE
Trend indicator based on the ADX / ADXWilder indicator The indicator shows trend areas using ADX or ADXWilder indicator data. How the indicator works: if PDI is greater than NDI, then it`s bullish movement; if PDI is less than NDI, then it`s bearish movement; if ADX is less than or equal to the filter value specified in the parameters, then there is no movement state. Input parameters of the indicator: Calculate Timeframe - timeframe for calculation; ADX Type - type of ADX calculation based
FREE
Os compradores deste produto também adquirem
Divergence Bomber
Ihor Otkydach
4.99 (74)
Cada comprador deste indicador recebe adicionalmente, e de forma gratuita: A ferramenta exclusiva "Bomber Utility", que acompanha automaticamente cada operação, define os níveis de Stop Loss e Take Profit e fecha operações de acordo com as regras da estratégia; Arquivos de configuração (set files) para ajustar o indicador em diferentes ativos; Set files para configurar o Bomber Utility nos modos: "Risco Mínimo", "Risco Balanceado" e "Estratégia de Espera"; Um vídeo tutorial passo a passo que aju
Se você comprar este indicador, receberá meu Gerenciador de Operações Profissional GRATUITAMENTE. Primeiramente, vale ressaltar que este Sistema de Trading é um Indicador Não Repintado, Não Redesenho e Não Atrasado, o que o torna ideal tanto para o trading manual quanto para o automatizado. Curso online, manual e download de predefinições. O "Sistema de Trading Inteligente MT5" é uma solução completa de trading projetada para traders novos e experientes. Ele combina mais de 10 indicadores premi
*** Entry In The Zone and SMC Multi Timeframe é uma ferramenta de análise de mercado em tempo real desenvolvida com base na estrutura Smart Money Concepts (SMC). Desenvolvemos o Entry In The Zone e o SMC Multi Timeframe para ajudar os traders a analisarem a estrutura de mercado de forma mais sistemática e clara, com o objetivo de aumentar a eficiência das negociações e criar sustentabilidade a longo prazo para a sua estratégia. Esta ferramenta foi desenvolvida com base na estrutura Smart Money C
Smart Stop Indicator – Precisão inteligente de stop-loss diretamente no gráfico Visão geral O Smart Stop Indicator é a solução ideal para traders que desejam definir o stop-loss de maneira clara e metódica, em vez de adivinhar ou depender da intuição. A ferramenta combina lógica clássica de price action (topos mais altos, fundos mais baixos) com detecção moderna de rompimentos, identificando onde realmente está o próximo nível lógico de stop. Seja em mercados tendenciais, laterais ou em fases
O Game Changer é um indicador de tendências revolucionário, concebido para ser utilizado em qualquer instrumento financeiro, transformando o seu metatrader num poderoso analisador de tendências. O indicador não se retraça nem apresenta atrasos. Funciona em qualquer período de tempo e auxilia na identificação de tendências, sinaliza potenciais reversões, atua como um mecanismo de trailing stop e fornece alertas em tempo real para respostas rápidas do mercado. Quer seja um profissional experiente
Trend Screener Pro MT5
STE S.S.COMPANY
4.84 (97)
Desbloqueie o poder da negociação de tendências com o indicador Trend Screener: sua solução definitiva de negociação de tendências, alimentada por lógica difusa e sistema de múltiplas moedas! Eleve sua negociação de tendências com o Trend Screener, o revolucionário indicador de tendências alimentado por lógica difusa. É um poderoso indicador de acompanhamento de tendências que combina mais de 13 ferramentas e recursos premium e 3 estratégias de negociação, tornando-o uma escolha versátil para to
- Real price is 80$ - 45% Discount (It is 45$ now) Contact me for extra bonus   indicator, instruction or any questions! - Lifetime update free - Non-repaint - Related product: Gann Gold EA - I just sell my products in Elif Kaya Profile, any other websites are stolen old versions, So no any new updates or support. Advantages of  M1 Scalper Pro  Profitability: M1 Scalper Pro is highly profitable with a strict exit strategy. Frequent Opportunities: M1 Scalper Pro  takes advantage of numerous smal
FX Power MT5 NG
Daniel Stein
5 (24)
FX Power: Analise a Força das Moedas para Decisões de Negociação Mais Inteligentes Visão Geral FX Power é a sua ferramenta essencial para compreender a força real das principais moedas e do ouro em quaisquer condições de mercado. Identificando moedas fortes para comprar e fracas para vender, FX Power simplifica as decisões de negociação e revela oportunidades de alta probabilidade. Quer você prefira seguir tendências ou antecipar reversões usando valores extremos de Delta, esta ferramenta adap
Quantas vezes você comprou um indicador de negociação com ótimos backtests, prova de desempenho em conta real com números fantásticos e estatísticas por toda parte, mas depois de usá-lo, você acaba perdendo sua conta? Você não deve confiar em um sinal por si só, você precisa saber por que ele apareceu em primeiro lugar, e é isso que o RelicusRoad Pro faz de melhor! Manual do Usuário + Estratégias + Vídeos de Treinamento + Grupo Privado com Acesso VIP + Versão Móvel Disponível Uma Nova Maneira d
Grabber System MT5
Ihor Otkydach
5 (20)
Apresento a você um excelente indicador técnico: Grabber, que funciona como uma estratégia de trading “tudo incluído”, pronta para usar. Em um único código estão integradas ferramentas poderosas de análise técnica de mercado, sinais de entrada (setas), funções de alertas e notificações push. Cada comprador deste indicador também recebe gratuitamente: Utilitário Grabber: ferramenta para gerenciamento automático de ordens abertas Vídeo tutorial passo a passo: como instalar, configurar e operar com
Gold Sniper Scalper Pro
Ich Khiem Nguyen
5 (1)
Gold Sniper Scalper Pro - Sistema de Negociação de Ouro (XAU/USD) no MetaTrader 5 Para o negociador sério: Aborde a negociação de Ouro com uma metodologia estruturada e baseada em dados que combina múltiplos fatores de análise de mercado. Esta ferramenta foi construída para apoiar a sua análise de negociação de Ouro. Oportunidade de Preço Limitada Esta é uma chance de possuir o Gold Sniper Scalper Pro antes que o preço aumente. O preço do produto aumentará $50 após cada 10 compras subsequentes.
Atomic Analyst MT5
Issam Kassas
4.22 (23)
Primeiramente, vale ressaltar que este Indicador de Negociação não repinta, não redesenha e não apresenta atrasos, tornando-o ideal tanto para negociação manual quanto automatizada. Manual do utilizador: configurações, entradas e estratégia. O Analista Atômico é um Indicador de Ação de Preço PA que utiliza a força e o momentum do preço para encontrar uma vantagem melhor no mercado. Equipado com filtros avançados que ajudam a remover ruídos e sinais falsos, e aumentam o potencial de negociação.
Trend indicator AI mt5
Ramil Minniakhmetov
4.67 (12)
O indicador Trend Ai é uma ótima ferramenta que irá melhorar a análise de mercado de um trader, combinando a identificação de tendências com pontos de entrada acionáveis e alertas de reversão. Este indicador permite que os usuários naveguem pelas complexidades do mercado forex com confiança e precisão Além dos sinais primários, o indicador Trend Ai identifica pontos de entrada secundários que surgem durante retrações ou retrações, permitindo que os comerciantes capitalizem as correções de preço
Advanced Supply Demand MT5
Bernhard Schweigert
4.5 (14)
Atualmente com 33% de desconto! A melhor solução para qualquer Trader Novato ou especialista! Este indicador é uma ferramenta de negociação exclusiva, de alta qualidade e acessível porque incorporamos uma série de recursos proprietários e uma nova fórmula. Com esta atualização, você poderá mostrar fusos horários duplos. Você não só será capaz de mostrar um TF mais alto, mas também mostrar ambos, o TF do gráfico, MAIS o TF mais alto: MOSTRANDO ZONAS ANINHADAS. Todos os traders de Oferta e Demanda
Quantum Heiken Ashi PRO MT5
Bogdan Ion Puscasu
4.44 (9)
Apresentando o   Quantum Heiken Ashi PRO Projetadas para fornecer informações claras sobre as tendências do mercado, as velas Heiken Ashi são conhecidas por sua capacidade de filtrar o ruído e eliminar sinais falsos. Diga adeus às confusas flutuações de preços e olá para uma representação gráfica mais suave e confiável. O que torna o Quantum Heiken Ashi PRO verdadeiramente único é sua fórmula inovadora, que transforma os dados tradicionais de velas em barras coloridas fáceis de ler. As barras ve
Step into the world of Forex trading with confidence, clarity, and precision using Gold Indicator a next-generation tool engineered to take your trading performance to the next level. Whether you’re a seasoned professional or just beginning your journey in the currency markets, Gold Indicator equips you with powerful insights and help you trade smarter, not harder. Built on the proven synergy of three advanced indicators, Gold Indicator focuses exclusively on medium and long-term trends elimina
Matrix Arrow Indicator MT5
Juvenille Emperor Limited
5 (16)
O   Matrix Arrow Indicator MT5   é uma tendência única 10 em 1 seguindo um indicador multi-timeframe   100% sem repintura   que pode ser usado em todos os símbolos/instrumentos:   forex ,   commodities ,   criptomoedas ,   índices ,   ações .  O  Matrix Arrow Indicator MT5  determinará a tendência atual em seus estágios iniciais, reunindo informações e dados de até 10 indicadores padrão, que são: Índice de movimento direcional médio (ADX) Índice de canal de commodities (CCI) Velas clássicas de
FX Volume MT5
Daniel Stein
4.86 (21)
FX Volume: Vivencie o Verdadeiro Sentimento de Mercado sob a Perspectiva de um Corretor Visão Geral Rápida Quer aprimorar sua abordagem de trading? FX Volume fornece insights em tempo real sobre como traders de varejo e corretores estão posicionados—bem antes de relatórios atrasados como o COT. Seja para buscar ganhos consistentes ou simplesmente ter uma vantagem mais clara no mercado, FX Volume ajuda você a detectar grandes desequilíbrios, confirmar rompimentos e aperfeiçoar sua gestão de ris
ARIPoint
Temirlan Kdyrkhan
1 (1)
ARIPoint is a powerful trading companion designed to generate high-probability entry signals with dynamic TP/SL/DP levels based on volatility. Built-in performance tracking shows win/loss stats, PP1/PP2 hits, and success rates all updated live. Key Features: Buy/Sell signals with adaptive volatility bands Real-time TP/SL/DP levels based on ATR Built-in MA Filter with optional ATR/StdDev volatility Performance stats panel (Success, Profit/Loss, PP1/PP2) Alerts via popup, sound, push, or email Cu
Atbot
Zaha Feiz
4.69 (54)
AtBot: Como funciona e como usá-lo ### Como funciona O indicador "AtBot" para a plataforma MT5 gera sinais de compra e venda usando uma combinação de ferramentas de análise técnica. Ele integra a Média Móvel Simples (SMA), a Média Móvel Exponencial (EMA) e o índice de Faixa Verdadeira Média (ATR) para identificar oportunidades de negociação. Além disso, pode utilizar velas Heikin Ashi para melhorar a precisão dos sinais. Deixe uma avaliação após a compra e receba um presente especial. ### Princ
TPSproTREND PrO MT5
Roman Podpora
4.72 (18)
Compre o TREND PRO agora e ganhe outro indicador de tendência avançado de graça Para receber, escreva em mensagens privadas. ИНСТРУКЦИЯ RUS       -    INSTRUCTIONS  ENG      -      VERSION MT4     -  Principais funções: Sinais de entrada precisos SEM RENDERIZAÇÃO! Se aparecer um sinal, ele permanece relevante! Esta é uma diferença importante em relação aos indicadores de redesenho, que podem fornecer um sinal e depois alterá-lo, o que pode levar à perda de fundos depositados. Agora você pode e
AriX
Temirlan Kdyrkhan
1 (4)
AriX Indicator for MT5 A powerful trend-following and signal-evaluation tool AriX is a custom MT5 indicator that combines Moving Averages and ATR-based risk/reward logic to generate clear buy/sell signals. It visualizes dynamic SL/TP levels, evaluates past trade outcomes, and displays win/loss statistics in a clean on-chart panel. Key features include: Buy/Sell signals based on MA crossovers ATR-based SL/TP1/TP2/TP3 levels with visual lines and labels Signal outcome tracking with real-time stat
Easy Buy Sell is a market indicator for opening and closing positions. It becomes easy to track market entries with alerts. It indicates trend reversal points when a price reaches extreme values ​​and the most favorable time to enter the market. it is as effective as a Fibonacci to find a level but it uses different tools such as an algorithm based on ATR indicators and Stochastic Oscillator. You can modify these two parameters as you wish to adapt the settings to the desired period. It cannot
Este é um indicador para MT5 que fornece sinais precisos para entrar em uma negociação sem redesenhar. Ele pode ser aplicado a qualquer ativo financeiro: forex, criptomoedas, metais, ações, índices. Ele fornecerá estimativas bastante precisas e informará quando é melhor abrir e fechar um negócio. Assista o vídeo (6:22) com um exemplo de processamento de apenas um sinal que compensou o indicador! A maioria dos traders melhora seus resultados de negociação durante a primeira semana de negociação c
O Support And Resistance Screener está em um indicador de nível para MetaTrader que fornece várias ferramentas dentro de um indicador. As ferramentas disponíveis são: 1. Screener de estrutura de mercado. 2. Zona de retração de alta. 3. Zona de retração de baixa. 4. Pontos de Pivô Diários 5. Pontos Pivot semanais 6. Pontos Pivot mensais 7. Forte suporte e resistência com base no padrão harmônico e volume. 8. Zonas de nível de banco. OFERTA POR TEMPO LIMITADO: O indicador de suporte e resistência
Shock Pullback
Suleiman Alhawamdah
De forma simples, você pode começar a operar quando o movimento dos números brancos — conhecidos como "pips" — começar a aparecer ao lado do candle atual. Os "pips" brancos indicam que uma operação de compra ou venda está ativa e se movendo na direção correta, conforme indicado pela cor branca. Quando o movimento dos pips brancos para e se transforma em uma cor verde estática, isso sinaliza o fim do momento atual. A cor verde dos números representa o lucro total obtido em "pips", independenteme
Gold Entry Sniper
Tahir Mehmood
5 (1)
Gold Entry Sniper – Painel ATR Multi-Tempo Profissional para Scalping e Swing Trading em Ouro Gold Entry Sniper é um indicador avançado para MetaTrader 5 projetado para fornecer sinais de compra/venda precisos para XAUUSD e outros ativos, com base na lógica de Trailing Stop ATR e análise multi-tempo . Ideal tanto para scalpers quanto para swing traders. Principais Recursos e Vantagens Análise Multi-Tempo – Veja a tendência de M1, M5 e M15 em um único painel. Trailing Stop Baseado em ATR – Níveis
SuperScalp Pro — Scalper Supertrend híbrido O SuperScalp Pro expande o conceito clássico do Supertrend transformando-o em um instrumento híbrido de scalping, projetado para setups de curto a médio prazo em vários timeframes (M1–H1). O indicador combina uma banda Supertrend visualmente intuitiva com múltiplas métricas de confirmação opcionais para fornecer entradas de alta probabilidade, mantendo a gestão de risco simples: níveis de stop loss e take profit são calculados dinamicamente a partir do
Antes de tudo, vale ressaltar que esta Ferramenta de Negociação é um Indicador Não Repintante, Não Redesenhante e Não Atrasado, o que a torna ideal para negociação profissional. Curso online, manual do utilizador e demonstração. O Indicador de Conceitos de Ação de Preço Inteligente é uma ferramenta muito poderosa tanto para traders novos quanto experientes. Ele combina mais de 20 indicadores úteis em um único, combinando ideias avançadas de negociação como Análise do Trader do Círculo Interno
Gold Scalper Pro PSAR ADX Dashboard MT5 (Versão 3.92 – Pares Aprimorados) Indicador profissional de múltiplos períodos de tempo com detecção avançada de sinais. Visão geral O Parabolic SAR V3 + ADX é um indicador técnico avançado que combina a capacidade de acompanhamento de tendência do Parabolic Stop and Reverse (PSAR) com a medição da força de tendência do Average Directional Index (ADX). Esta versão aprimorada apresenta otimização específica por par, sistema de alertas multilíngue e um paine
Mais do autor
A Trend Following Indicator that switches directions based on a Stop-and-Reverse Price (based on Wilders algorithm) and in parallel a Stop-Loss that contracts when the profit exceeds the risk capital ( ACC*ATR ) progressively up to user defined max % level ( AF_MAX ). The basis of this indicator is the Volatility method described in Wilders book from 1975 "New Concepts in Technical Trading Systems".  I have used this on Crypto and Stocks and Forex. The ACC (Acceleration Factor) is setup to run
# Optimised Wilders Trend Following AutoAdjusting VixControlled Expert Advisor ## Overview The Optimised Wilders Trend Following AutoAdjusting VixControlled Expert Advisor is an advanced trading system for MetaTrader 5 that implements a sophisticated trend following strategy based on Welles Wilder's concepts, enhanced with modern risk management techniques. This EA combines multiple innovative features to adapt to changing market conditions while maintaining strict risk control parameters. #
HMM4 Indicator Documentation HMM4 Indicator Documentation Introduction The HMM4 indicator is a powerful technical analysis tool that uses a 4-Gaussian Hidden Markov Model (HMM) to identify market regimes and predict potential market direction. This indicator applies advanced statistical methods to price data, allowing traders to recognize bull and bear market conditions with greater accuracy. The indicator displays a stacked line chart in a separate window, representing the mixture weights of f
Filtro:
Sem comentários
Responder ao comentário