SupplyDemandZoneLines

Indicadores-chave de preços da zona de oferta e demanda
fundo
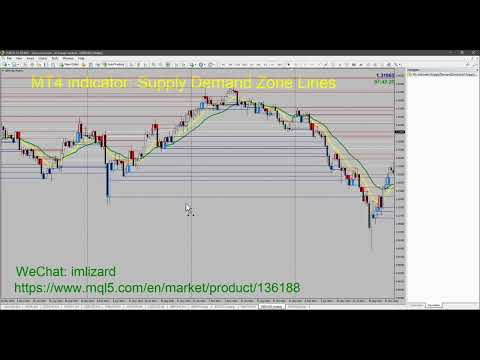
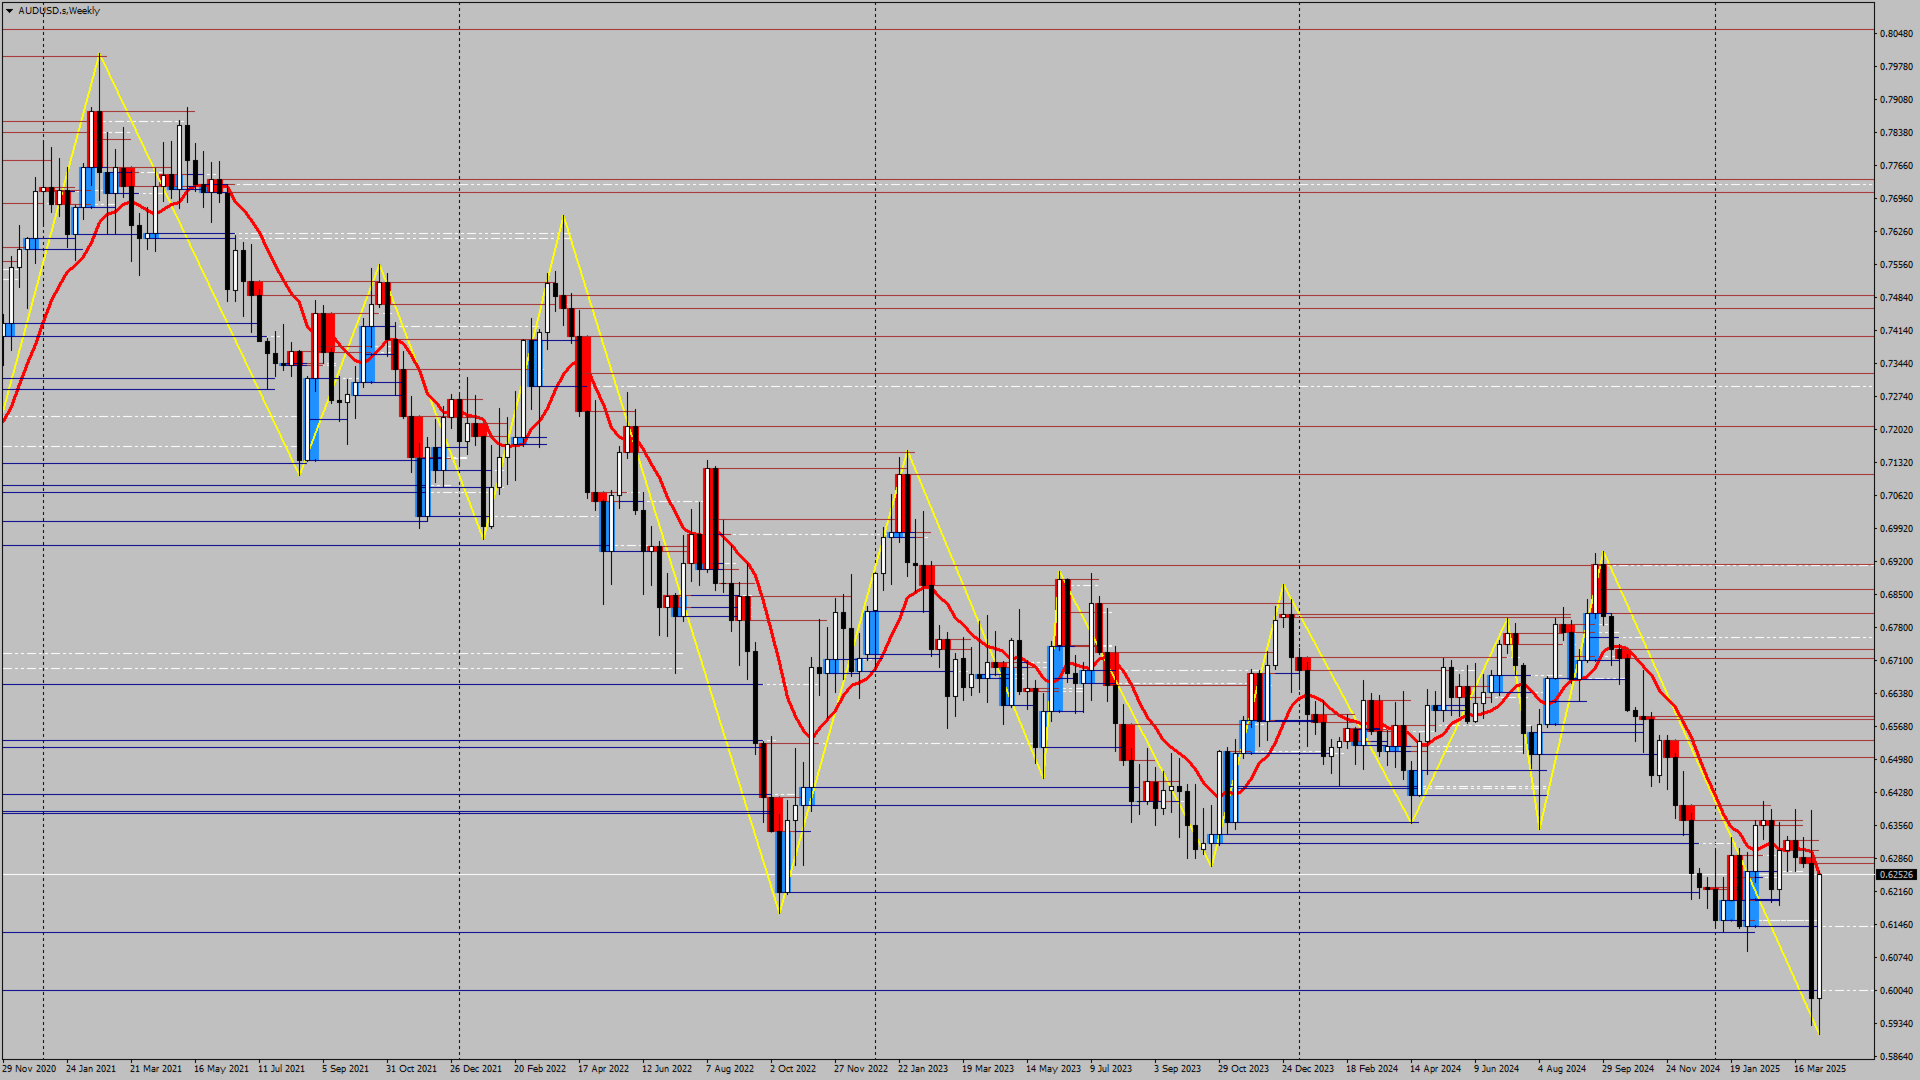
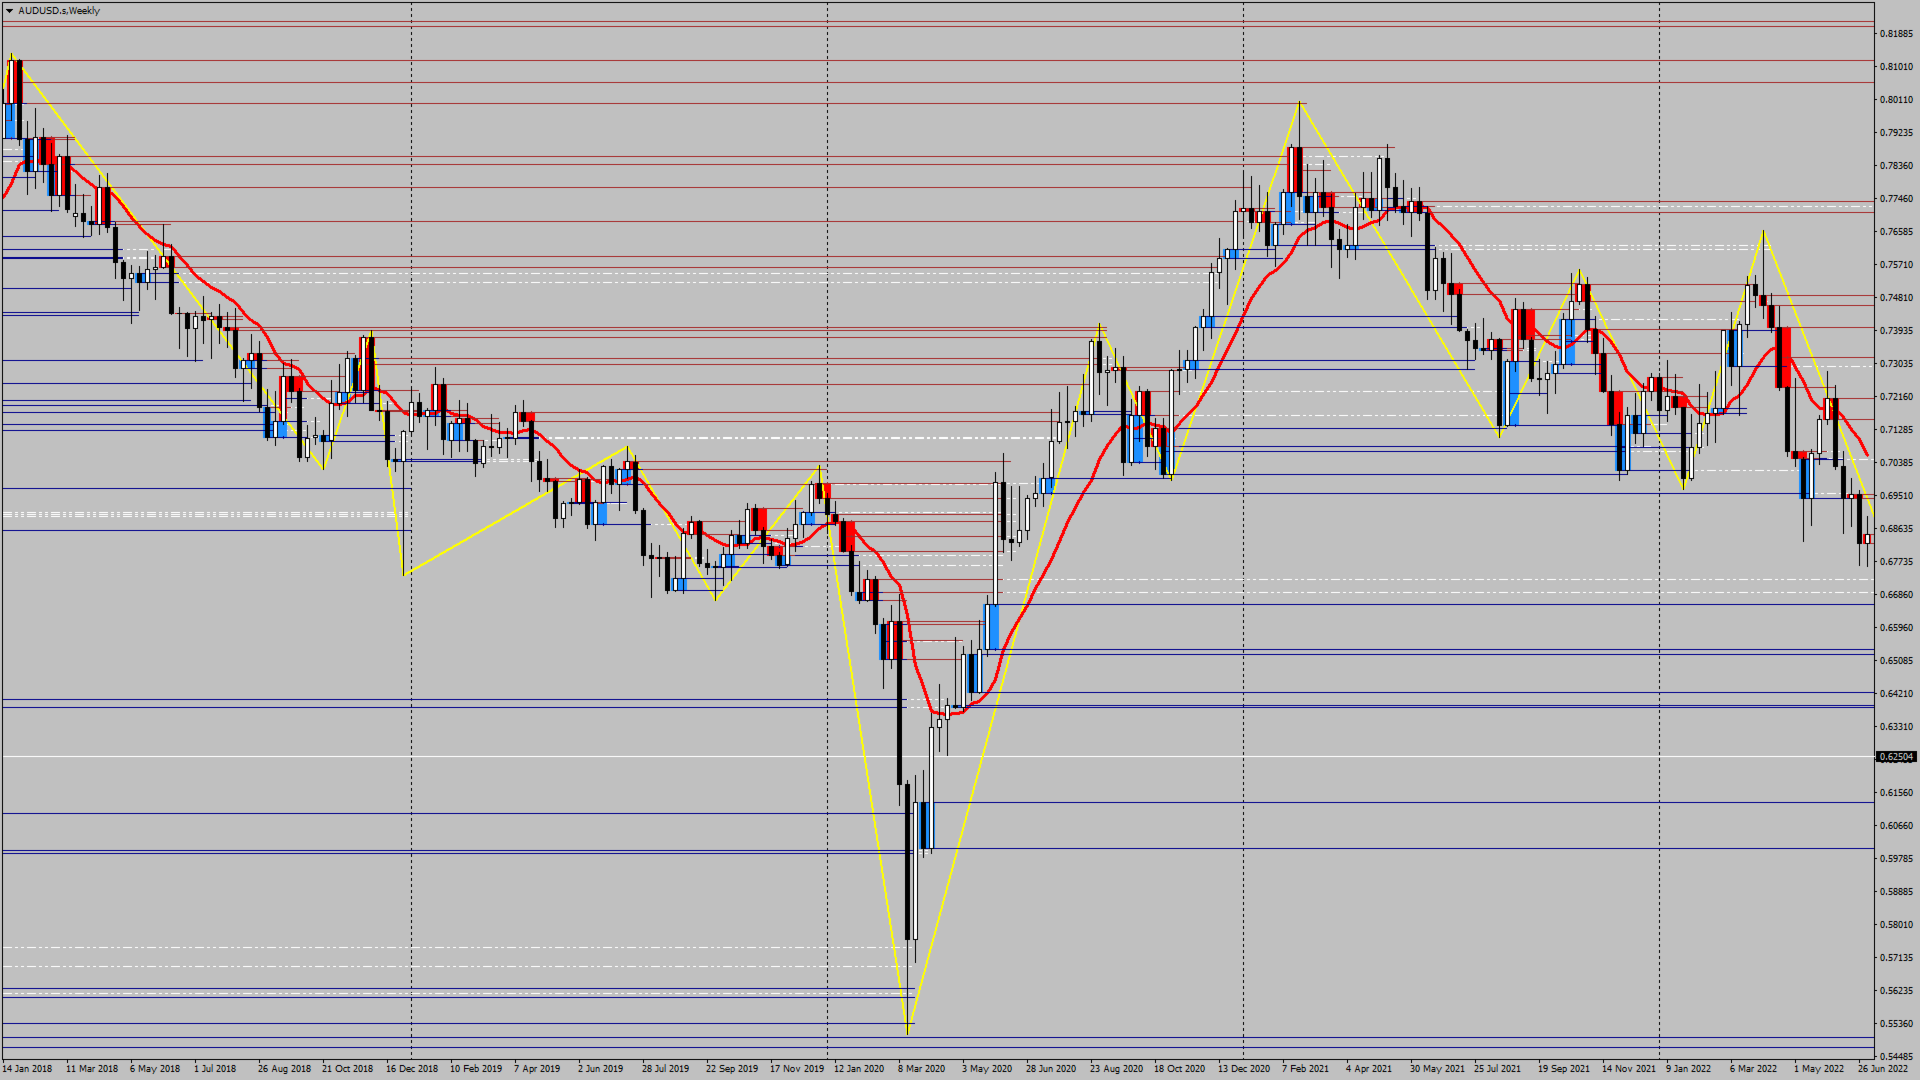
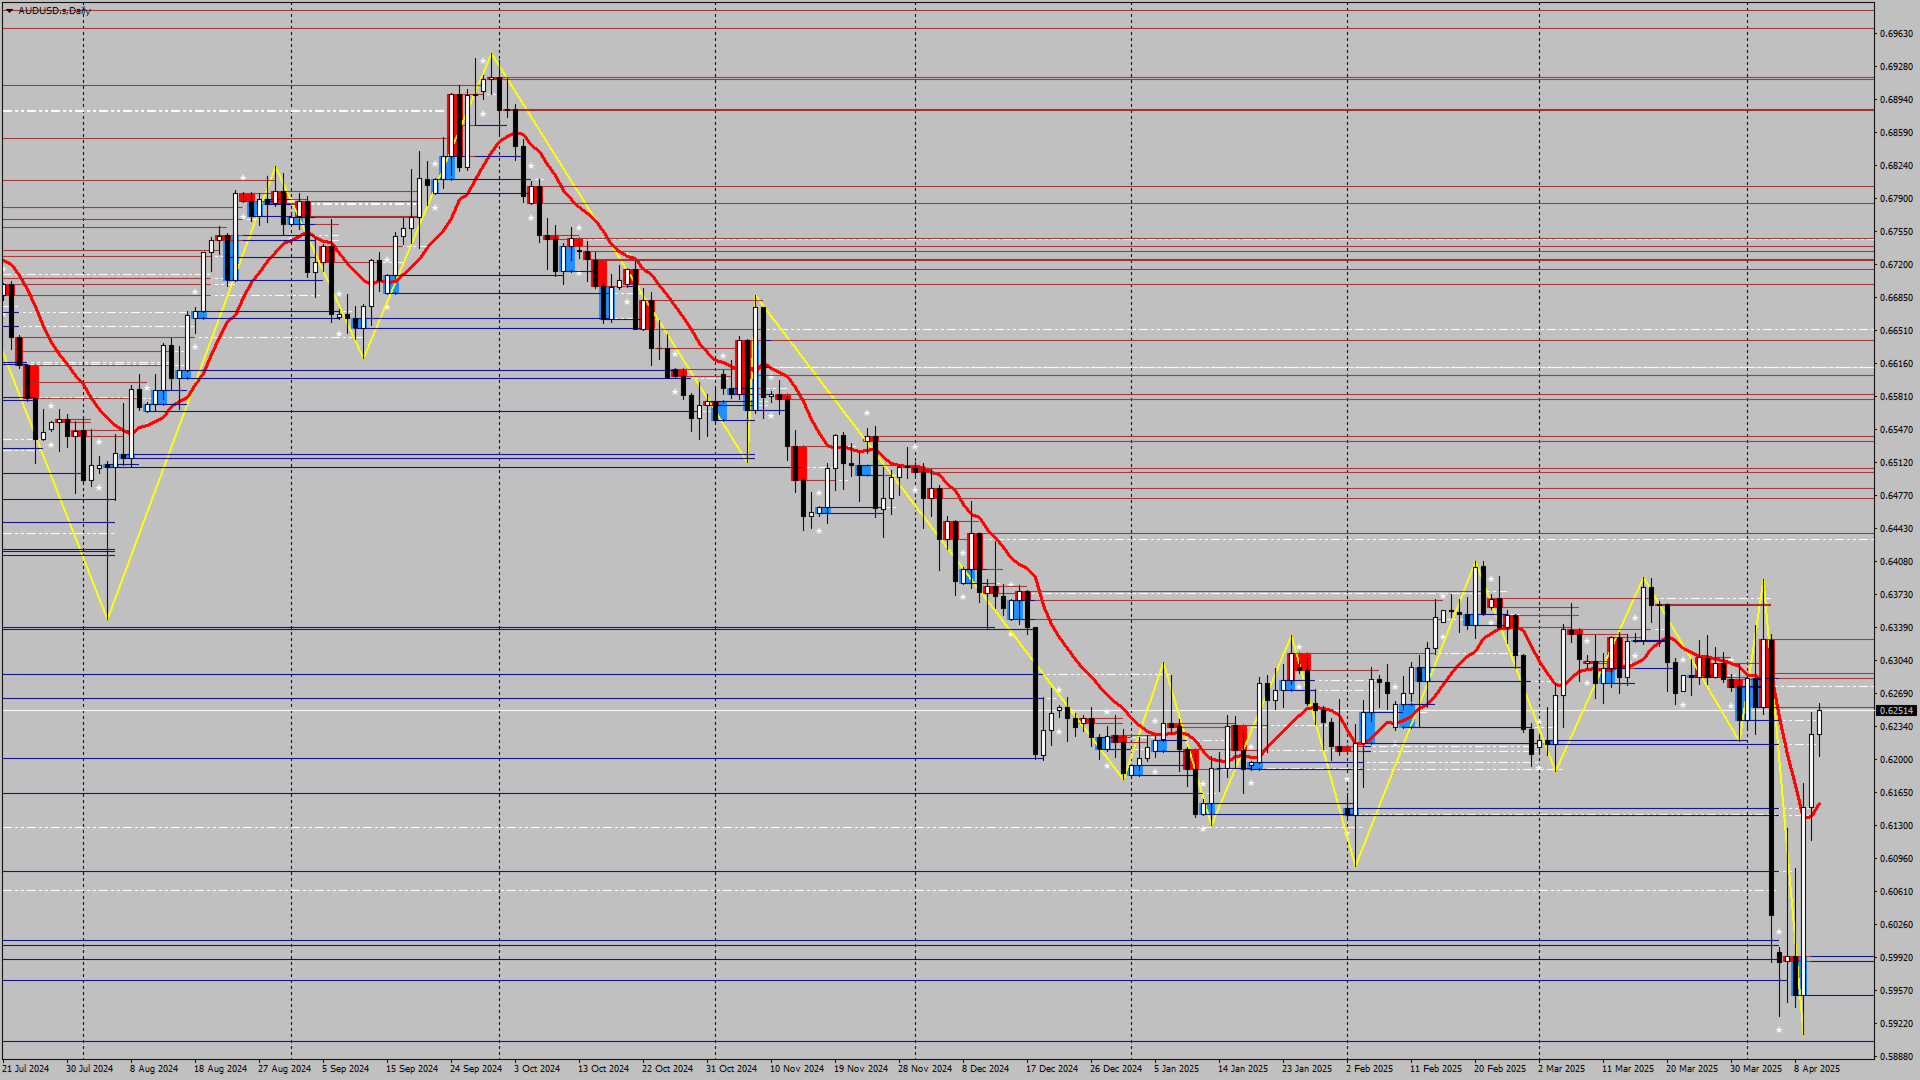
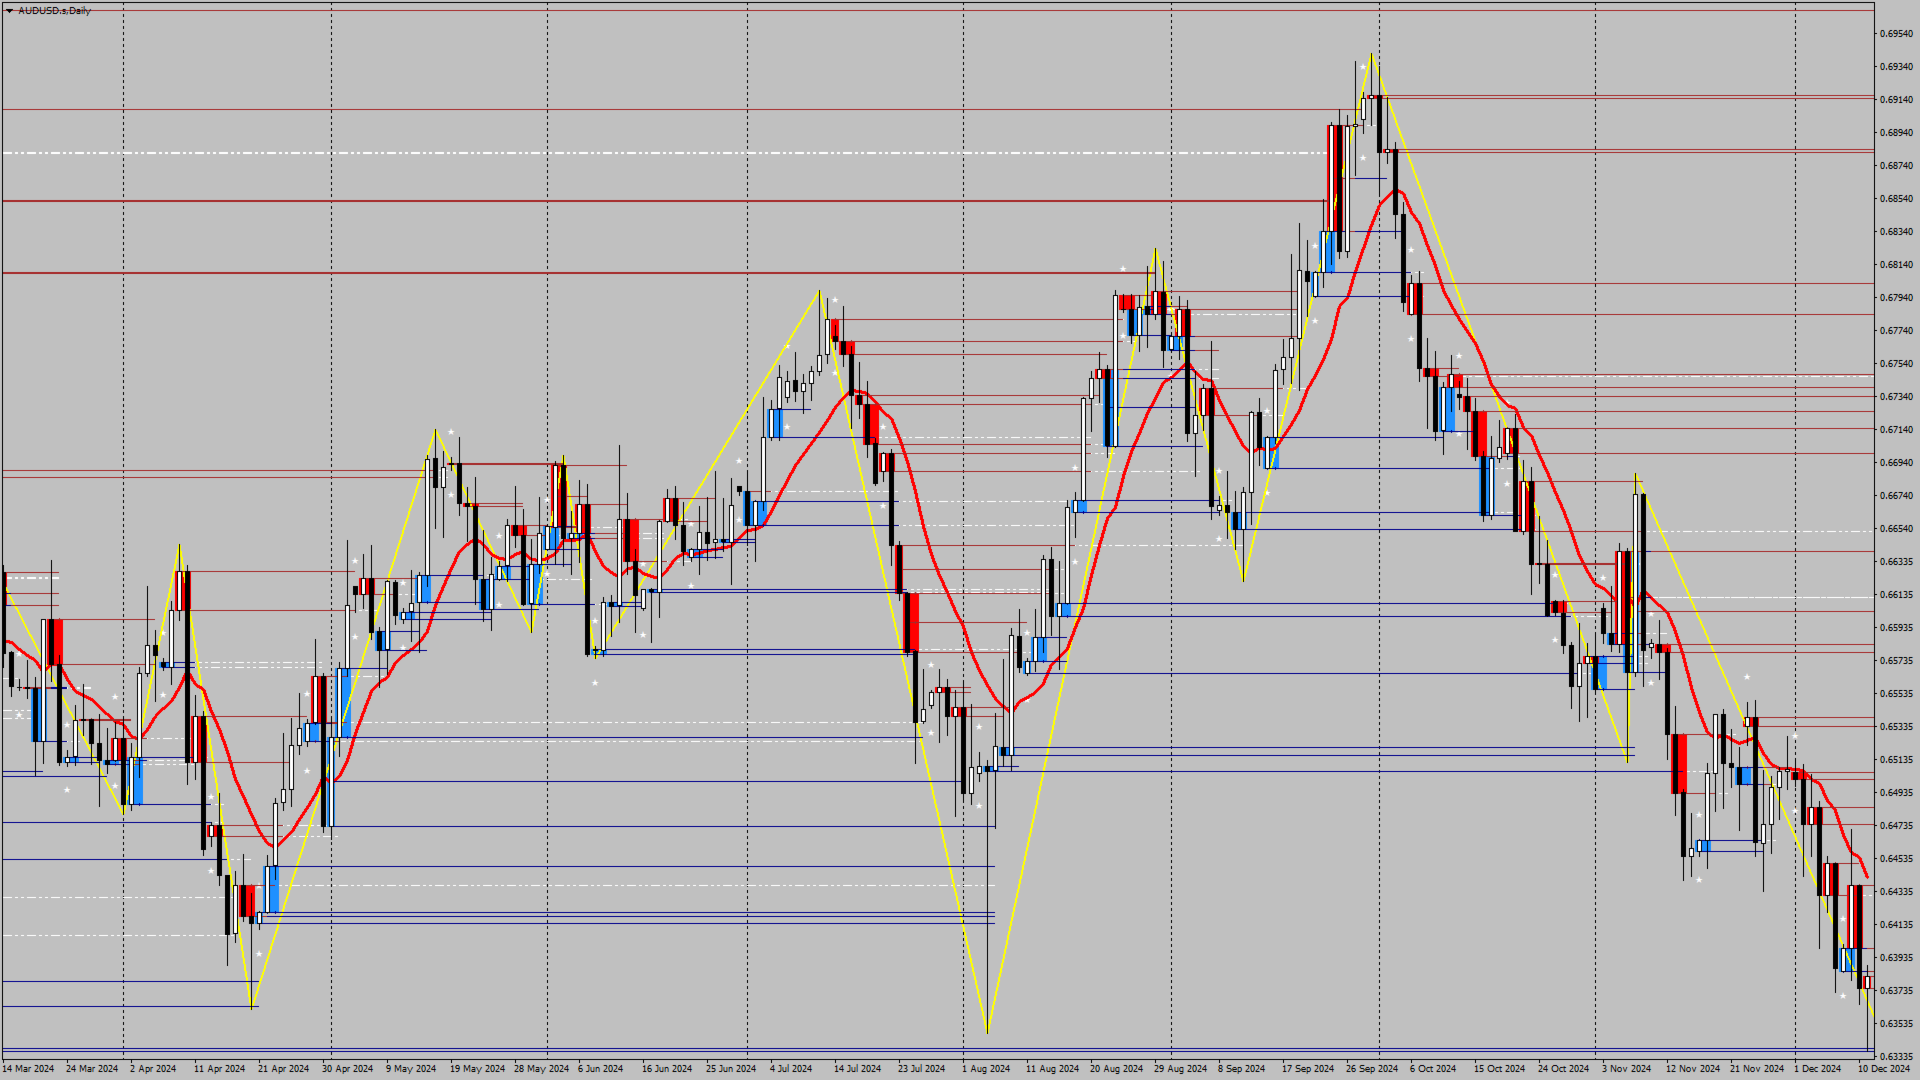
O sistema busca automaticamente áreas de oferta e demanda na linha K e desenha linhas de preços-chave em tempo real. Os comerciantes podem negociar com base nas linhas de negociação de preços.
Principais Características
O sistema busca automaticamente as áreas de oferta e demanda na linha K. O sistema também desenhará linhas de preços-chave em tempo real, e os traders poderão negociar com base nas linhas de negociação de preços. Portanto, os traders que usam a estratégia de zona de oferta e demanda não precisam mais perder tempo procurando sinais de áreas de oferta e demanda. Em vez disso, eles podem se concentrar na reação do preço às áreas de oferta e demanda e aos preços-chave e desenvolver uma estratégia de negociação que seja adequada a eles.
No entanto, a estratégia de Zona de Oferta e Demanda em si é uma estratégia mais eficaz durante períodos de volatilidade, portanto, quando o mercado mostra uma tendência forte, ela deve ser usada com cautela, ou as sugestões fornecidas pelo indicador devem ser usadas na direção da tendência.
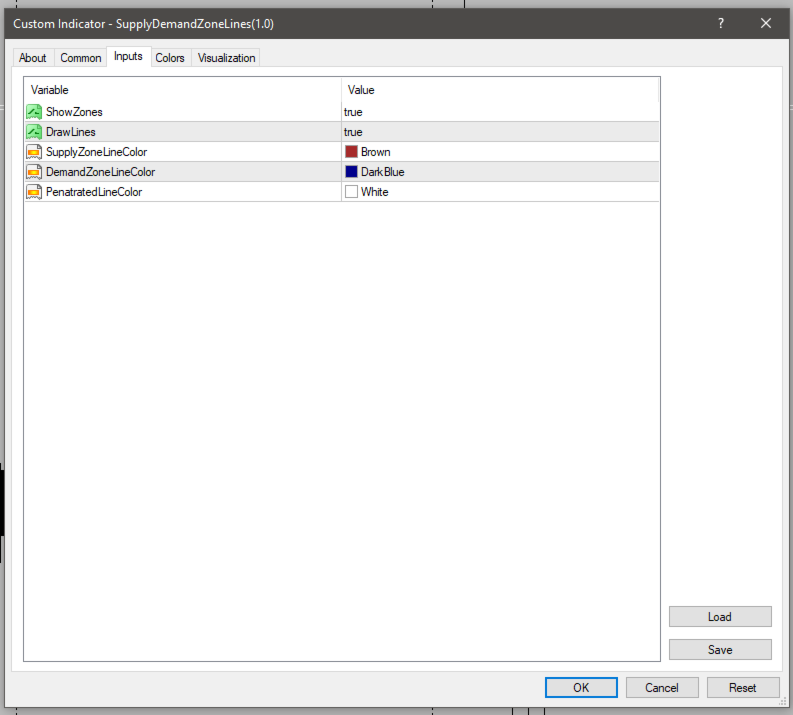
escopo
ShowZones: Se deseja exibir as zonas de oferta e demanda
DrawLines: se os preços principais devem ser exibidos
SupplyZoneLineColor: cor da linha de preço da zona de fornecimento
DemandZoneLineColor: cor da linha de preço da zona de demanda
PenatratedLineColor: A cor da linha de preço que foi penetrada

implementar
Basta anexar o indicador ao seu gráfico.
Por favor, dê-me seu feedback valioso para que eu possa melhorar os indicadores.
Se você tiver alguma dúvida, entre em contato com o WeChat: imlizard
Produtos recomendados
El indicador "MR BEAST ALERTAS DE LIQUIDEZ" es una herramienta avanzada diseñada para proporcionar señales y alertas sobre la liquidez del mercado basándose en una serie de indicadores técnicos y análisis de tendencias. Ideal para traders que buscan oportunidades de trading en función de la dinámica de precios y los niveles de volatilidad, este indicador ofrece una visualización clara y detallada en la ventana del gráfico de MetaTrader. Características Principales: Canal ATR Adaptativo: Calcula
Blahtech Market Profile
Blahtech Limited
4.53 (15)
Was: $249  Now: $99   Market Profile defines a number of day types that can help the trader to determine market behaviour. A key feature is the Value Area, representing the range of price action where 70% of trading took place. Understanding the Value Area can give traders valuable insight into market direction and establish the higher odds trade. It is an excellent addition to any system you may be using. Blahtech Limited presents their Market Profile indicator for the MetaTrader community. Ins
Gioteen Volatility Index (GVI)   - your ultimate solution to overcoming market unpredictability and maximizing trading opportunities. This revolutionary indicator helps you in lowering your losing trades due to choppy market movements. The GVI is designed to measure market volatility, providing you with valuable insights to identify the most favorable trading prospects. Its intuitive interface consists of a dynamic red line representing the volatility index, accompanied by blue line that indicat
Gold Titan King Scalper
Dodong Christian Arnon
Indicator Description GOLD TITAN KING SIGNAL INDICATOR High-Precision Gold Scalping Buy/Sell Signals – Manual Trading Assistant Overview The Gold Titan King Signal Indicator is a manual trading assistant tool designed for high-frequency scalping on Gold (XAUUSD) and other major pairs. It generates clear BUY/SELL signals with precise entry levels, along with adjustable Stop Loss and Take Profit levels displayed directly on the chart. ️ This tool is NOT an EA. It does not execute trades
BoxChart MT4
Evgeny Shevtsov
4.4 (5)
The market is unfair if only because 10% of participants manage 90% of funds. An ordinary trader has slim changes to stand against these "vultures". This problem can be solved. You just need to be among these 10%, learn to predict their intentions and move with them. Volume is the only preemptive factor that faultlessly works on any timeframe and symbol. First, the volume appears and is accumulated, and only then the price moves. The price moves from one volume to another. Areas of volume accumu
AW Candle Patterns MT4
AW Trading Software Limited
O indicador AW Candle Patterns é uma combinação de um indicador de tendência avançado combinado com um poderoso scanner de padrão de vela. É uma ferramenta útil para reconhecer e destacar os trinta padrões de velas mais confiáveis. Além disso, é um analisador de tendências atual baseado em barras coloridas com       plug-in painel de tendência multi-timeframe que pode ser redimensionado e posicionado. Uma capacidade única de ajustar a exibição de padrões dependendo da filtragem de tendências. Va
O indicador cria cotações atuais, que podem ser comparadas com as históricas e, com base nisso, fazer uma previsão do movimento dos preços. O indicador possui um campo de texto para navegação rápida até a data desejada. Opções: Símbolo - seleção do símbolo que o indicador exibirá; SymbolPeriod - seleção do período do qual o indicador coletará dados; IndicatorColor - cor do indicador; HorisontalShift - deslocamento das cotações desenhadas pelo indicador pelo número especificado de barras; I
O indicador SMC Venom Model BPR é uma ferramenta profissional para os traders que trabalham com o conceito Smart Money (SMC). Identifica automaticamente dois padrões principais no gráfico de preços: FVG   (Fair Value Gap) é uma combinação de três velas, em que existe um gap entre a primeira e a terceira velas. Forma uma zona entre níveis onde não há suporte de volume, o que geralmente leva a uma correção de preço. BPR   (Balanced Price Range) é uma combinação de dois padrões FVG que formam uma “
PipFinite Exit EDGE
Karlo Wilson Vendiola
4.83 (115)
Did You Have A Profitable Trade But Suddenly Reversed? In a solid strategy, exiting a trade is equally important as entering. Exit EDGE helps maximize your current trade profit and avoid turning winning trades to losers. Never Miss An Exit Signal Again Monitor all pairs and timeframes in just 1 chart www.mql5.com/en/blogs/post/726558 How To Trade You can close your open trades as soon as you receive a signal Close your Buy orders if you receive an Exit Buy Signal. Close your Sell orders if
Cosmic Diviner X Planet
Olena Kondratenko
4 (2)
This unique multi-currency strategy simultaneously determines the strength of trends and market entry points, visualizing this using histograms on the chart. The indicator is optimally adapted for trading on the timeframes М5, М15, М30, Н1. For the convenience of users, the indicator renders the entry point (in the form of an arrow), recommended take profit levels (TP1, TP2 with text labels) and the recommended Stop Loss level. The take profit levels (TP1, TP2) are automatically calculated for
Infinity Trend Pro
Yaroslav Varankin
1 (1)
This is a trend indicator without redrawing Developed instead of the binary options strategy (by the color of the Martingale candlestick) Also works well in forex trading When to open trades (binary options) A signal will appear in the place with a candle signaling the current candle It is recommended to open a deal for one candle of the current timeframe M1 and M5 When a blue dot appears, open a deal up When a red dot appears, open a trade down. How to open trades on Forex. When a signal is rec
Indicador de gestão de risco e monitoramento de limites para traders profissionais e contas de avaliação (Prop) Esta ferramenta apenas exibe, no gráfico, informações precisas de gestão de risco e limites, ajudando você a decidir com mais foco. O indicador não abre/fecha/modifica ordens e não interfere com Expert Advisors (EAs). Recursos Monitoramento do drawdown diário e total Calcula e exibe o drawdown diário e total com base no Saldo (Balance) ou no Patrimônio (Equity) (configurável). Mostra
PABT Pattern Indicator - it's classical system one of the signal patterns. Indicator logic - the Hi & Lo of the bar is fully within the range of the preceding bar, look to trade them as pullback in trend. In the way if indicator found PABT pattern it's drawing two lines and arrow what showing trend way.  - First line - it's entry point and drawing at: 1. On the high of signal bar or on middle of the signal bar (depending from indicator mode) for buy; 2. On the low of signal bar or on middle of t
CrossPoint4
Denis Trubachev
CrossPoint4 is an indicator that helps novice traders. In addition to the standard "Crosshair" function (Ctrl + F), CrossPoint4 will show you how to set the StopLoss and TakeProfit levels correctly, taking into account the minimum allowable level, calculate the number of points between two points and convert this into the currency of the account, taking into account the expected lot of the transaction. Sometimes, when opening a deal, a novice trader completely forgets about the spread. After
Owl smart levels
Sergey Ermolov
4.24 (37)
Versão MT5  |  FAQ O   Indicador Owl Smart Levels   é um sistema de negociação completo dentro de um indicador que inclui ferramentas populares de análise de mercado, como   fractais avançados de Bill Williams , Valable ZigZag que constrói a   estrutura de onda correta   do mercado e   níveis de Fibonacci que marcam os níveis exatos de entrada no mercado e lugares para obter lucros. Descrição detalhada da estratégia Instruções para trabalhar com o indicador Consultor de negociação Owl Helper Ch
QuantumEdge Trader
Hossam Ali Ahmed Ali
QuantumEdge Trader v1.0 AI-Powered Precision Signals for Serious Traders QuantumEdge Trader is a smart and reliable indicator that delivers accurate BUY and SELL signals using advanced market analysis and trend detection. Designed for M1 to M60 timeframes, it's ideal for scalping and intraday strategies. --- Key Features: No Repaint – Signals never change after appearing Smart trend filters to reduce noise Adjustable sensitivity and alerts Perfect for XAUUSD, EURUSD, and m
Trendiness Index
Libertas LLC
5 (3)
"The trend is your friend" is one of the best known sayings in investing, because capturing large trendy price movements can be extremely profitable. However, trading with the trend is often easier said than done, because many indicators are based on price reversals not trends. These aren't very effective at identifying trendy periods, or predicting whether trends will continue. We developed the Trendiness Index to help address this problem by indicating the strength and direction of price trend
The trading statistics indicator notifies the trader of the aggregate income of the trading account for different time intervals. The indicator has wide display settings on the graph. There is a choice of one of the two display languages on the chart- English and Russian. Settings Indicator language (ENG, RUS) - Select the language to display on the chart; To control the magic (-1: any magic) - Entering the Magic for control (-1: any Magic); Angle of indicator tie - Selecting the angle of the c
Reversal Pattern AI
Stanislav Konin
5 (1)
Reversal Pattern AI is a groundbreaking advancement in indicator development, combining artificial intelligence algorithms, multi-level market analysis, and classical technical analysis methods. It not only detects reversal patterns but also evaluates market inefficiencies, generating highly accurate trading signals.Thanks to its hybrid model, which utilizes price action analysis, volume, volatility, VWAP, and Volume AVG %, the indicator easily adapts to any market conditions. Reversal Pattern A
Forex Gump Trend is a universal indicator for highly effective determination of the trend direction. If you identify the trend correctly, this is 95% of trading success, because you will be able to open trades in the direction of the price movement and benefit from it. The Forex Gump Trend indicator helps traders with a high degree of efficiency to determine the current trend direction, as well as trend reversal points. The direction of the trend is shown by colored lines on the chart, and the
This indicator is another variant of the famous powerful indicator Fibonacci-SS https://www.mql5.com/en/market/product/10136 but has different behaviour in placing Pending Order and TP Line. Automatically places Fibonacci retracement lines from the last highest and lowest visible bars on the chart with: An auto Pending Order (Buy/Sell). Taking Profit 1, Taking Profit 2 is pivot point and Taking Profit 3 for extended reward opportunity. The best risk and reward ratio. Simple and powerful indicat
THIS IS A NEW PRODUCT RELEASE -  RENT FOR 1 MONTH FOR JUST $49.99: OFFER EXTENDS UNTIL THE END OF JANUARY 2026.   STRATEGY TESTER HAS LIMITED FUNCTIONS AND DOES NOT BEHAVE EXACTLY AS THE INDICATOR WOULD ON A DEMO. Transform Your Trading with Advanced Multi-Timeframe MACD Analysis The Continuation and Reversal Indicator is a sophisticated technical analysis tool that revolutionizes how you interpret MACD signals by analyzing multiple timeframes simultaneously. This professional-grade indicator p
Buy and sell zones
Evgeniy Zhdan
5 (2)
Indicador para determinar o plano e a tendência. Se o preço estiver abaixo de qualquer um dos dois histogramas e duas linhas (vermelha e azul), esta é uma zona de venda. Ao adquirir esta versão do indicador, versão MT4 para uma conta real e uma demo - como um presente (para receber, escreva-me uma mensagem privada)! Se o preço estiver acima de qualquer um dos dois histogramas e duas linhas (vermelha e azul), esta é uma zona de compra. Versão MT4:   https://www.mql5.com/en/market/product/3793 S
The Market Profile Indicator for MT4 displays the price levels and zones where increased trading activity happens. These zones with substantial forex trading activity provide the forex traders with the best entry levels, support, and resistance levels. Moreover, price levels indicate the best reversal zones. As a result, forex traders can identify BULLISH and BEARISH market trends and BUY and SELL entry points as well as the best reversal points. The indicator works well in all intraday timefram
The Th3Eng PipFinite indicator is based on a very excellent analysis of the right trend direction with perfect custom algorithms. It show the true direction and the best point to start trading. With StopLoss point and Three Take Profit points. Also it show the right pivot of the price and small points to order to replace the dynamic support and resistance channel, Which surrounds the price. And Finally it draws a very helpful Box on the left side on the chart includes (take profits and Stop loss
For sure, this indicator has become very popular amongst traders. Through coding this indicator will give you the most accurate levels possible for your trading analysis. We have also added in the ability for you to receive alerts when the price breaks above or below a Support or Resistance lines! HOW TO USE The red rectangles represent your resistance/supply zone. The green rectangles represent your support/demand zone.  BONUS FEATURES We coded this indicator with the ability to switch between
Forex Gump
Andrey Kozak
2.4 (5)
Forex Gump is a fully finished semi-automatic trading system. In the form of arrows, signals are displayed on the screen for opening and closing deals. All you need is to follow the instructions of the indicator. When the indicator shows a blue arrow, you need to open a buy order. When the indicator shows a red arrow, you need to open a sell order. Close orders when the indicator draws a yellow cross. In order to get the most effective result, we recommend using the timeframes H1, H4, D1. There
Stratos Pali
Michela Russo
5 (4)
Stratos Pali Indicator   is a revolutionary tool designed to enhance your trading strategy by accurately identifying market trends. This sophisticated indicator uses a unique algorithm to generate a complete histogram, which records when the trend is Long or Short. When a trend reversal occurs, an arrow appears, indicating the new direction of the trend. Important Information Revealed Leave a review and contact me via mql5 message to receive My Top 5 set files for Stratos Pali at no cost! Dow
Daily Candle Predictor é um indicador que prevê o preço de fechamento de uma vela. O indicador destina-se principalmente ao uso em gráficos D1. Este indicador é adequado tanto para negociação forex tradicional quanto para negociação de opções binárias. O indicador pode ser usado como um sistema de negociação autônomo ou pode atuar como um complemento ao seu sistema de negociação existente. Este indicador analisa a vela atual, calculando certos fatores de força dentro do próprio corpo da vela, be
VR Cub
Vladimir Pastushak
VR Cub é um indicador para obter pontos de entrada de alta qualidade. O indicador foi desenvolvido para facilitar cálculos matemáticos e simplificar a busca por pontos de entrada em uma posição. A estratégia de negociação para a qual o indicador foi escrito tem provado a sua eficácia há muitos anos. A simplicidade da estratégia de negociação é a sua grande vantagem, o que permite que até mesmo os comerciantes novatos negociem com sucesso com ela. VR Cub calcula os pontos de abertura de posição e
Os compradores deste produto também adquirem
Indicador Miraculous – Ferramenta 100% Não Repintável para Forex e Opções Binárias Baseada no Quadrado de Nove de Gann Este vídeo apresenta o Indicador Miraculous , uma ferramenta de negociação altamente precisa e poderosa, desenvolvida especificamente para traders de Forex e Opções Binárias . O que torna este indicador único é a sua base no lendário Quadrado de Nove de Gann e na Lei da Vibração de Gann , tornando-o uma das ferramentas de previsão mais precisas disponíveis na negociação moderna.
Meravith
Ivan Stefanov
5 (1)
O indicador analisa o volume de cada ponto e calcula os níveis de exaustão do mercado para esse volume. Ele consiste em três linhas: Linha de exaustão do volume altista Linha de exaustão do volume baixista Linha que indica a tendência do mercado. Esta linha muda de cor para refletir se o mercado é altista ou baixista. Você pode analisar o mercado a partir de qualquer ponto inicial que escolher. Uma vez que uma linha de exaustão de volume seja atingida, identifique um novo ponto de início para o
BinaryIndicator
Andrey Spiridonov
BinaryIndicator is a highly accurate indicator for trading binary options. It shows excellent results in scalping. This indicator is based in multifactor analysis of trend indicators, as well as confirmation oscillators, which in the end gives an increased accuracy of signals. Advantages of the indicator Increased accuracy of signals. Excellent results when trading binary options with a short expiration time from M30 to M1 . It works on any timeframes. Works with any trade symbols. Parameters
Everyone who purchases the Scalping signals M1 indicator receives a FREE BONUS — a fully automated Expert Advisor that trades based on the indicator’s signals. The indicator shows the arrows — the robot can execute the trades for you, following all signals and risk-management rules. Scalping signals M1 – a ready-made trend-following entry system for M1 Scalping signals M1 is an indicator that turns your chart into a clear action map: a colored trend channel shows the direction of the market, and
The Hurricane Indicator
Paul Nicholas Clevett
5 (1)
Currently switched to the 4 hour chart - but use other time frames for confirmation. :-)  I change my main time frame based on the market movement at the time. The Hurricane Forex Indicator is a multi time frame indicator that includes such things as Trade Notifications, Trade Calculator, Momentum Indicator, risk reward and much more. We have a free Trade room for our users as well. Please check out the video for full details of how this indicator works as it has over 15 years worth of developme
This indicator is a multifunctional technical analysis tool based on the combination of an adaptive exponential moving average and volatility filters calculated through the Average True Range (ATR). It is designed to accurately identify the current price direction, highlight key trend reversal areas, and visualize potential turning zones. The algorithm is built upon the dynamic construction of a trend ribbon using two levels of volatility — outer and inner ranges. The outer boundaries serve as i
Rtc ML Ai Predictor MT4
Muhammad Faisal Sagala
Rtc ML Ai | Predictor CORE MACHINE LEARNING ENGINE Adaptive ML Market Predictor – Multi-Bar Trend & Candle Forecast What This Indicator Does This indicator is a  real-time market prediction engine  designed to analyze price behavior and estimate  future market tendencies . Unlike conventional indicators, this system  does not rely on static parameters or historical curve-fitting , but adapts its internal state dynamically during live market operation. Instead of using static rules, the indic
FFx Engulfing Setup Alerter gives trade suggestions with Entry, Target 1, Target 2 and StopLoss. Below are the different options available: Entry suggestion - pips to be added over the break for the entry 3 different options to calculate the SL - by pips, by ATR multiplier or at the pattern High/Low 3 different options to calculate the 2 TPs - by pips, by ATR multiplier or at Risk/Reward Offset the dashboard - any place on the chart Remove the suggestion once the price reached the SL line Lines
FFx InsideBar Setup Alerter gives trade suggestions with Entry, Target 1, Target 2 and StopLoss. Below are the different options available: Entry suggestion - pips to be added over the break for the entry Minimum candle size - to avoid too close buy/sell entry suggestions 3 different options to calculate the SL - by pips, by ATR multiplier or at the pattern High/Low 3 different options to calculate the 2 TPs - by pips, by ATR multiplier or at Risk/Reward Offset the dashboard - any place on the c
FFx OutsideBar Setup Alerter gives trade suggestions with Entry, Target 1, Target 2 and StopLoss. Below are the different options available: Entry suggestion - pips to be added over the break for the entry. 3 different options to calculate the SL - by pips, by ATR multiplier or at the pattern High/Low. 3 different options to calculate the 2 TPs - by pips, by ATR multiplier or at Risk/Reward. Offset the dashboard - any place on the chart. Remove the suggestion once the price reached the SL line.
FFx PinBar Setup Alerter gives trade suggestions with Entry, Target 1, Target 2 and StopLoss. Below are the different options available: Entry suggestion - pips to be added over the break for the entry Minimum candle size - to avoid too small candles 3 different options to calculate the SL - by pips, by ATR multiplier or at the pattern High/Low 3 different options to calculate the 2 TPs - by pips, by ATR multiplier or at Risk/Reward Offset the dashboard - any place on the chart Remove the sugges
Automatic, live & interactive picture of all trendlines. Assign push, email and sound alerts to the lines of your choice and be informed about price rollback, breakout, rollback after breakout, number of rollbacks, line expiration by double breakout. Correct, drag or delete the lines and interactively tune the line system. https://youtu.be/EJUo9pYiHFA . Chart examples https: //www.mql5.com/en/users/efficientforex Price Interaction Events All events are effective immediately and only after one
The purpose of this new version of the MT4 standard indicator provided in your platform is to display in a sub-window multiple timeframes of the same indicator with its divergences. See the example shown in the picture below. But the display isn't like a simple MTF indicator. This is the real display of the indicator on its timeframe. Here's the options available in the FFx divergences indicator: Select the timeframes to be displayed (M1 to Monthly) Define the width (number of bars) for each tim
The purpose of this new version of the MT4 standard indicator provided in your platform is to display in a sub-window multiple timeframes of the same indicator with its divergences. See the example shown in the picture below. But the display isn't like a simple MTF indicator. This is the real display of the indicator on its timeframe. Here's the options available in the FFx divergences indicator: Select the timeframes to be displayed (M1 to Monthly). Define the width (number of bars) for each ti
The FFx Dashboard MTF alerter will show you on a single chart all the timeframes (M1 to Monthly) with their own status for the indicator. 2 Alert Options: Single timeframe: each selected timeframe alert separately when a signal occurs Multi timeframes: all selected timeframes must agree for an alert to be triggered Both options have an input to select the timeframes to be used for the alert(s). How to Understand the Status: Green/Red square: histogram above/below 0 line Green square + Red bord
The FFx Dashboard MTF alerter will show you on a single chart all the timeframes (M1 to Monthly) with their own status for the indicator. 2 Alert Options: Single timeframe: each selected timeframe alert separately when a signal occurs Multi timeframes: all selected timeframes must agree for an alert to be triggered Both options have an input to select the timeframes to be used for the alert(s). How to understand the status: Green/Red square: RSI above/below 50 line Green square + Red border: R
The FFx Dashboard MTF alerter will show you on a single chart all the timeframes (M1 to Monthly) with their own status for the indicator. 2 Alert Options: Single timeframe: each selected timeframe alert separately when a signal occurs Multi timeframes: all selected timeframes must agree for an alert to be triggered Both options have an input to select the timeframes to be used for the alert(s). How to understand the status: Green/Red square: Stoch above/below 50 line Green square + Red border:
The FFx Dashboard MTF alerter will show you on a single chart all the timeframes (M1 to Monthly) with their own status for the indicator. 2 Alert Options: Single timeframe: each selected timeframe alert separately when a signal occurs Multi timeframes: all selected timeframes must agree for an alert to be triggered Both options have an input to select the timeframes to be used for the alert(s). How to understand the status: Green/Red square: Price above/below Cloud (Kumo) Green square + Red bo
The FFx Dashboard MTF alerter will show you on a single chart all the timeframes (M1 to Monthly) with their own status for the indicator. 2 Alert Options: Single timeframe: each selected timeframe alert separately when a signal occurs Multi timeframes: all selected timeframes must agree for an alert to be triggered Both options have an input to select the timeframes to be used for the alert(s). How to understand the status: Green/Red square: MA pointing Up/Down Green square + Red border: MA po
The FFx Dashboard MTF alerter will show you on a single chart all the timeframes (M1 to Monthly) with their own status for the indicator. 2 Alert Options: Single timeframe: each selected timeframe alert separately when a signal occurs. Multi timeframes: all selected timeframes must agree for an alert to be triggered. Both options have an input to select the timeframes to be used for the alert(s). How to understand the status: Green square: Price above PSAR Red square: Price below PSAR Options
The FFx Dashboard MTF alerter will show you on a single chart all the timeframes (M1 to Monthly) with their own status for the indicator. 2 Alert Options: Single timeframe: each selected timeframe alert separately when a signal occurs Multi timeframes: all selected timeframes must agree for an alert to be triggered Both options have an input to select the timeframes to be used for the alert(s). How to understand the status: Green/Red square: CCI above/below levels (ie. 100/-100) Grey square: C
The FFx Dashboard MTF alerter will show you on a single chart all the timeframes (M1 to Monthly) with their own status for the indicator. 2 Alert Options: Single timeframe: each selected timeframe alert separately when a signal occurs Multi timeframes: all selected timeframes must agree for an alert to be triggered Both options have an input to select the timeframes to be used for the alert(s). How to understand the status: Green/Red square: ADX above level Grey square: ADX below level Red bor
The FFx Dashboard MTF alerter will show you on a single chart all the timeframes (M1 to Monthly) with their own status. 2 Alert Options: Single timeframe: each selected timeframe alert separately when a signal occurs Multi timeframes: all selected timeframes must agree for an alert to be triggered Both options have an input to select the timeframes to be used for the alert(s). How to understand the status: Green/Red square: bullish/bearish candle Options available in the FFx Dashboard Alerter
The [GRAFF] III manual trading system is based on multiple MetaTrader (MT4) indicators. Together, the entire PACK of GRAFF III indicators makes an advanced trading tool. The system consists of over 20 different custom-built indicators which have been carefully selected and tested in the long term to produce strong and efficient trading signals. The particular indicators are based on different mathematical formulas, so the entire system is calibrated to remove false signals from its own indicator
This indicator allows you to see the strength of the trend on all timeframes. It can be used for all currency pairs. The indicator can be displayed in the form of a column (from left to right): status buy / sell / strong buy / strong sell, strength of the trend in percentage, pips last candle, body candle now, remaining time, and the timeframe of M1 to MN. Information contained below (from left to right): total trend percent, sell percent, buy percent.
FFx Universal Strength Meter PRO is more than a basic strength meter. Instead of limiting the calculation to price, it can be based on any of the 19 integrated strength modes + 9 timeframes. With the FFx USM, you are able to define any period for any combination of timeframes. For example, you can set the dashboard for the last 10 candles for M15-H1-H4… Full flexibility! Very easy to interpret... It gives a great idea about which currency is weak and which is strong, so you can find the best pai
A simplistic indicator informing a user on RSI divergence by sending messages to mobile device and email. The indicator draws 2 vertical lines, marking two RSI extrema that formed the divergence. You get the alert, open the charts and make a decision. The indicator does not show past divergences, thus when you attach it to a chart for the first time you see nothing. Graphics and alerts will appear as soon as divergences do. Drop it in Tester to see how it works. Parameters: RSIPeriod - number of
Mais do autor
Trend Code
Ning Liu
4 (1)
Trend Code (v2.0) Trend Code is a very simple and yet effective trend indicator to capture trend movement, detect the trend reversal, calculate entry price as well as proper stop loss. Trend Code indicator is made up of a series of block, while bull trend block in bull colour and bear block in bear trend colour. For bull trend block, the TrendOpen is the lower edge, TrendClose is the upper edge, for bear trend block, the other way round. Parameters: TrendOpenAdjustment   = 0.8, (range 0~1.0) Tr
Divergence Range Divergence Range is a very simple and yet effective indicator that calculate the price divergence range from a standard moving average indicator. The indicator has two groups of line, three lines, upper1, upper2, upper3 above a standard moving average and three lines below, lower1, lower2, lower3, which shows the divergence range for the price movement from the standard moving average. The two out most line virtually covers more than 95% of the price movement from the standard m
Real Time Currency Strength We present a simple and effective indicator of currency strength, which give you the overview of the market situation. The indicator displays strength of eight major currencies and can be viewed in a single indicator window. Main features This is a real-time currency strength based on a pool of eight most liquidate major currencies. That means, for every moment of time, the strength of the currency is related to the pool of eight currency as whole at that moment. Ther
Hidden Breakout Power   The market has a cycle, keeps on moving from: RANGE -> BREAKOUT -> TREND ->CONSOLIDATION ->RANGE RANGE and TREND The two major states, while the BREAKOUT refer to the short period of market breaking the range, CONSOLIDATION refer to the long consolidation of market and shrink to range. Usually oscillatory indicator performs well in RANGE states and perform poorly in trend state, while TREND indicator is the other way around, it performs will in a TREND states and but poor
Realtime Stop Hunting Background What Is Stop Hunting? I refer to the definition of Stop Hunting from Investopedia, Stop hunting is a strategy that attempts to force some market participants out of their positions by driving the price of an asset to a level where many individuals have chosen to set stop-loss orders. The triggering of many stop losses at once typically creates high volatility and can present a unique opportunity for investors who seek to trade in this environment. Setting up the
Filtro:
Sem comentários
Responder ao comentário