 MetaTrader 5
 Experts
 Indicadores
 Bibliotecas
 Utilitários
 Widgets
 Regras
Conheça o Mercado MQL5 no YouTube, assista aos vídeos tutoriais
Como comprar um robô de negociação ou indicador?
Execute seu EA na
hospedagem virtual
hospedagem virtual
Teste indicadores/robôs de negociação antes de comprá-los
Quer ganhar dinheiro no Mercado?
Como apresentar um produto para o consumidor final?
Novos Indicadores Técnicos para MetaTrader 5 - 120
 É com base nos sinais de indicadores técnicos que se aplicam as decisões para abertura ou fechamento de uma transação nos mercados de ações e Forex. A essência dos indicadores reside na previsão de mudanças de preço, com base na conversão matemática de preço e/ou volumes de um instrumento financeiro.
Teste os indicadores técnicos para prever melhor o comportamento do mercado e lucrar com isso.
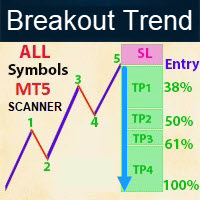
- Real price is 70$ - 50% Discount (It is 35$ now) Contact me for instruction, any questions! - Lifetime update free - Non-repaint - I just sell my products in Elif Kaya Profile, any other websites are stolen old versions, So no any new updates or support. Introduction Breakout Trend Scanner indicator works based on the Elliott Wave in technical analysis describes price movements in the financial market that are related to changes in trader sentiment and psychology and finds end of movement an
Spike Trap is a simple but powerful tool that identifies sharp market spikes and waits for price pullbacks to highlight high-probability entry and exit zones. By combining volatility detection with smart retracement logic, it helps traders capitalize on fast price moves with precision and reduced risk. Ideal for scalping or long-term trading in volatile markets. Spike Trap can be used to trade Synthetic indices such as Boom and Crash, volatility indices offered by Deriv Broker as well as Pain an

The Best SMC for All indicator is designed for MetaTrader 5 (MT5) to implement Smart Money Concepts (SMC) for analyzing market structure and identifying key trading zones based on price action. It visualizes supply and demand zones, Break of Structure (BOS) levels, Points of Interest (POI), and optional ZigZag patterns to assist traders in making informed decisions. Below is a detailed description of its features:
---
Features
1. Swing High/Low Detection:
- Functionality: Automatically iden
FREE

Preço especial de lançamento: apenas $30!
Preço regular $39 → agora disponível por $30 (tempo limitado) .
O preço voltará ao normal assim que forem recebidas as primeiras avaliações de compradores.
Gold Scalper Signal Pro — Indicador Profissional para Ouro Gold Scalper Signal Pro é um indicador profissional de alta precisão projetado exclusivamente para o Ouro (XAUUSD) e para scalping .
Fornece sinais de compra/venda em tempo real que permitem capturar o início das tendências enquanto mi
Reversal Pattern AI — an absolute breakthrough in the world of indicator development, combining artificial intelligence algorithms, multi-level market analysis, and classical methods of technical analysis. It not only detects reversal patterns but also evaluates market inefficiencies, generating highly accurate trading signals. Thanks to a hybrid model that uses price action analysis, Volumes, Volatility, VWAP, and Volume AVG %, the indicator easily adapts to any market conditions.

SmartTrend ATR – Professional Trend Indicator Overview ,don't forget to adjust the settings (inpShowLabels, true) SmartTrend ATR is an advanced trading indicator based on the SuperTrend algorithm combined with the ATR (Average True Range).
It is designed to detect trend reversals and continuations with high accuracy, providing clear BUY/SELL signals suitable for scalping, day trading, swing trading, and long-term strategies. if you don't understand how to use Technical Support via product fee
Super Trend Scalper v1.0 Overview The Super Trend Scalper is an advanced technical indicator designed specifically for scalping in the synthetic index Deriv market. It combines the power of three renowned technical indicators—SuperTrend, RSI, and MACD—to provide accurate and timely trading signals, ideal for traders looking to take advantage of short-term price movements with a high probability of success.
Technical Methodology Main Components 1. Adaptive SuperTrend
Uses the Average True Rang
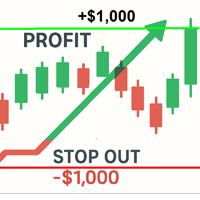
I s a professional visual radar for your trading account. The indicator calculates and displays the key mathematical levels of your open positions directly on the chart in real-time (fully accounting for commissions and swaps). No more blind spots or mental math: you will clearly see exactly where your desired profit will be reached and where the broker will forcefully close your account. Key Features Complete Margin Level Map: Automatic calculation and drawing of Margin Call, Stop Out, "Loc
FREE
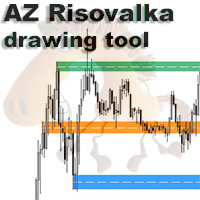
AZ Risovalka levels drawing tool An indicator for simplifying the drawing of levels. Select the indicator mode for the body, shadow, or the whole candle in the settings. Click the 'Draw' button on the drawing panel to create a level, then click on the body or shadow of the candle and select the level color in the color menu that appears. The 'Delete' button to delete level you select, 'Color' to select the color of an already created level. You can set your own colors in the indicator menu (6 co
FREE

The LBArrow-2 indicator is a sophisticated tool designed for MetaTrader 5 (MT5), delivering precise arrow-based signals derived from a linear breakout strategy. This versatile indicator empowers traders to customize their experience by selecting their preferred signal style—choose between visually appealing blocks or traditional arrows—ensuring seamless integration into your trading workflow. Additionally, you can adjust the starting period from which signals are displayed and fine-tune the line
Crash Tragos – The Ultimate Crash Indices Scalping Indicator The Crash Tragos is a powerful scalping tool designed specifically for Crash 300, 500, 600, 900, and 1000 indices . Built for traders who want precision and consistency, this indicator helps you buy safely in Crash markets while avoiding unnecessary spikes. Timeframes: M1 and M5
Scalping Focus: Buy entries only on Crash Indices
Safe Holding Power: M1: Hold trades for 60 – 120 candles while avoiding spikes M5: Capture 20 – 40 c

Squeeze Momentum Force is an advanced technical analysis indicator designed for MetaTrader 5. It combines volatility squeeze detection with momentum analysis to identify high-probability trading opportunities. Based on John Carter's original concept, this enhanced version incorporates: Multi-Timeframe (MTF) analysis. Divergence detection. Volume weighting. Modern user interface for quick market interpretation. The indicator identifies periods of low volatility (squeeze) that typically precede si
FREE

TigrisWave IQ Binary Rocket - The Ultimate Signal Generator! From the creators of the revolutionary Scalp Rocket AI comes a game-changer for Binary Options trading. This expert advisor is meticulously engineered to generate high-probability buy/sell signals, perfectly synchronized with the market trend. While originally designed for Forex, its pinpoint accuracy makes it the ultimate tool for binary options traders seeking explosive daily profits.
How It Works: Precision Meets Power The EA
Volatility 75 Trend - Specialized Technical Indicator Overview The Volatility 75 Trend is an advanced technical indicator designed specifically for trading synthetic indices, particularly the Volatility 75 (V75). This indicator combines multiple technical analysis tools to provide accurate trend signals and timely alerts in highly volatile markets.
Key Features 1. Adaptive Trend Algorithm Uses the Average True Range (ATR) as a basis for calculating dynamic support and resistance levels Impleme

### Indicator Description: Gradient Heiken Ashi with Momentum Coloring
This indicator is a technical analysis tool designed to overlay on the main chart, helping traders easily identify price trends and momentum through modified Heiken Ashi candles. It combines smoothed candle value calculations based on moving averages with a gradient color system to represent the strength of bullish or bearish trends.
#### 1. Key Features
- Display of Modified Heiken Ashi Candles:
- The indicator draws opt
FREE
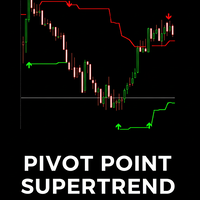
The Pivot Point Supertrend indicator is a technical analysis tool designed for the MetaTrader 5 (MT5) platform. It combines two popular analytical methods: Pivot Points: Uses significant historical price highs and lows to identify potential support and resistance zones. These points are objective and stable. Supertrend: A well-known trend-following indicator that helps identify the current market trend and provides dynamic stop-loss levels. Indicator's Goal: By using the stability of Pivot Point
FREE
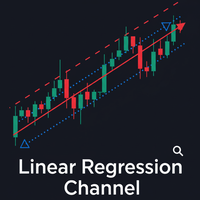
The Linear Regression Channel is a powerful technical analysis tool that helps visually identify the prevailing trend and potential price zones. Essentially, the indicator performs two main functions: It draws a trendline through the center of price action over a specified period. This line is calculated using the linear regression method, which results in the best possible "line of best fit" for the price data. From this center line, the indicator plots two parallel lines above and below, creat
FREE
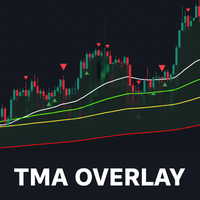
TMA Overlay Indicator for MT5 - User Guide 1. Introduction TMA Overlay is a versatile technical analysis indicator for the MetaTrader 5 platform. The indicator's goal is to provide traders with a comprehensive overview of the trend, potential entry signals, and key trading sessions, all integrated into a single chart. This is not a trading system, but a comprehensive analysis tool designed to help you make more informed decisions. 2. Core Indicator Components The indicator consists of multiple c
FREE

FXClock – Professional Clock Indicator for Traders Please leave a 5 star rating if you like this free tool! Thank you so much :) The FXClock indicator is a practical and simple tool that displays time directly on your trading platform, allowing you to track multiple key pieces of information at the same time. It is specially designed to help traders synchronize their trading with market hours and global sessions. Key Features: Displays the broker server time with precision. Displays your local c
FREE

The Advanced Support and Resistance Indicator for MetaTrader 5 leverages sophisticated pivot point detection algorithms to autonomously identify and visualize critical price levels on the chart. Utilizing a configurable pivot period (default: 20 bars) and data source (High/Low or Open/Close), it intelligently scans historical price action within a user-defined loopback window (default: 290 bars) to pinpoint pivot highs and lows with strict validation criteria for enhanced precision. Pivots are d
FREE
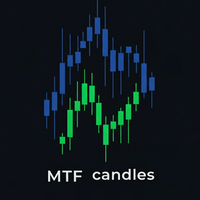
The MTF (Multi-Timeframe) Candles indicator is a powerful tool that allows you to display candles from a higher timeframe (e.g., H1, H4, D1) directly on a lower timeframe chart (e.g., M5, M15, M30). The Problem It Solves: Instead of constantly switching back and forth between charts to analyze the main trend and detailed price action, this indicator merges both perspectives into one. You can instantly see the "big picture" while staying focused on trading signals on your current timeframe. Core
FREE
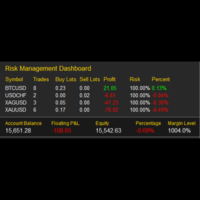
My Risk Management The Risk Management Dashboard is a visual tool designed to help traders monitor risk exposure in real time. With a clear and compact layout, it provides an instant overview of trading activity, enabling more disciplined and informed decision-making. Key Features Active Symbol Summary
Displays all traded symbols with the number of trades, total buy/sell lots, and current profit/loss. Per-Symbol Risk Analysis
Calculates and shows the risk percentage of each symbol relative to
FREE

The Supertrend indicator is a trend-following technical analysis tool designed to help traders identify the direction of market trends and potential entry/exit points. It operates based on price data and Average True Range (ATR) to create a dynamic signal line that changes color depending on the current trend. Green color: Indicates an uptrend. Red color: Indicates a downtrend. Supertrend is a useful indicator for both short-term and long-term trading, helping to filter out market noise and focu
FREE

EMA Multi Timeframe (MTF) – MT5 Indicator Description: The EMA Multi Timeframe (MTF) indicator for MT5 allows you to display an Exponential Moving Average (EMA) from a higher (or lower) timeframe directly on your current chart. Example: You can see the Daily (D1) EMA 9 plotted directly on your H1 chart, or even on an M5 chart, helping you align your entries with higher timeframe trends without switching between charts. Key Features: Display EMA from selectable timeframes (M1, M5, M15, M30, H1
FREE
Guia de Configuração — Currency Strength Money PRO Cada parâmetro abaixo está explicado de forma direta para configurar o indicador. Parâmetro Valor padrão Descrição
Moedas alvo separadas por vírgula USD,EUR,GBP,JPY,CHF, AUD,NZD,CAD,XAU … Lista de moedas analisadas. Separe por vírgula. Pode incluir/retirar moedas conforme o seu uso. Janela (horas) para variação percentual 12 Janela de tempo para medir a variação percentual de preço usada no cálculo de força.
Atualização (segundos) 1 Intervalo

Lot Size Calculator - Smart Risk Management Tool
The Lot Size Calculator is a simple but powerful MetaTrader indicator that helps traders manage risk with precision. Instead of guessing your position size, this tool instantly calculates the exact lot size you need based on your account equity, chosen risk percentage, and reward ratio (1:1, 1:2, etc.).
Features:
Input your account equity and risk % per trade Supports both long (buy) and short (sell) trades Automatically adjusts for diffe

Welcome to Ultimate MA MTF , a multi-functional Moving Average (MA) indicator converted from the original TradingView version by ChrisMoody and upgraded with many powerful features. This is not just a typical MA line. It is a comprehensive technical analysis tool designed to provide traders with deep insights into trends, volatility, and potential trading signals, all within a single indicator. Key Features 8 Moving Average Types: Full support for the most popular MA types (SMA, EMA, WMA, HullMA
FREE
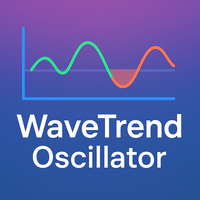
The WaveTrend Oscillator indicator is an enhanced version of the classic WaveTrend Oscillator, a momentum indicator. It is designed to identify overbought/oversold conditions and provide potential trend reversal signals. The core difference in this version is the application of a data "normalization" algorithm. This ensures the indicator's oscillation lines remain balanced around the zero line, causing the indicator window to always stay naturally centered. This is especially useful when trading
FREE
1. Introduction The Market Squeeze Momentum Indicator (SQZMOM_LB) is a powerful technical analysis tool designed to help traders identify periods of low market volatility (the "squeeze" phase) and predict the direction and strength of price momentum after the squeeze ends. This indicator combines the principles of Bollinger Bands and Keltner Channels to detect changes in market volatility, along with a momentum oscillator to measure buying/selling pressure. 2. Key Components of the Indicator The
FREE

1. Introduction Smart Volume S/R Pro is a powerful technical analysis tool designed for the MetaTrader 5 platform. Unlike traditional Support & Resistance (S/R) indicators that rely on price peaks and troughs, this indicator automatically identifies critical S/R zones based on a core factor: Trading Volume . Core Principle: Price levels that witnessed exceptionally high trading volume in the past will often become significant psychological zones, where the price is likely to react strongly (eith
FREE

Pivot eXtreme Pivot adalah level referensi penting yang digunakan trader untuk memetakan potensi support & resistance intraday maupun jangka lebih panjang.
Dalam sistem ini, level pivot dikembangkan menjadi P (Pivot Point utama) , R1–R13 (Resistance) , serta S1–S13 (Support) . Pivot Point (P) Titik pusat utama, dihitung dari rata-rata harga (High + Low + Close) / 3 . Berfungsi sebagai acuan keseimbangan harga : Jika harga di atas P → tren cenderung bullish. Jika harga di bawah P → tren cenderung
FREE
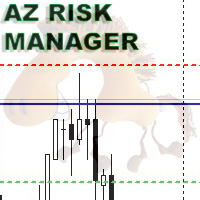
A simple indicator for calculating risk and automatically calculating the take profit line. In the settings, you enter the desired risk to profit ratio, the indicator will automatically calculate the volume for entry and show where to set the take-profit line to maintain the proportion. The risk is calculated based on your balance data. The information panel can be moved around the screen. The stop-loss line can also be moved, this will recalculate the entry volume and the take-profit position.
FREE
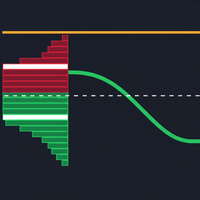
The "Volume Range Profile with Fair Value" (VRPFV) indicator is a powerful volume analysis tool designed to help traders better understand market structure and identify key price areas where significant institutional activity occurs. Instead of just looking at volume on individual candlesticks, VRPFV analyzes the distribution of volume by price level within a specific time range, providing deep insights into the "footprint" of smart money. VRPFV consists of the following core components: Upper &
FREE

MurreyGannQuantum - Professional Trading Indicator Advanced Murrey Math & Gann Angle Technical Analysis with Complete EA Integration Professional technical indicator combining Murrey Math level analysis with Gann angle calculations. Features comprehensive visual analysis, multi-timeframe adaptation, and complete EA integration capabilities for automated trading systems.
The Non-Repainting Guarantee: Why It Matters What Does Non-Repainting Really Mean? A non-repainting indicator maintains its h
Boom Tragos – The Ultimate Boom Indices Scalping Indicator The Boom Tragos is a powerful scalping tool designed specifically for Boom 300, 500, 600, 900, and 1000 indices . Built for traders who want precision and consistency, this indicator helps you sell safely in Boom markets while avoiding unnecessary spikes. Timeframes: M1 and M5
Scalping Focus: Sell entries only on Boom Indices
Safe Holding Power: M1: Hold trades for 60 – 120 candles while avoiding spikes M5: Capture 20 – 40 candl

The most comprehensive Volume Profile Trading System in MQL
Finally, Trade Where The Smart Money Trades Stop guessing. Start seeing EXACTLY where banks and institutions are positioning their trades - and ride the wave with them. What Makes Millionaire Traders Different? They don't look at the same charts you do. They see where the money actually flows. FlowZone Pro reveals the hidden order flow that moves markets - the same data that costs hedge funds $3,000+/month on Bloomberg terminals
The Vix_Fix indicator, or "Vix Fix," is a tool designed to identify potential market bottoms. It operates on the principle of measuring extreme fear or pessimism among the crowd, which are moments when the market often has a high probability of reversing to the upside. Main Purpose: To help traders find high-probability BUY (Long) entry points by identifying when the market is "oversold." How it Works In simple terms, the Vix Fix measures the distance between the current bar's Low and the Highes
FREE
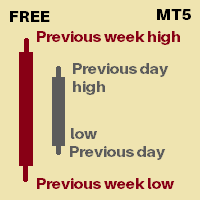
Its an indicator that will show you
Previous day high Previous day low Previous week high Previous week low You can set how many days of history you would like to see for previous day high low and previous week high low Currently 30 days of PDH/L will be marked 4 weeks of PWH/L will be marked You can change it from indicator settings. Dates are shown at marking lines to identify which date does that marking belongs to.
Thank you :) Always open to feedback and criticism if it helps me provide yo

Account and Trading Dashboard Indicator
The **Account and Trading Dashboard** is a custom MetaTrader 5 (MT5) indicator designed to provide traders with a comprehensive, real-time overview of their account metrics, trading statistics, and technical indicators directly on the chart. It displays essential financial and performance data in a draggable, minimizable, and closable panel, enhancing usability without cluttering the workspace. The indicator supports optional features like ADX and RSI for
FREE
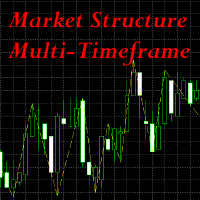
This indicator is extremely useful for traders who want to keep an eye on the market structure without wasting time drawing it manually. It also adds an important optional feature, which is MTF (Multi-Timeframe) analysis . Multi-Timeframe (MTF) analysis is a trading technique that consists of analysing the same financial instrument on different time intervals (charts) simultaneously, in order to gain a more complete view of the market. Starting with the analysis of higher timeframe charts to i
FREE

Dynamic Range Pro – Indicator Dynamic Range Pro is a technical indicator designed to visualize key market zones by plotting a dynamic channel based on price extremes. Main Features: Dynamic channel calculated using the highest highs and lowest lows over a specified period. Midline representing price equilibrium. Compatible with multiple instruments and timeframes. Inputs: PeriodPR: Sets the number of bars used for channel calculation. Functionalities: Highlights potential breakouts when price mo
FREE
This indicator is a trading strategy designed to find high-probability entry points by combining two very popular indicators: Bollinger Bands (BB) and the Relative Strength Index (RSI) . The core idea is "dual confirmation" : a trade signal is only considered valid when both indicators agree. This helps filter out many of the false signals that occur when using just a single indicator, thereby increasing the reliability of each entry. Bollinger Bands are used to identify relative price value zon
FREE
Overview
MAM Forecast is an indicator designed to replace guesswork with probabilities. It generates two adaptive levels—UP and DN—along with probabilities that always sum to 100%, giving you a clear idea of which level price is more likely to reach within the chosen horizon. Key Features Displays UP (upper) and DN (lower) adaptive levels calibrated to market volatility. Shows touch probabilities (e.g., 62% vs 38%) for likelihood within the defined horizon. Clean, informative HUD indicates sym
FREE

Idea The idea is — it seems to me that exactly at 10:00 EURUSD always goes up. How can this be verified? This indicator analyzes historical data at the same hour of the day over the past N days and shows: ProbUp — the probability that after a given number of bars ( HorizonBars ) the price will be higher; ZEdge — the “strength” of the signal = average move / dispersion. This allows you to understand: “In 70% of cases, after 3 bars during this hour the market moved up.” “The signal is
FREE

Line Master – Trend Lines & Direction Arrows Line Master is a professional trend indicator for MetaTrader 5. It helps traders identify market direction by combining fast and slow trend lines and generating arrows at trend change points. Features: Slow Trend Line: Represents the overall market trend. Fast Trend Line: Responds quickly to short-term price changes. Color-Coded Lines: Uptrend: DodgerBlue Downtrend: Crimson Trend Arrows: Signals appear when the trend changes. Adjustable Inputs: Fast l
FREE
• Please test the product in the Strategy Tester before purchasing to understand how it works.
• If you face any issues, contact me via private message—I’m always available to help.
• After purchase, send me a screenshot of your order to receive a FREE EA as a gift. Fractal Momentum Analyzer: Decode the Market's Hidden Structure Unlock a new dimension of market analysis with the Fractal Momentum Analyzer. While traditional indicators measure price and volume, this powerful tool goes deeper,
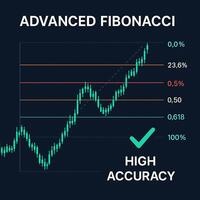
Fibonacci Advanced Indicator – Precision Meets Intelligence The Fibonacci Advanced Indicator is a cutting-edge technical analysis tool designed for traders who demand more than conventional retracement levels. Built on the foundational principles of Fibonacci mathematics, this indicator transcends tradition by integrating dynamic market behavior , multi-timeframe analysis , and adaptive algorithms to deliver high-probability trading zones with surgical accuracy.
1. Multiple Fibonacci Levels

The Next Evolution in Fibonacci Intelligence FiboChampion isn’t just another Fibonacci tool—it’s a paradigm shift in how traders interpret price action. Engineered for precision and adaptability, this advanced indicator fuses quantum-inspired logic , machine-learned pattern recognition , and non-linear Fibonacci geometry to uncover market turning points with uncanny accuracy. What Sets FiboChampion Apart: Non-Linear Fibonacci Mapping : Goes beyond static retracements by adapting to fractal m

Fibonacci Xcel – The Fibonacci Indicator That Thinks Ahead. It fuses advanced Fibonacci analytics , real‑time sentiment tracking , and a proprietary Market Quantum State Engine to give traders a crystal‑clear view of what’s happening now — and what’s likely to happen next. Core Capabilities Dynamic Fibonacci Mapping – Automatically adapts retracements, extensions, and projections to evolving price structures. Sentiment Fusion Layer – Integrates live market sentiment data to validate or ch

Market state detector: Super Trend, Transition, Chaos, Consolidation, Breakout (from consolidation squeeze)
Plots a color-coded histogram in a separate window where value = state code and color = state category.
State codes (ENUM_MARKET_STATE): 0 MARKET_QUANTUM_SUPER_TREND 1 MARKET_QUANTUM_TRANSITION 2 MARKET_QUANTUM_CHAOS 3 MARKET_QUANTUM_CONSOLIDATION 4 MARKET_QUANTUM_BREAKOUT
Instant Clarity "Read the market’s mood in seconds." "From chaos to trend — spot the

Volume at Price (VAP) VAP is a right-anchored Volume Profile Heatmap for MetaTrader 5 designed for clean, fast, and stable execution on any chart. It shows where trading activity clustered, not just when—so you can read balance/imbalance, spot value migration, and plan trades with precise references: VAH, VAL, and POC . What VAP shows Heatmap Profile (tick-volume):
A compact, right-anchored histogram that scales with the chart. Value Area (~70%) in Gold Non-Value in White Soft shadow gradient

• Please test the product in the Strategy Tester before purchasing to understand how it works.
• If you face any issues, contact me via private message—I’m always available to help.
• After purchase, send me a screenshot of your order to receive a FREE EA as a gift. Visual DynamicWave Oscillator: Master Market Reversals with Precision Unlock a new level of trading clarity with the Visual DynamicWave Oscillator, an advanced technical indicator meticulously engineered to identify high-probab

• Please test the product in the Strategy Tester before purchasing to understand how it works.
• If you face any issues, contact me via private message—I’m always available to help.
• After purchase, send me a screenshot of your order to receive a FREE EA as a gift. So Easy Indicator: Your Simple Path to Clearer Market Signals Unlock a clearer view of the market with the So Easy Indicator, a powerful yet intuitive tool designed to simplify your trading decisions. For just $30, you can add

• Please test the product in the Strategy Tester before purchasing to understand how it works.
• If you face any issues, contact me via private message—I’m always available to help.
• After purchase, send me a screenshot of your order to receive a FREE EA as a gift. Unlock the Market's Rhythm with Visual Dynamic Volatility Bands Are you tired of navigating the unpredictable swings of the market with outdated tools? Do you struggle to find clear, reliable entry and exit points in today's vo
• Please test the product in the Strategy Tester before purchasing to understand how it works.
• If you face any issues, contact me via private message—I’m always available to help.
• After purchase, send me a screenshot of your order to receive a FREE EA as a gift. Dynamic Volatility Corridor: Your Ultimate Breakout and Trend Companion Unlock the power of market volatility with the Dynamic Volatility Corridor, a sophisticated indicator designed to identify high-probability breakout opportu

• Please test the product in the Strategy Tester before purchasing to understand how it works.
• If you face any issues, contact me via private message—I’m always available to help.
• After purchase, send me a screenshot of your order to receive a FREE EA as a gift. Visual Trend Direction and Force Indicator (TDF) Unlock the True Force of the Market and Trade with Unprecedented Clarity Are you tired of trend indicators that lag, produce false signals in choppy markets, and fail to distingui

• Please test the product in the Strategy Tester before purchasing to understand how it works.
• If you face any issues, contact me via private message—I’m always available to help.
• After purchase, send me a screenshot of your order to receive a FREE EA as a gift.
Dynamic Flux Oscillator Pro Unlock the Market's True Momentum and Trade with Unprecedented Clarity Are you tired of lagging indicators that generate signals long after the optimal entry point has passed? The Dynamic Flux Oscill

• Please test the product in the Strategy Tester before purchasing to understand how it works.
• If you face any issues, contact me via private message—I’m always available to help.
• After purchase, send me a screenshot of your order to receive a FREE EA as a gift.
Visual Dynamic Channel Breakout Unlock the Power of Market Volatility with Precision Breakout Signals Are you tired of noisy indicators and missed opportunities? The Visual Dynamic Channel Breakout indicator is a professional-g

• Please test the product in the Strategy Tester before purchasing to understand how it works.
• If you face any issues, contact me via private message—I’m always available to help.
• After purchase, send me a screenshot of your order to receive a FREE EA as a gift.
Dynamic Momentum Oscillator System: Trade with the Trend, Adapt to Volatility Are you tired of oscillators that give false signals in choppy markets and lag behind strong trends? The Dynamic Momentum Oscillator System is a prof

• Please test the product in the Strategy Tester before purchasing to understand how it works.
• If you face any issues, contact me via private message—I’m always available to help.
• After purchase, send me a screenshot of your order to receive a FREE EA as a gift.
Dynamic Momentum Wave: Trade with Adaptive Intelligence Unlock the market's true momentum and leave lagging, noisy indicators behind. For just $30, gain an intelligent edge. Are you tired of momentum indicators that give signal

• Please test the product in the Strategy Tester before purchasing to understand how it works.
• If you face any issues, contact me via private message—I’m always available to help.
• After purchase, send me a screenshot of your order to receive a FREE EA as a gift. Visual Momentum Wave Sync: Master Market Momentum with Unmatched Clarity Unlock the market's rhythm and trade with confidence for just $49! Are you tired of noisy indicators that clutter your charts and provide conflicting signa

• Please test the product in the Strategy Tester before purchasing to understand how it works.
• If you face any issues, contact me via private message—I’m always available to help.
• After purchase, send me a screenshot of your order to receive a FREE EA as a gift.
Visual Dynamic Envelope Crossover: Precision Signals for Modern Traders Unlock a new level of clarity in your trading with the Visual Dynamic Envelope Crossover indicator. Designed for traders who demand precision and simplicit
Features List 1:
FVG->iFVG Order Block High Transaction Line (Personal strategy) Premium Discount 50% and 61% Previous day high low Previous week high low Candle end countdown Feature List 2 : (Implemented based on feedback from community groups) trend identification Hide FVG, Order Block, Large Transaction line below 50% equilibrium. Hide all/Individual texts/features FUTURE Feature List (Will be implemented only if at least 5 people request for it.)
Asia, London, NY lq zones (Implemented) Def

• Please test the product in the Strategy Tester before purchasing to understand how it works.
• If you face any issues, contact me via private message—I’m always available to help.
• After purchase, send me a screenshot of your order to receive a FREE EA as a gift. Visual Portfolio Analyzer: Trade Your Portfolio, Not Just a Pair Unlock a new dimension of market analysis with the Visual Portfolio Analyzer, the ultimate tool for traders who think in terms of a complete portfolio. Stop making

• Please test the product in the Strategy Tester before purchasing to understand how it works.
• If you face any issues, contact me via private message—I’m always available to help.
• After purchase, send me a screenshot of your order to receive a FREE EA as a gift. Visual Momentum Wave Cross Indicator: Trade with Clarity and Confidence Are you tired of indicators that lag behind the price, giving you late signals and causing you to miss the best part of a move? The Visual Momentum Wave Cro

• Please test the product in the Strategy Tester before purchasing to understand how it works.
• If you face any issues, contact me via private message—I’m always available to help.
• After purchase, send me a screenshot of your order to receive a FREE EA as a gift. Momentum Surge Tracker: Unleash the Power of Smart Momentum Unlock a new edge in your trading with the Momentum Surge Tracker, a sophisticated indicator designed to identify and capitalize on market momentum with unparalleled pr
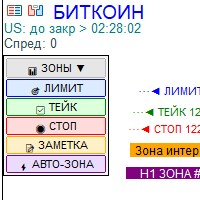
Удобная панель для разметки графика в MT5 Рисует зоны и авто-зоны с привязкой к таймфрейму Это компактная панелька, которая всегда под рукой на графике. В один клик она разворачивается, чтобы вы могли моментально наносить важные уровни, и так же легко сворачивается, чтобы не мешать обзору. ЛИМИТ — для отметки точек входа. ТЕЙК — для целей по взятию прибыли. СТОП — для уровней остановки убытков. ЗОНЫ — рисует прямоугольные области (например, важный ценовой диапазон или зону кон

Pivot_Point_Weekly — clear, uncluttered weekly pivots for MT5 Pivot_Point_Weekly plots one thing and does it exceptionally well: the classic weekly pivot (P) calculated from the previous week’s high, low, and close. It renders each week’s pivot as a clean horizontal “step,” with short, perfectly vertical joins from week to week so you can see the regime shifts at a glance—without cluttering your chart with a forest of levels. This indicator is intentionally minimalist: no S1/R1 ladders, no fib v

Astra TMA Channels Triangular Moving Average Channel Indicator with Multi-Timeframe Support Overview Astra TMA Channels is a channel-based technical analysis indicator built using Triangular Moving Average (TMA) calculations and dynamic upper/lower band structures. The indicator is designed to visualize: Trend direction Price positioning relative to dynamic bands Volatility expansion and contraction Multi-timeframe market structure The central line is calculated directly from price data to maint
Ultimate Trend Signal Moving Average Trend Analysis Indicator with Visual Signal and Alert Support Short Description Trend Signal MA20 is a moving average-based trend analysis indicator designed to display directional trend signals and alert notifications using configurable moving average calculations. Overview Trend Signal MA20 is a technical analysis indicator based on moving average slope evaluation and directional trend monitoring. The indicator displays trend direction markers directly on t
Você sabe por que o mercado MetaTrader é o melhor lugar para vender as estratégias de negociação e indicadores técnicos? Não há necessidade de propaganda ou software de proteção, muito menos problemas de pagamentos. Tudo é providenciado no mercado MetaTrader.

Você está perdendo oportunidades de negociação:
- Aplicativos de negociação gratuitos
- 8 000+ sinais para cópia
- Notícias econômicas para análise dos mercados financeiros
Registro
Login
Você concorda com a política do site e com os termos de uso
Se você não tem uma conta, por favor registre-se