Assista a como baixar robôs de negociação gratuitos
Encontre-nos em Telegram!
Participe de nossa página de fãs
Participe de nossa página de fãs
Script interessante?
Coloque um link para ele, e permita que outras pessoas também o avaliem
Coloque um link para ele, e permita que outras pessoas também o avaliem
Você gostou do script?
Avalie seu funcionamento no terminal MetaTrader 5
Avalie seu funcionamento no terminal MetaTrader 5

Expert Advisor based on the Sidus indicator. - expert para MetaTrader 4
Iurii Tokman

|
Portuguese
Русский
Veda http://ytg.com.ua resource - the author works for automation of trade on the forex market - advisers, experts will, trading robots, indicators, trading strategies, scripts, functions and libraries. Provides the ability to create programs using a programming language and mql4 mql5 for trading
- Visualizações:
- 25289
- Avaliação:
- Publicado:
-
 Você está perdendo oportunidades de negociação:
- Aplicativos de negociação gratuitos
- 8 000+ sinais para cópia
- Notícias econômicas para análise dos mercados financeiros
Registro LoginVocê concorda com a política do site e com os termos de uso
Se você não tem uma conta, por favor registre-se -
 Precisa de um robô ou indicador baseado nesse código? Solicite-o no Freelance
Ir para Freelance
Precisa de um robô ou indicador baseado nesse código? Solicite-o no Freelance
Ir para Freelance
Expert Advisor based on the Sidus indicator.
Forward:
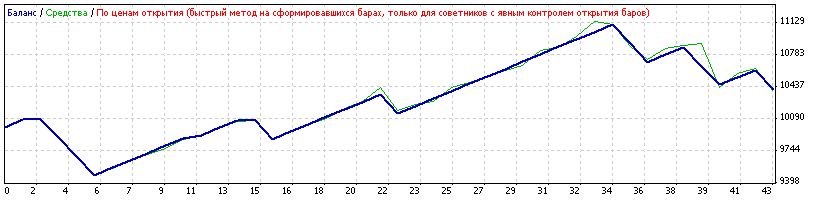
| Symbol | GBPUSD (Great Britain Pound vs US Dollar) | ||||
| Period | 1 Hour (H1) 2008.01.02 10:00 - 2009.02.15 23:59 (2008.01.01 - 2009.02.16) | ||||
| Parameters | Lots=0.1; shif=1; | ||||
| Bars in test | 7896 | Ticks modelled | 14788 | Modelling quality | n/a |
| Mismatched chart errors | 0 | ||||
| Initial deposit | 10000.00 | ||||
| Net profit | 414.37 | Gross profit | 2445.16 | Gross loss | -2030.79 |
| Profit factor | 1.20 | Expected payoff | 9.64 | ||
| Absolute drawdown | 540.03 | Maximum drawdown | 696.05 (6.26%) | Relative drawdown | 6.74% (683.82) |
| Total trades | 43 | Short positions (won %) | 25 (80.00%) | Long positions (won %) | 18 (66.67%) |
| Profit trades (% of total) | 32 (74.42%) | Loss Trades (% of total) | 11 (25.58%) | ||
| Largest | profit trade | 80.36 | loss trade | -203.30 | |
| Average | profit trade | 76.41 | loss trade | -184.62 | |
| Maximum | consecutive wins (profit in money) | 12 (960.06) | consecutive losses (loss in money) | 3 (-608.91) | |
| Maximal | consecutive profit (count of wins) | 960.06 (12) | consecutive loss (count) | -608.91 (3) | |
| Average | consecutive wins | 5 | consecutive losses | 2 | |
Optimization:
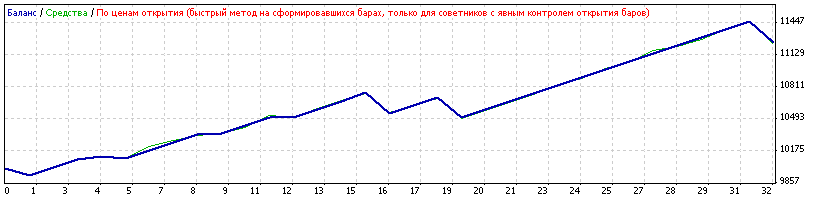
| Symbol | GBPUSD (Great Britain Pound vs US Dollar) | ||||
| Period | 1 Hour (H1) 2007.01.02 01:00 - 2007.12.28 23:59 (2007.01.01 - 2007.12.31) | ||||
| Parameters | Lots=0.1; shif=1; | ||||
| Bars in test | 7124 | Ticks modelled | 13245 | Modelling quality | n/a |
| Mismatched chart errors | 0 | ||||
| Initial deposit | 10000.00 | ||||
| Net profit | 1257.69 | Gross profit | 1960.83 | Gross loss | -703.14 |
| Profit factor | 2.79 | Expected payoff | 39.30 | ||
| Absolute drawdown | 195.21 | Maximum drawdown | 294.44 (2.73%) | Relative drawdown | 2.73% (294.44) |
| Total trades | 32 | Short positions (won %) | 12 (66.67%) | Long positions (won %) | 20 (95.00%) |
| Profit trades (% of total) | 27 (84.38%) | Loss Trades (% of total) | 5 (15.63%) | ||
| Largest | profit trade | 80.81 | loss trade | -205.10 | |
| Average | profit trade | 72.62 | loss trade | -140.63 | |
| Maximum | consecutive wins (profit in money) | 12 (958.83) | consecutive losses (loss in money) | 1 (-205.10) | |
| Maximal | consecutive profit (count of wins) | 958.83 (12) | consecutive loss (count) | -205.10 (1) | |
| Average | consecutive wins | 7 | consecutive losses | 1 | |
Traduzido do russo pela MetaQuotes Ltd.
Publicação original: https://www.mql5.com/ru/code/8715
 BW-Zone
Visualizer indicator (what a terrible phrase to use!). Colors the chart bars according to the logic of determining the state of the fourth dimension of the Chaos Theory by B. Williams - Zone.
 Tick emulation for accelerated testing of indicators ver.2
Modernization of the first version of the script with the ability to manage multiple indicators
ds_Ticks - Ticks on the price chart
Simply displays ticks on the price chart
Tick emulation for accelerated testing of indicators ver.2.2
Expansion and improvement of the script ver.2 and an example of accelerated processing of an indicator for use in conjunction with the script