Assista a como baixar robôs de negociação gratuitos
Encontre-nos em Facebook!
Participe de nossa página de fãs
Participe de nossa página de fãs
Script interessante?
Coloque um link para ele, e permita que outras pessoas também o avaliem
Coloque um link para ele, e permita que outras pessoas também o avaliem
Você gostou do script?
Avalie seu funcionamento no terminal MetaTrader 5
Avalie seu funcionamento no terminal MetaTrader 5

Three scripts for working with horizontal levels - script para MetaTrader 4

- Visualizações:
- 10665
- Avaliação:
- Publicado:
-
 Você está perdendo oportunidades de negociação:
- Aplicativos de negociação gratuitos
- 8 000+ sinais para cópia
- Notícias econômicas para análise dos mercados financeiros
Registro LoginVocê concorda com a política do site e com os termos de uso
Se você não tem uma conta, por favor registre-se -
 Precisa de um robô ou indicador baseado nesse código? Solicite-o no Freelance
Ir para Freelance
Precisa de um robô ou indicador baseado nesse código? Solicite-o no Freelance
Ir para Freelance
It is often necessary to know the distance in points between two levels of a chart. For example, in order to find out the exact current distance between today's High and Low.
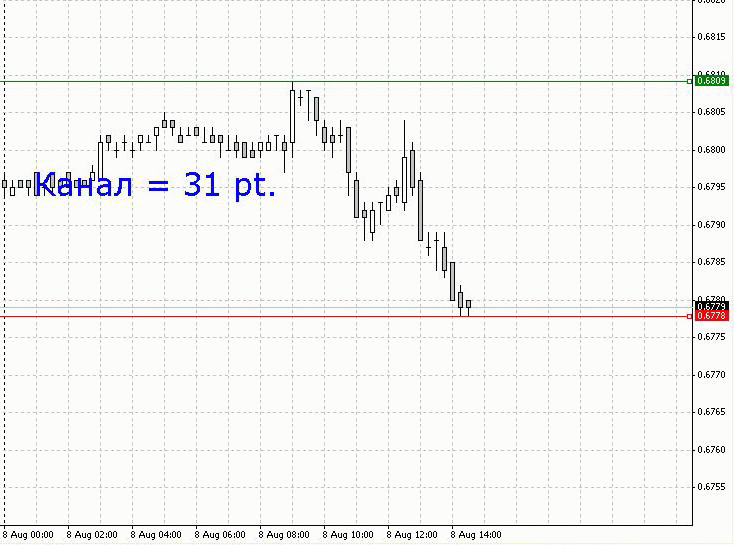
To avoid calculating it manually, the following can be done: using the Lines_Create script create 2 horizontal lines on the chart (it creates green and red lines). Move the green line up and the red line down to the required levels. Then use the Lines_RASST script, which displays a message about the number of points in the distance between the two horizontal lines. (Illustration below.). But there is a nuance.
Due to the fact that the Lines_RASST script has a delay in its code, it is necessary not to simply drop in on the chart, or simply
double-click the script, it is also necessary to make a single left mouse button click on the chart window.
Only in this case the label which tells the distance appears, and automatically disappears 5 seconds after.
If the Lines_RASST script is called and the additional click on the window was not made, then after 5 seconds the script will be unloaded from the memory,
and you will not see anything on the screen, no labels (I do not know why the terminal is done that way). Here is the result of the Lines_Create and Lines_RASST operation.
After all that the Lines_Delete can be launched, which deletes only those two lines from the chart.
Traduzido do russo pela MetaQuotes Ltd.
Publicação original: https://www.mql5.com/ru/code/7278
Daily Research
This script is designed for obtaining various statistical data on the chart candlesticks on the selected timeframe.
History_Draw
2 scripts for the analysis of trading results. Useful both for investors and traders.
