Hidden Gap by MMD MT4
- 지표
- 버전: 7.33
- 활성화: 5
Hidden Gap by MMD
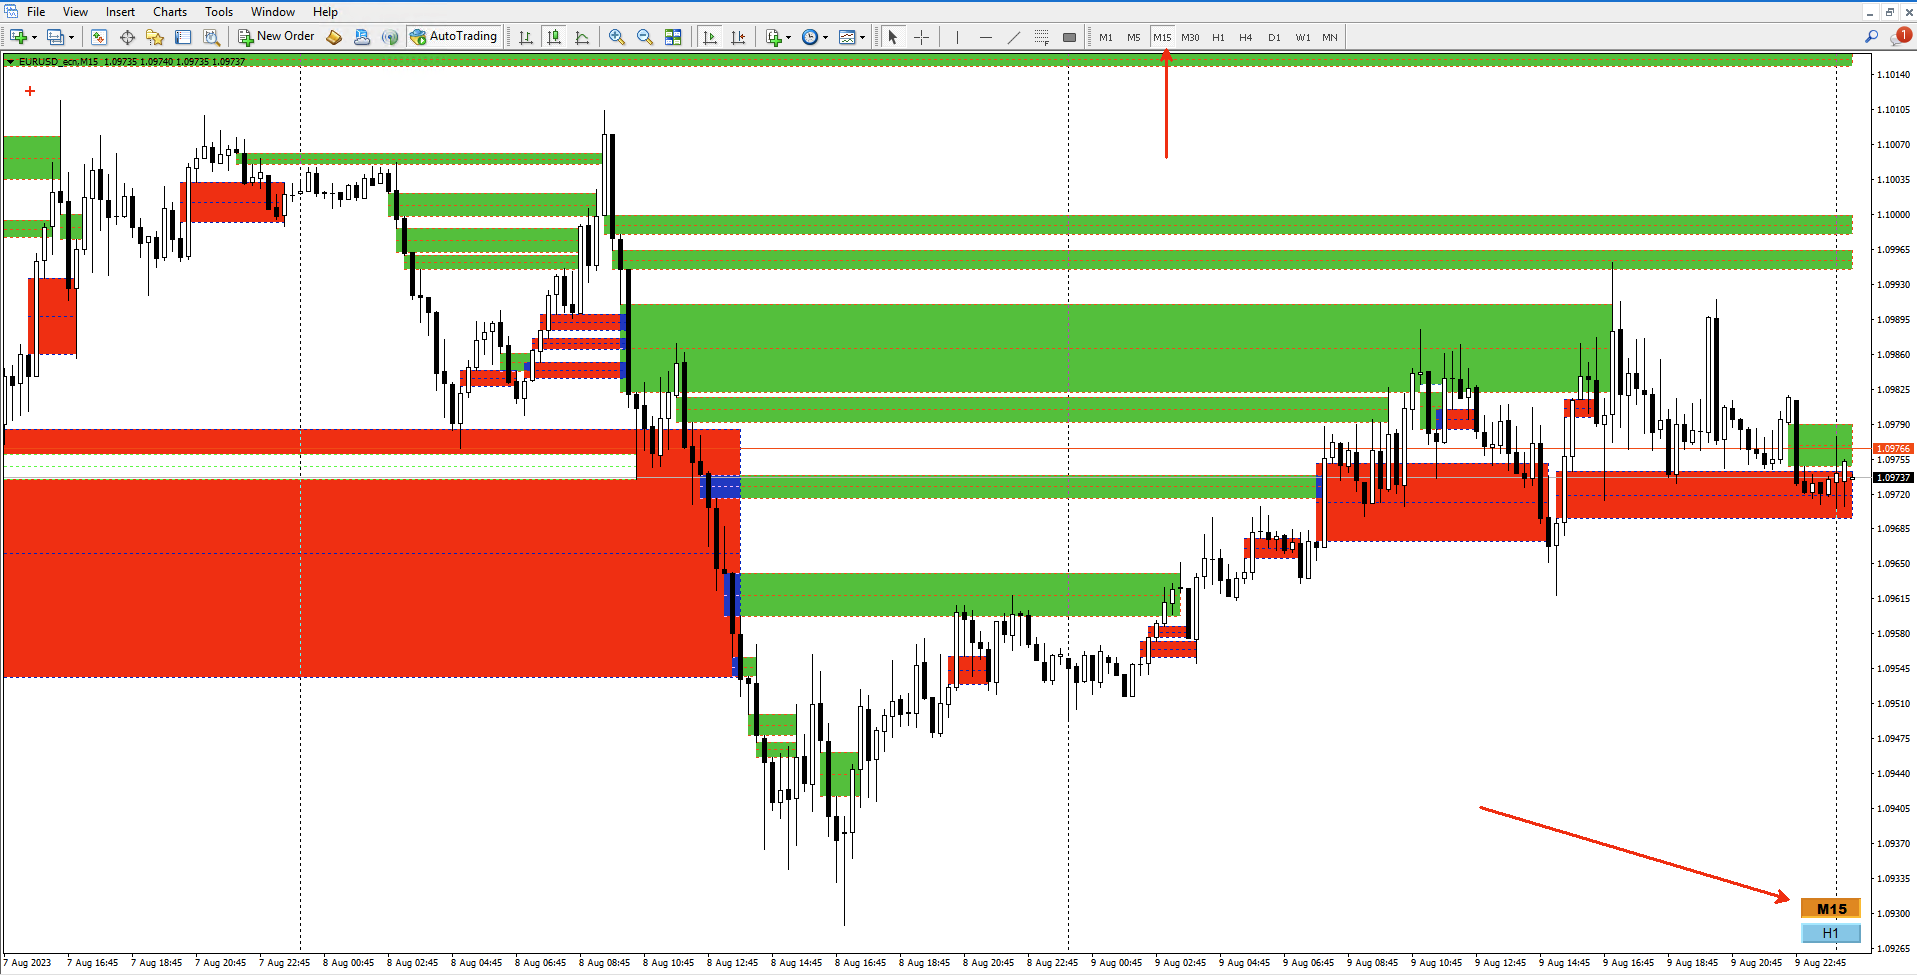
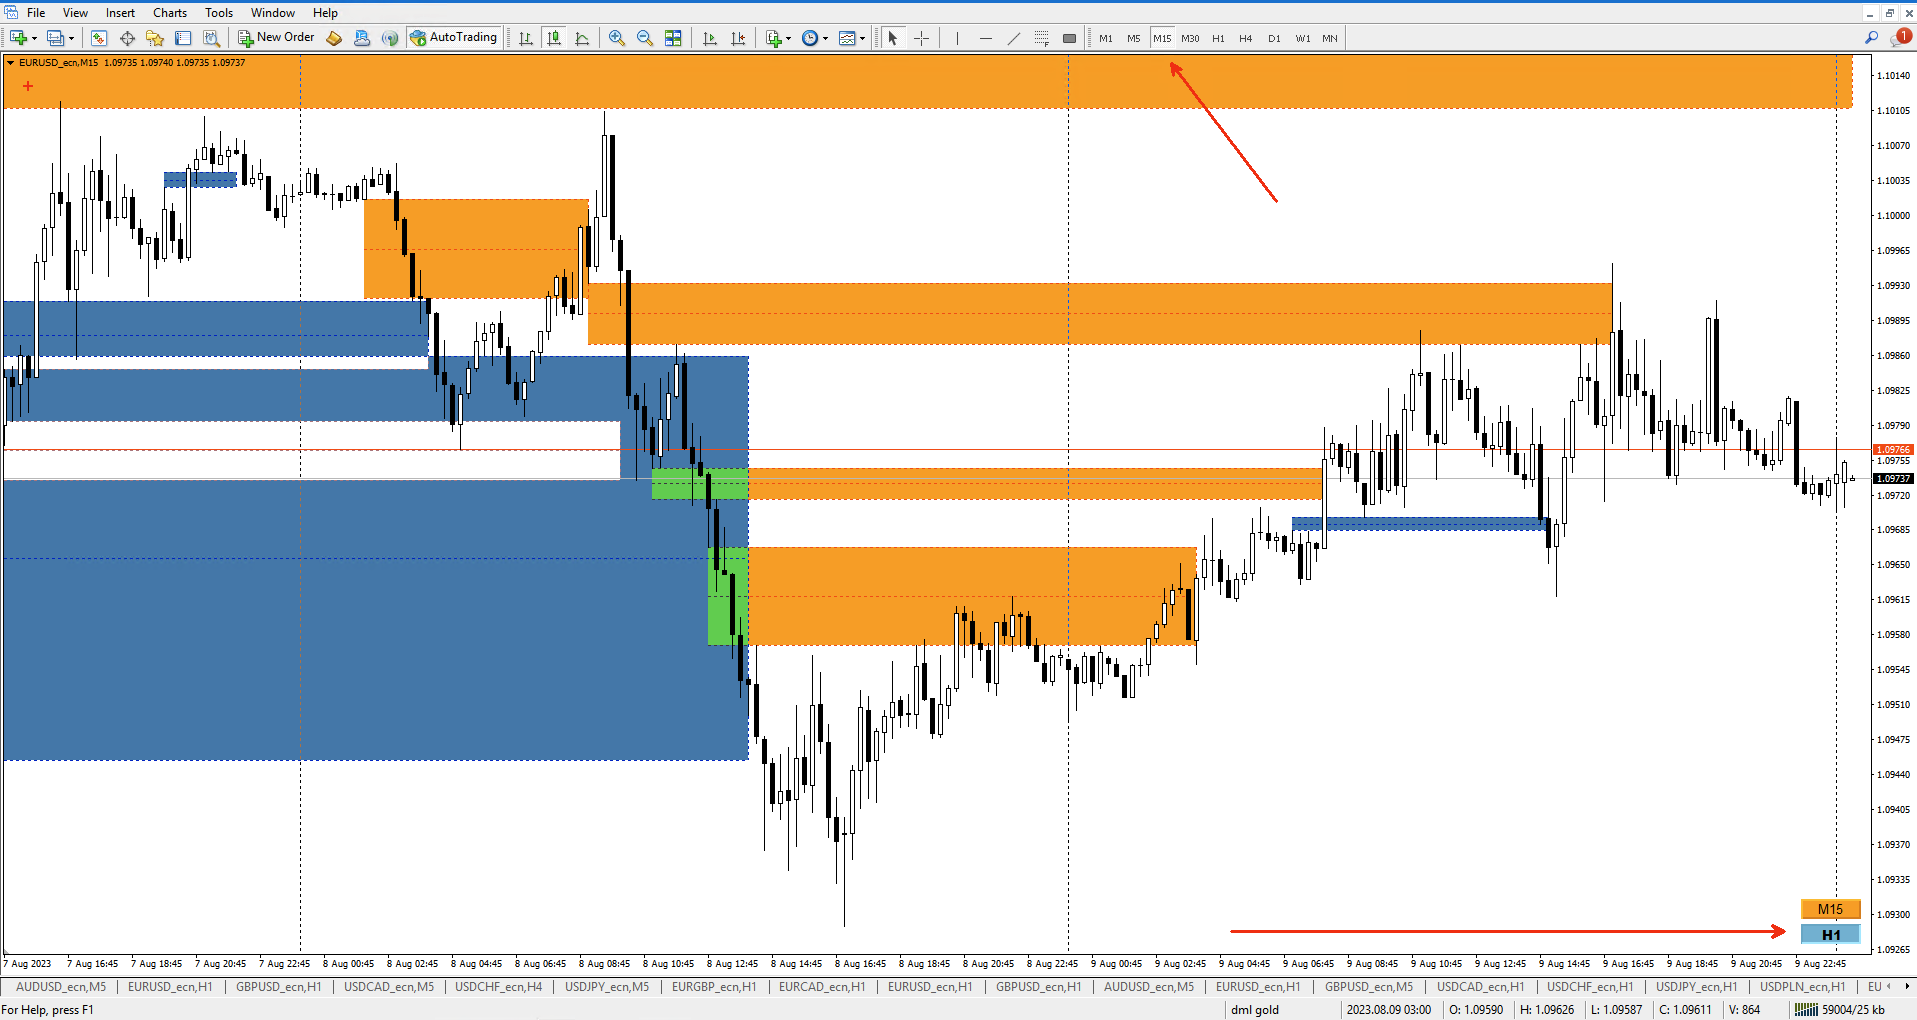
Hidden Gap by MMD is a unique indicator that detects hidden gaps between three consecutive candles. This observation isn't my own, but in the MMD methodology, it has its application alongside other original indicators. You can apply this indicator to the chart multiple times and set the interval from which you want to see the hidden gaps. You can show or hide these gaps as needed. For example, you can view the chart at an M5 interval and see hidden gaps from an M15 chart, etc. You can view hidden gaps from multiple intervals at once.
The indicator has hidden features:
- Clicking the top band of the zone displays boxes with price levels,
- Clicking the middle line of the zone extends the zone,
- Clicking the bottom band of the zone shortens the zone,
- Clicking at the end of the zone visualizes the zone's description (its creation date and time).
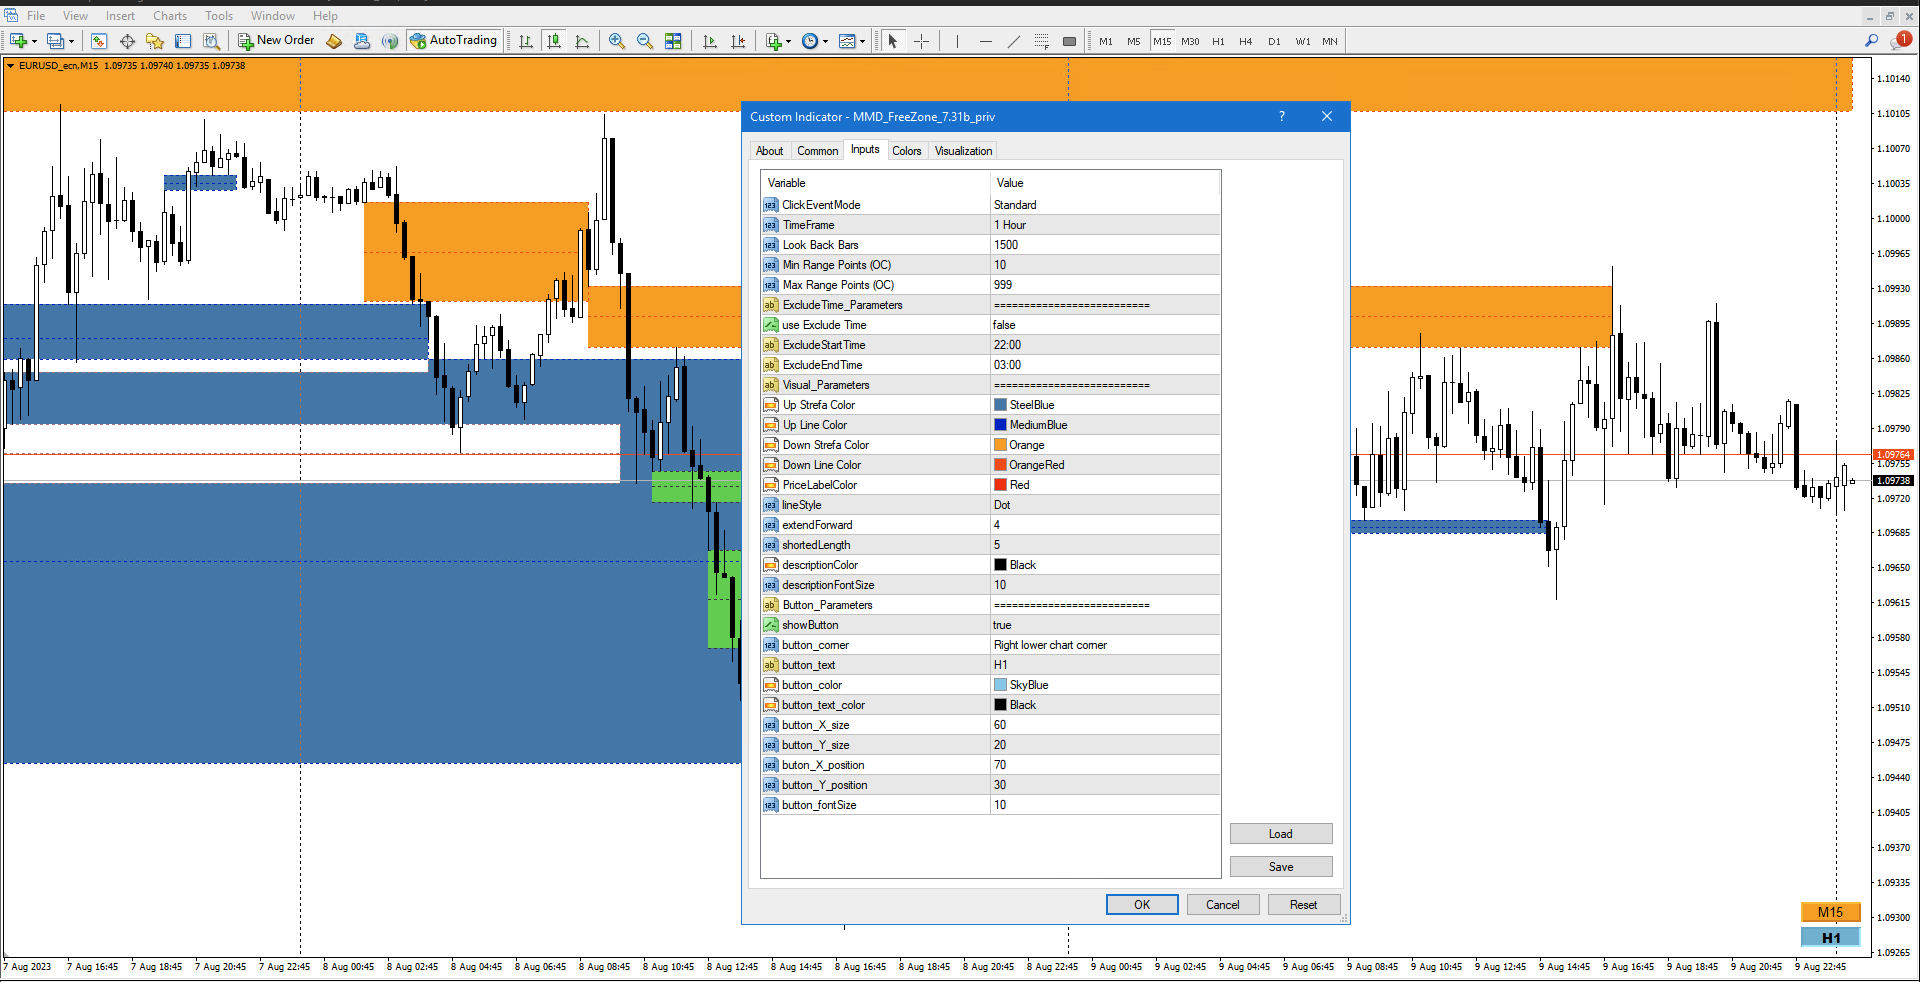
List of modifiable parameters of the indicator:
Click Event Mode - Standard/Loop - determines the way of activating the hidden functions of the indicator. The hidden functions are described above.
Time Frame - the interval from which the hidden gaps will be displayed. If you leave the default value, the hidden gaps will be displayed from the interval you are viewing the chart at.
Look Back Bars - determines the historical number of candles to be analyzed.
Min Range Points - the minimum range of the hidden gap detected by the indicator.
Max Range Points - the maximum range of the hidden gap detected by the indicator. For indices, you may need to increase this parameter value.
Use Exclude Time - true/false - decides whether to exclude a certain time period during which the indicator doesn't identify zones.
Exclude Start Time - beginning of the exclusion period.
Exclude End Time - end of the exclusion period.
Up Gap Color - color of the upward hidden gap.
Up Line Color - color of the line on an upward hidden gap.
Down Gap Color - color of the downward hidden gap.
Down Line Color - color of the line on a downward hidden gap.
Price Label Color - color for the price level description.
Line Style - Line style.
Extend Forward - parameter to extend the zone.
Shorted Length - zone length after shortening.
Description Color - description font color in the zone.
Description Font Size - font size for the description in the zone. S
how Button - true/false - showing/hiding the button.
Button Corner - the corner of the chart where the button will appear.
Button Text - description to appear on the button.
Button Color - button color.
Button Text Color - font color on the button.
Button X Size - button width.
Button Y Size - button height.
Button X Position - button position relative to the X-axis.
Button Y Position - button position relative to the Y-axis.
Button Font Size - font size on the button.
This indicator is very versatile. It has many parameters for customization. You can simply add it to your chart, and everything will work automatically.
Good luck.