RSI Divergence Scanner MT5
- 유틸리티
- 버전: 7.4
- 업데이트됨: 3 5월 2026
- 활성화: 15

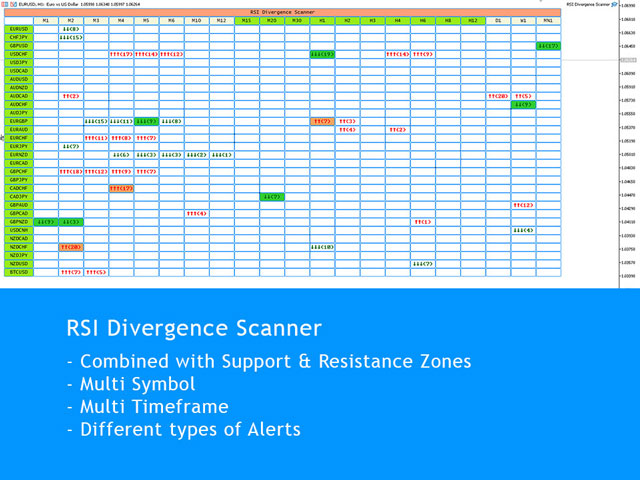
RSI Divergence Scanner is a multi-timeframe and multi-symbol dashboard and alert that checks all timeframes and symbols to find regular and hidden divergences between price chart and RSI indicator.
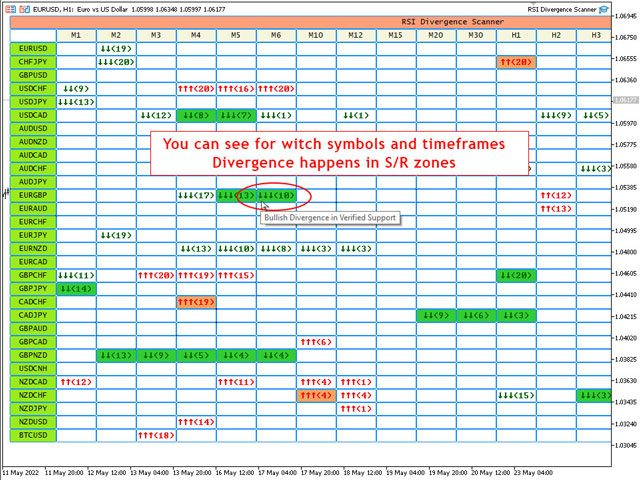
This divergence scanner is integrated with support and resistance zones so you can check the RSI divergences in the most important areas of the chart to find trend reversals in price chart.
Download demo version (works on M4,M6,M12,M20,H3,H8 timeframes of 20 symbols of Market Watch window)
Full description of scanner parameters -> click here.
How to get the most from the scanner -> read this article.
Using RSI divergences alongside other technical tools like price action, candlestick patterns and support resistance zones gives reliable signals for possible trend reversals.
If you are using RSI Divergence in your trading strategy, this scanner helps you find the best opportunities to trade without spending much time in front of your system.
RSI Divergence Scanner Features:
- Scanner finds both regular (classic) and hidden divergences
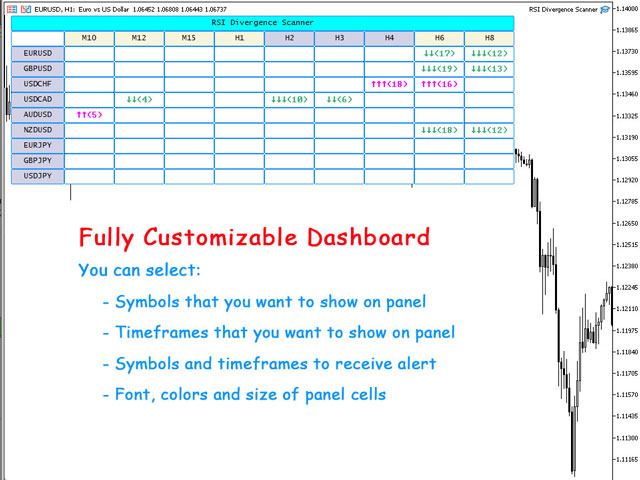
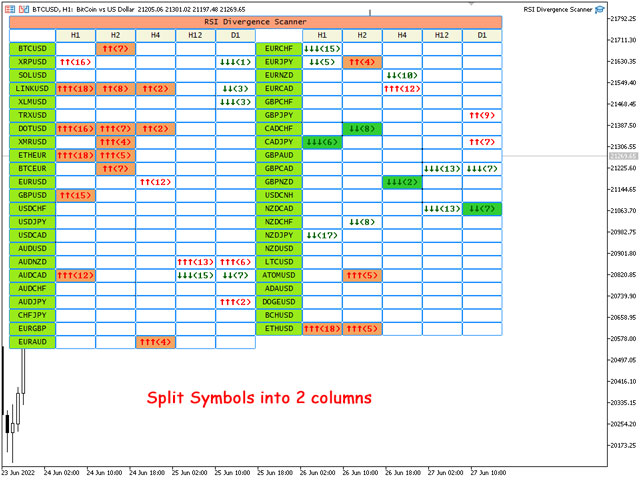
- Run the dashboard on one chart and see the RSI Divergence for all selected symbols and timeframes.
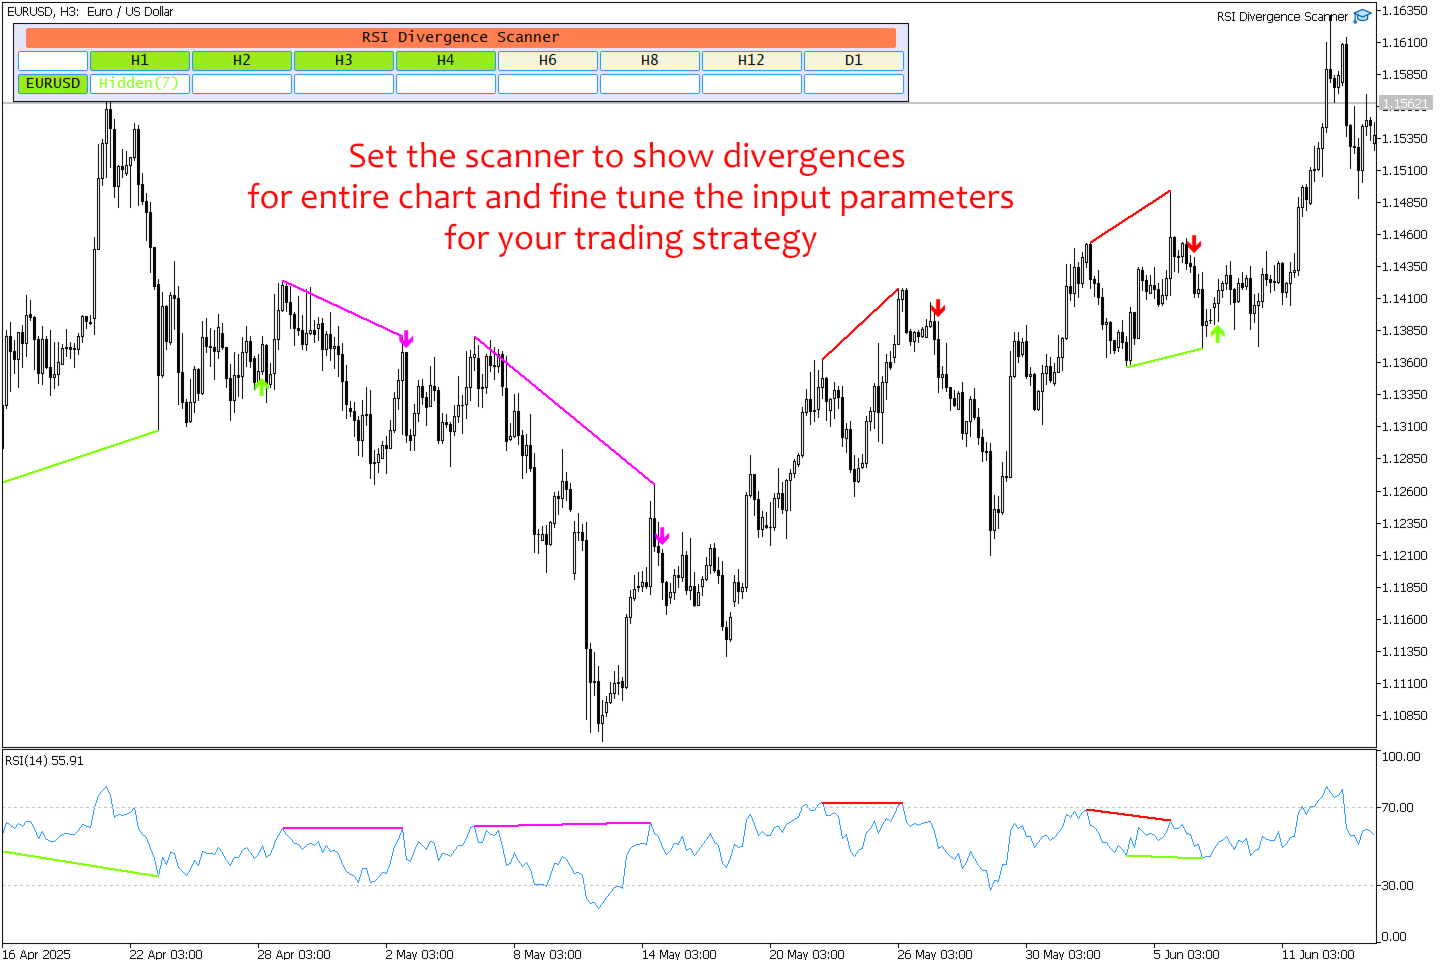
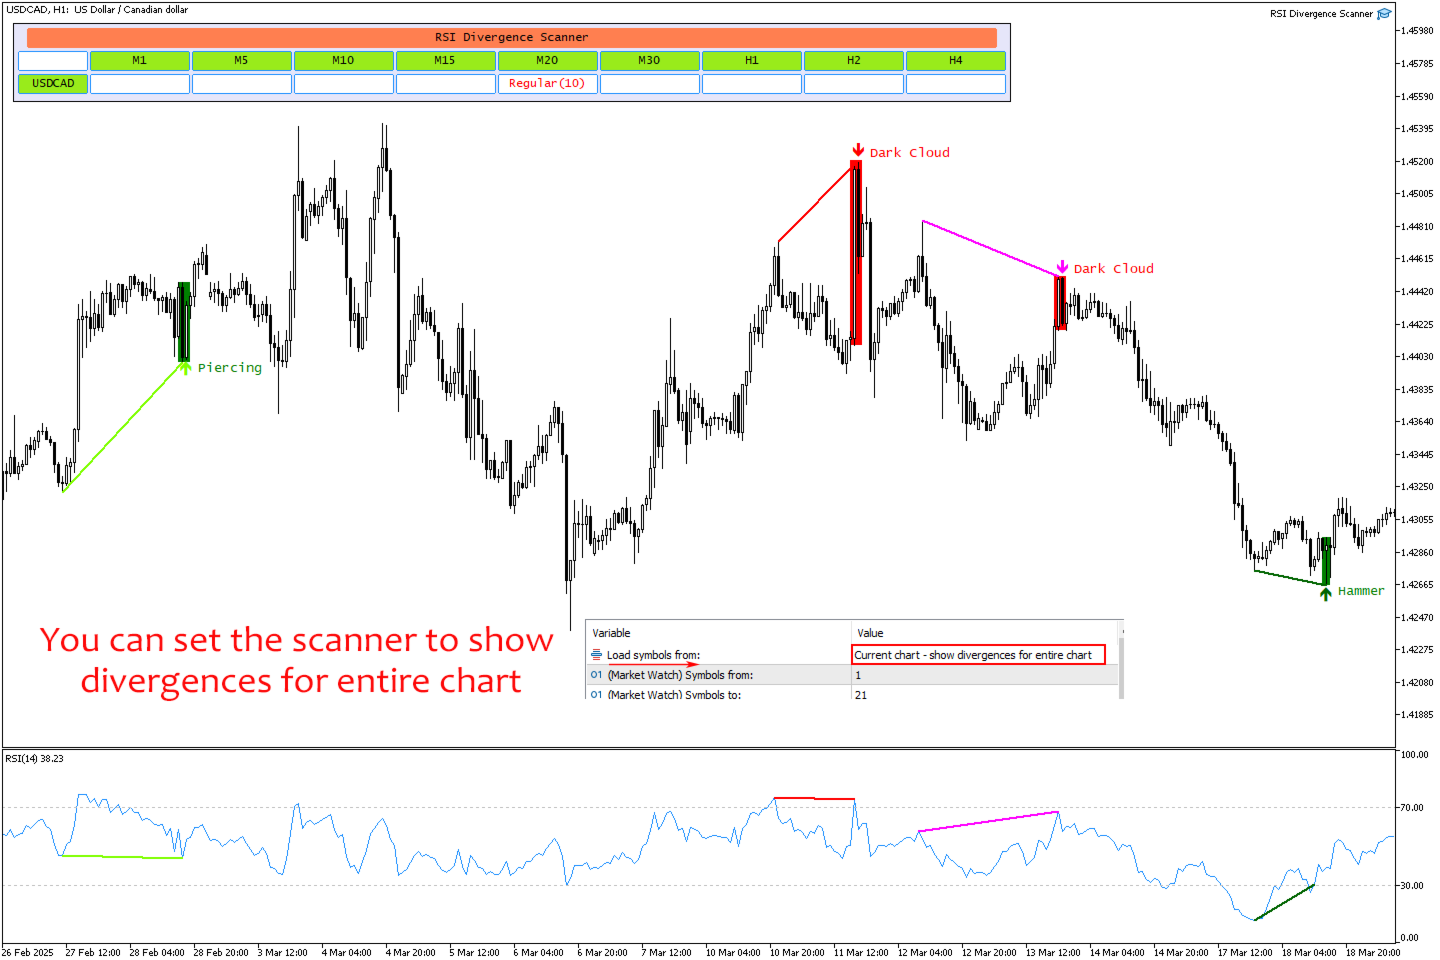
- The scanner shows the divergences for entire chart when you set it to load one chart symbol.
- You can set the scanner to only search for divergences that occur in overbought/oversold levels (that you set in parameters).
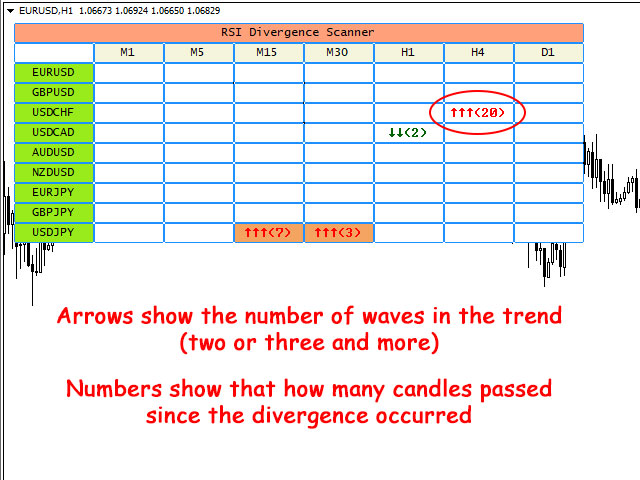
- The panel shows that how many candles passed since the divergence occurred.
- The panel shows the number of trend waves (2 or 3 and more) that leads to the divergence.
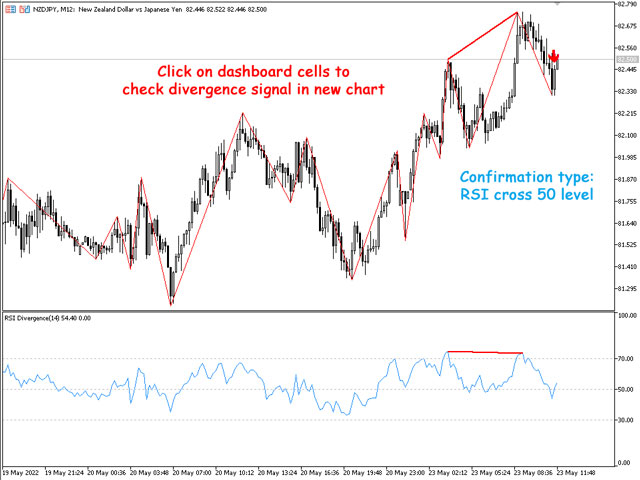
- When you click on table cells, you can see the S/R zone, divergence line and divergence arrow on the opened price chart.
- You can split the symbols into 2 or 3 columns to show more symbols on the chart.
- You can separate symbols into multiple dashboards with different parameters for each dashboard (for example for different markets).
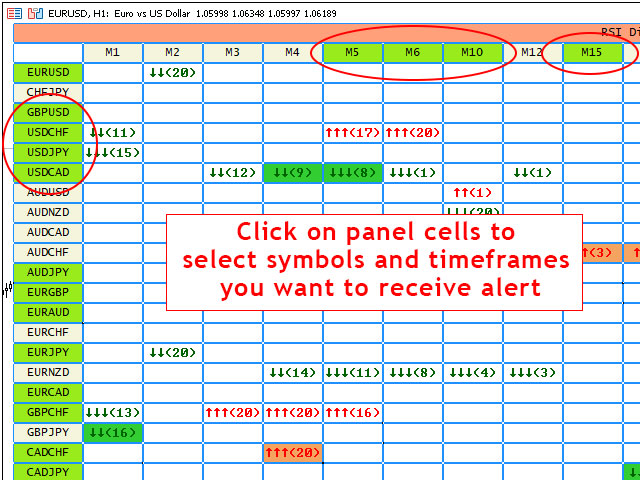
- You can enable/disable alerts for symbols and timeframes directly from the scanner dashboard.
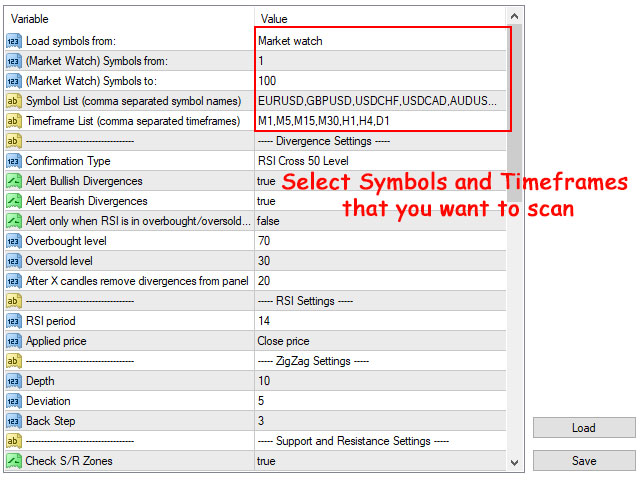
- Scanner works in all markets (Forex, Stocks, Indices, Commodities, Crypto ...), you can write the symbol names in the settings (comma separated) or simply set the scanner to read the symbols from market watch.
Different confirmations for divergences
There are 7 confirmation option for RSI divergences that you can select in input parameters:
- Candlestick Patterns
- RSI line cross 50 level
- Price returns to previous H/L (known as change of character or momentum shift)
- Heiken Ashi indicator - Changing the Color
- Stochastic indicator - Lines Cross
- Strong Reversing Candle (may not happen)
- Immediate alert without confirmation
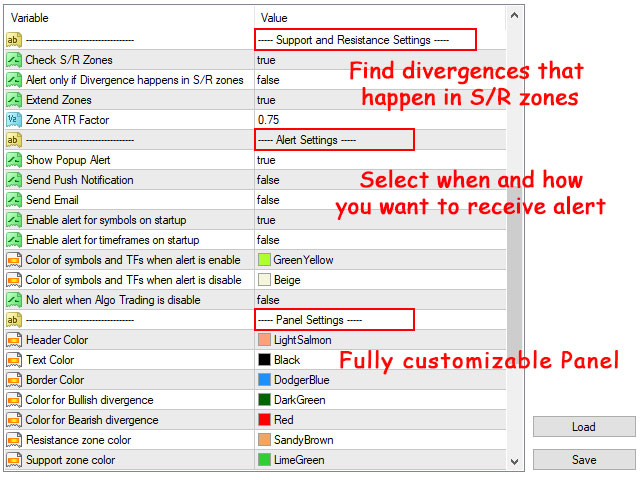
Integrated with support and resistance zones
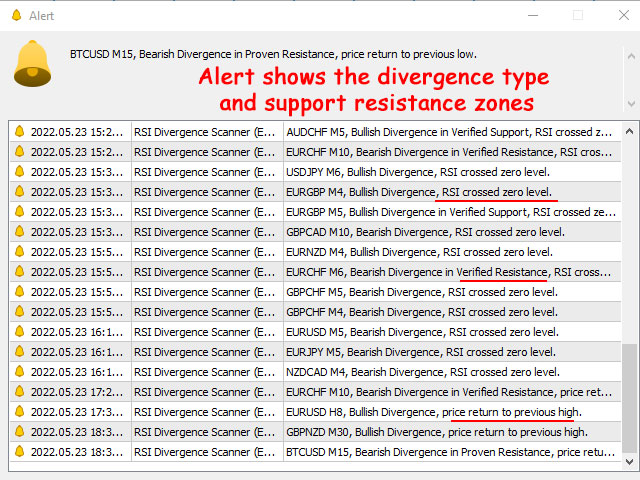
- You can set the scanner to only receive alerts for RSI divergences that are inside the support and resistance zones.
- You can see witch RSI divergences happen in support resistance zones through cell colors.
- You can set the parameters for support and resistance zones in scanner input parameters.
- Support and resistance zones are calculated based on shved supply and demand indicator that you can download for free from this link (scanner doesn't need it).
Different Alert Types:
- Show Pop Up Alert: Show alert window when scanner alert triggers.
- Send Push Notification: Send push notification to mobile phone when scanner alert triggers. (You should set metatrader Notifications options)
- Send Email: Send email when scanner alert triggers. (You should set metatrader Email options)
Notes:
- RSI Divergence Scanner uses ZigZag indicator to determine trend direction and HH/LL of the price, you can change the ZigZag parameters in the indicator's input window.
- You can add the free RSI Divergence Indicator to your default chart template, so when you click on the dashboard cells, you can see the divergence on the opened chart (dashboard doesn't need the indicator to run).
- Dashboard works smoothly for 50 symbols and all 21 timeframes on an average PC, you can add more symbols when you reduce the number of timeframes.
- If there are many symbols in the market watch, in the first run of the scanner on the chart it may take some time to load the history data for all timeframes of all symbols.
- If you don't want to find RSI divergences on W1 and MN1 timeframes, don't load them on the dashboard. Charts must have at least 300 candles for checking the trend and finding the divergences.
- Dashboard updates every 1-minute candle open time, run it on more volatile symbols like EURUSD and BTCUSD to receive new price ticks faster.


Dear Amir Your level of support is really appreciated. firstly, if you please add trend breakout(regular divergence confirmation) and trendline confluence(hidden divergence confirmaion) it wil improve the reliability of the signal and secondly if possible please add notification of sending single alert for concurrent detected divergecne for differnet time frame as well in the setting as someone has a strategy with trigger of cucurrent divergence in 2 or 3 timeframe, then after observing this triger they will enter the position.
Best