Stochastic Divergen MT5
- 지표
-
Komang Putra Riswanjaya
 I am a freelance developer specializing in MQL4, MQL5, and Pine Script, focused on building custom trading solutions for MetaTrader and TradingView platforms.
My services include:
* Expert Advisors (EA)
* Custom Indicators
* Trading Tools & Utilities
* Strategy Automation - 버전: 1.2
- 업데이트됨: 22 6월 2025
- 활성화: 10
Overview
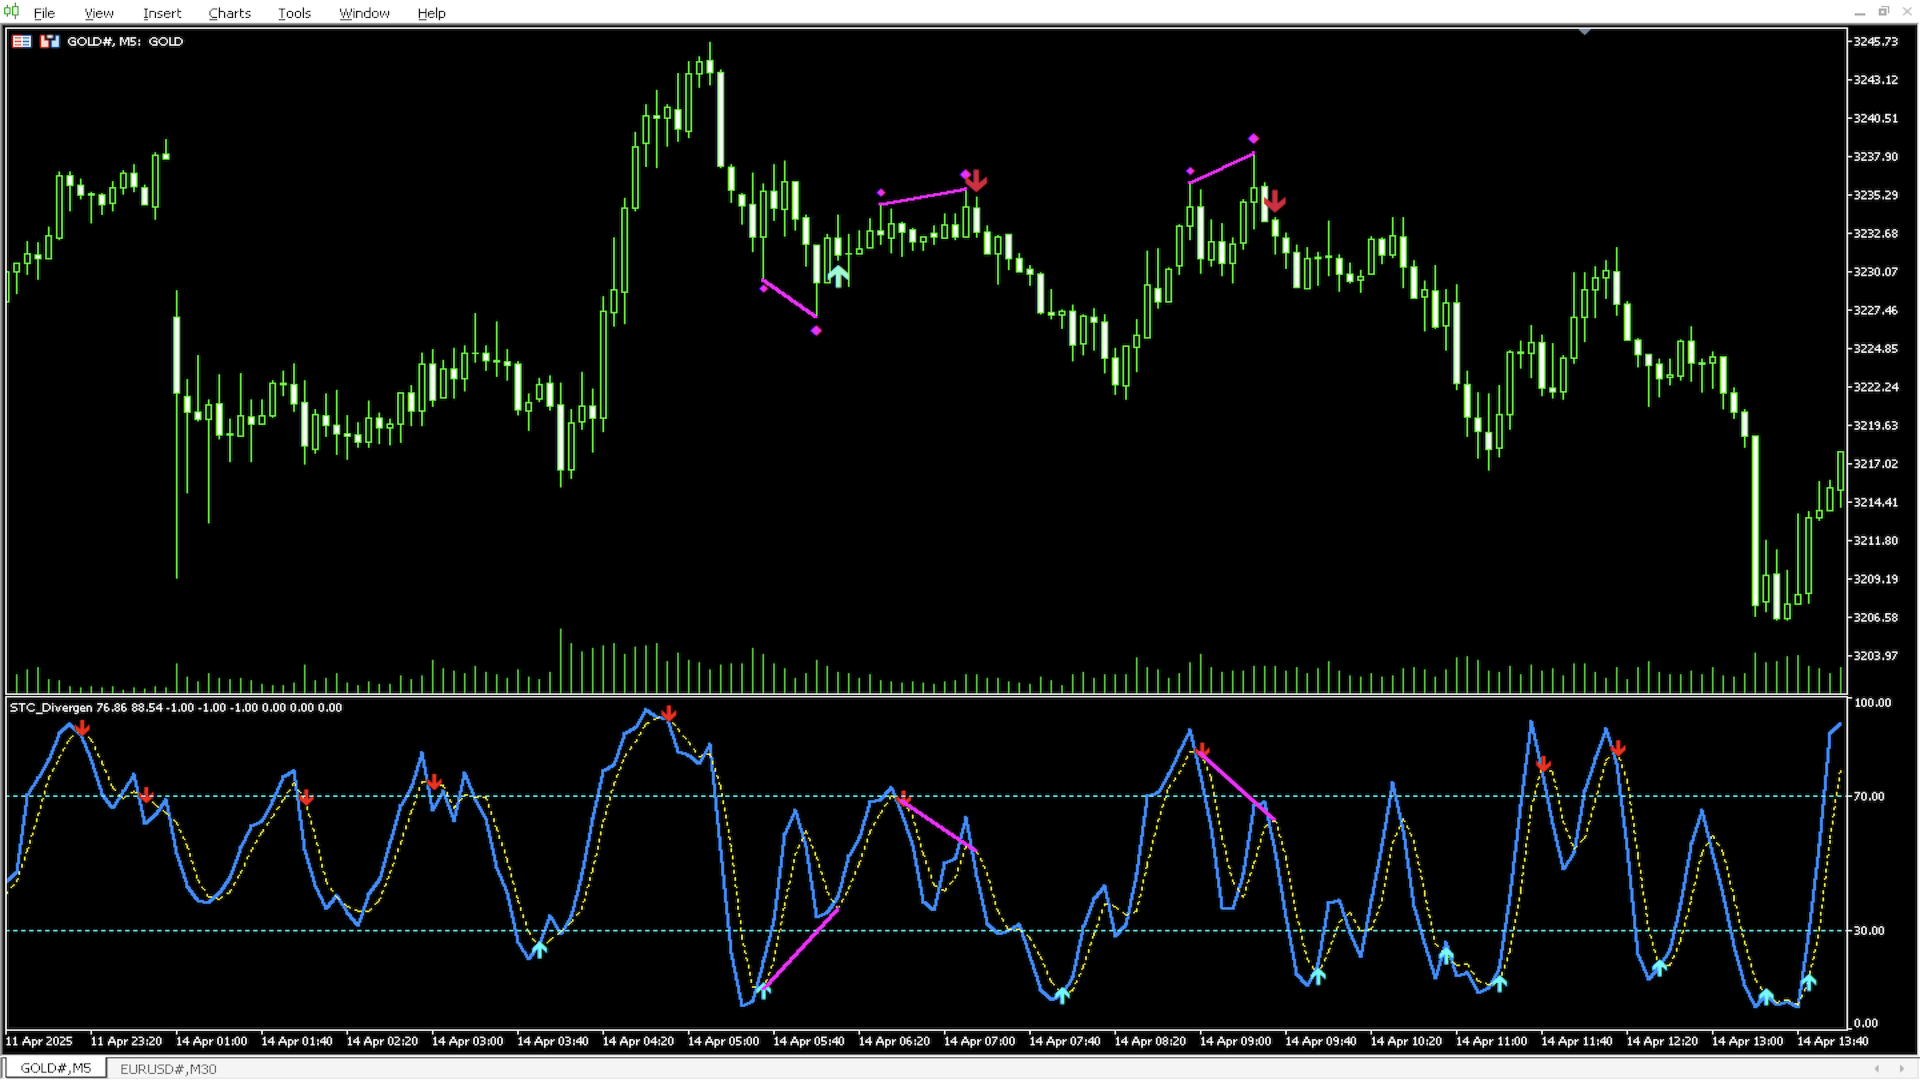
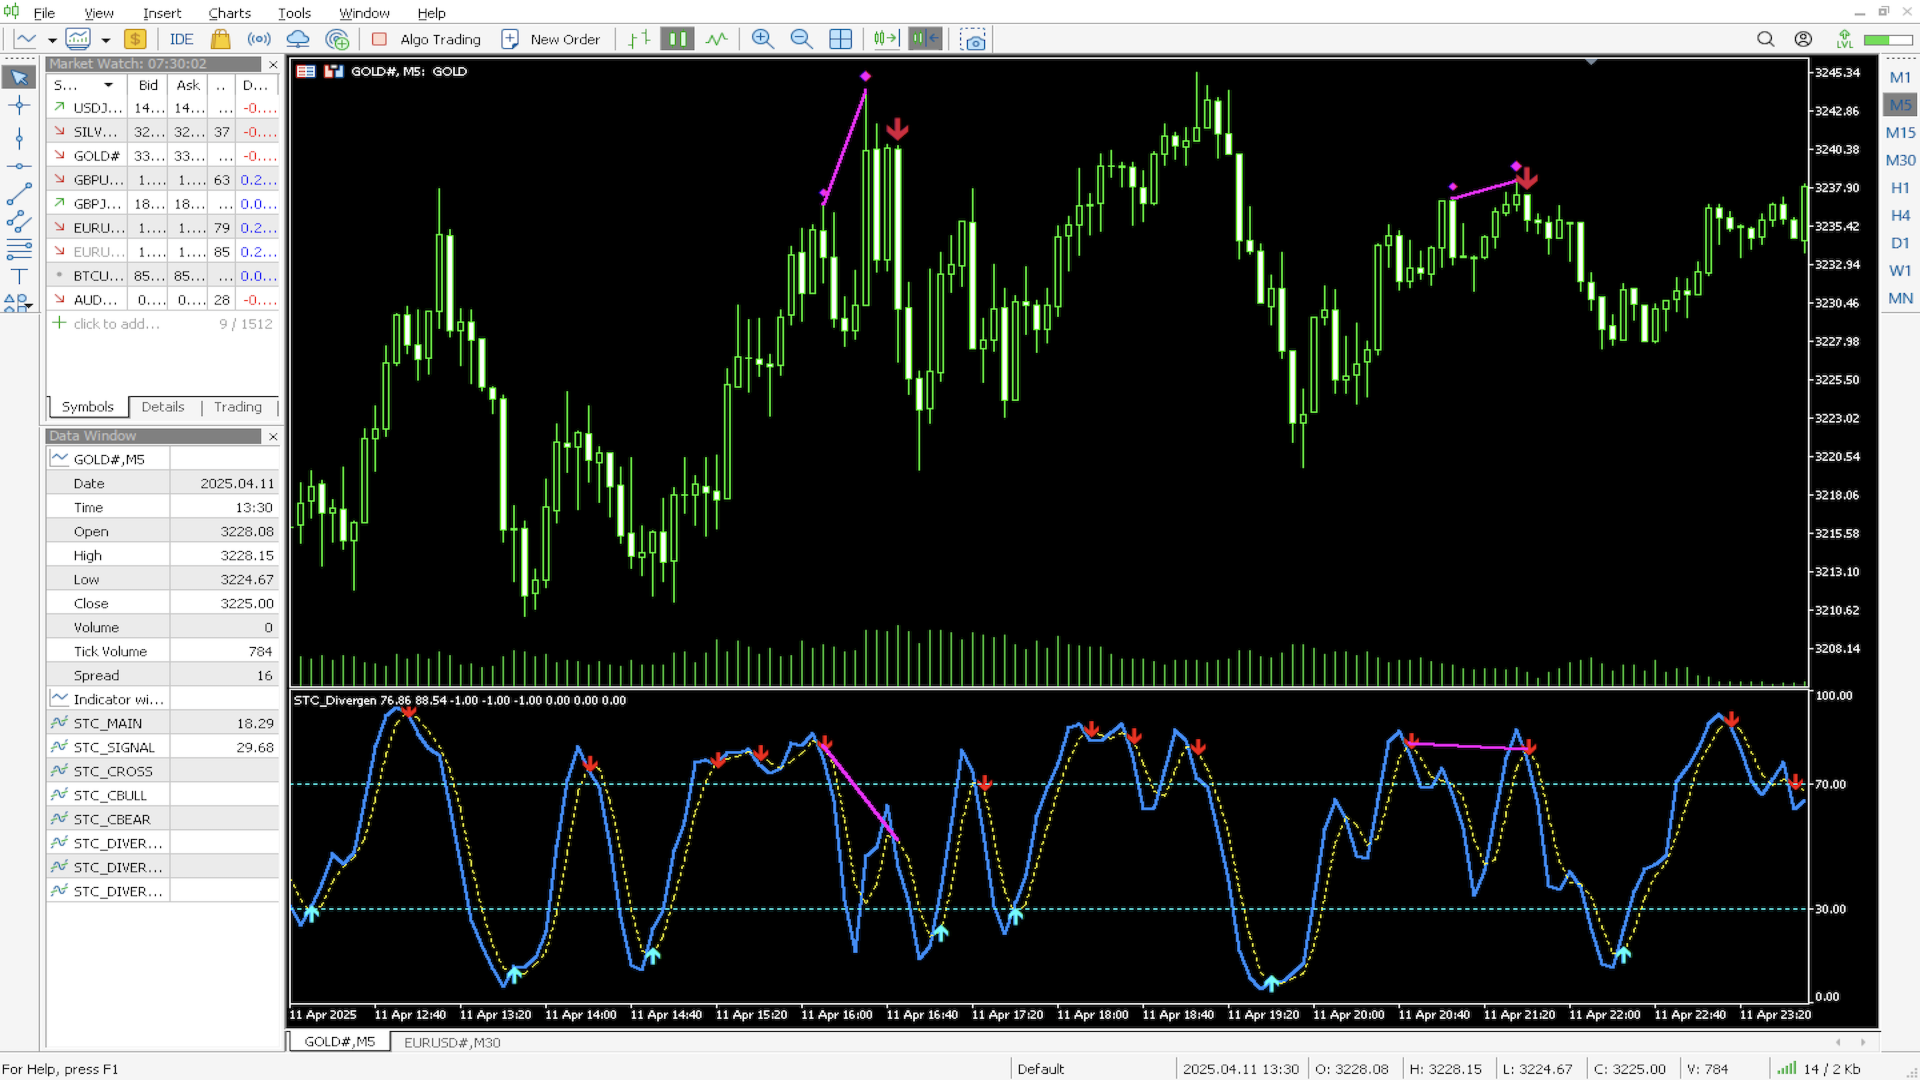
The Stochastic Divergence Indicator is a tool designed to help identify potential market turning points by analyzing divergences between price and the Stochastic Oscillator. It highlights divergence signals visually on the chart, assisting traders in observing possible trend changes.
Key Features
-
No Repaint: Once a signal is formed, it remains on the chart.
-
Adjustable Parameters: Settings can be modified to fit different trading preferences and timeframes.
-
Visual Display: Arrows are plotted directly on the chart when divergence is detected.
-
Alerts: Includes on-screen alerts and push notifications.
-
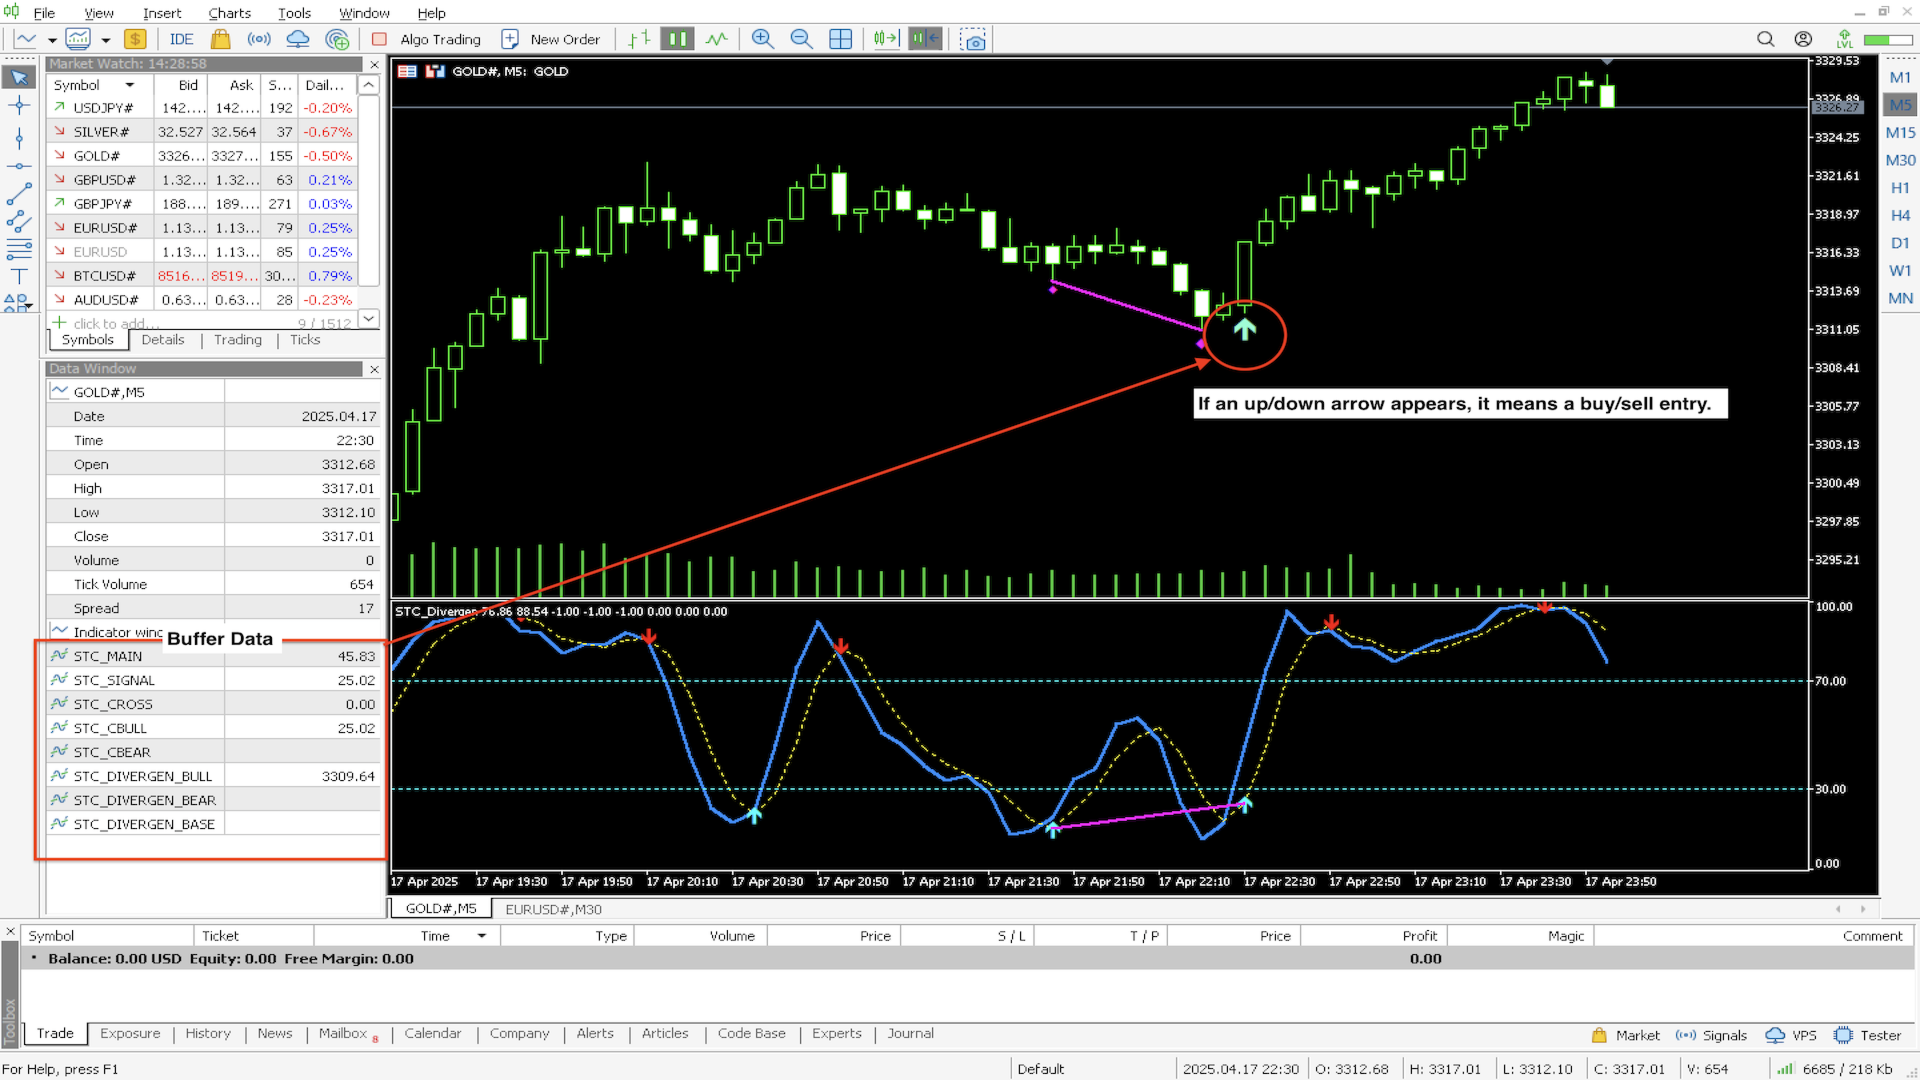
Data Buffer Support: Can be used in Expert Advisors for automation.
-
Instrument Compatibility: Works with various instruments including forex pairs, indices, and commodities.
Usage
When a divergence is detected, an arrow will be plotted on the chart indicating a possible shift in trend. Traders may use these signals as part of their broader decision-making process. As with any tool, it is recommended to combine this indicator with proper risk management and additional analysis.
The usage example is shown in the screenshot below.


it's OK
If you experience any issues with our product, please don’t hesitate to reach out — we’re always open to discussion and happy to assist.
Thank you once again for your support.