Auto Fibo Retracement MT4

3.75

Auto Fibonacci Retracement Indicator — Flexible and Reliable

This is not just another Auto Fibonacci Retracement indicator — it’s one of the most flexible and dependable tools available. If you find it useful, please leave a review or comment to support the project.

Check out my other helpful tools below:

Features

  • Automatically calculates up to 7 Fibonacci levels on your customized timeframe.

  • Fully adjustable levels to fit your trading preferences.

  • Choose between High/Low prices or Open/Close prices for calculation.

  • Option to freeze levels, preventing recalculation as the chart moves.

  • Keep the starting point fixed while dynamically recalculating the ending point.

  • Automatic recalculation within a fixed frame for consistent analysis.

  • Extend Fibonacci lines to the left and/or right for better chart visibility.

  • Position Fibonacci level information (level and value) to the right or left of the lines.

  • Show or hide level price values.

  • Customize line color and thickness for easy visualization.
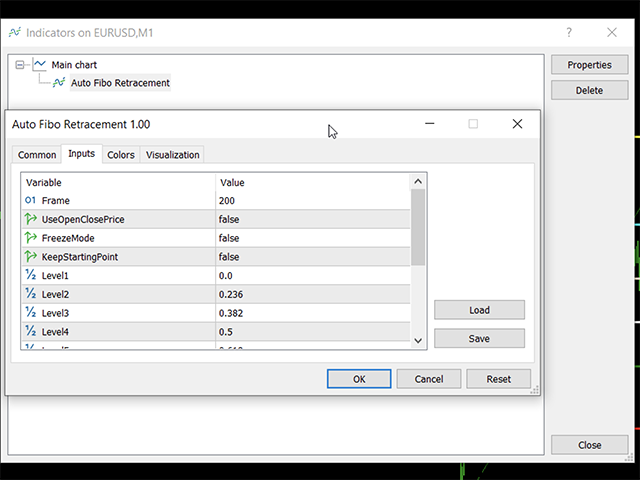
Settings

  • Frame: Number of candles to look back for Fibonacci calculations.

  • UseOpenClosePrice: Set to True to use Open/Close prices instead of High/Low, reducing noisy signals. Note: This may cause recalculations, which is intentional.

  • FreezeMode: Set to True to freeze Fibonacci levels after initialization, preventing recalculation when the chart moves.

  • KeepStartingPoint: Set to True to lock the starting point of the frame. The starting point updates only if the main trend reverses.

  • Level1 to Level7: Set values for up to 7 Fibonacci levels; enter a number less than 0 to hide a level.

  • ExtendLeft / ExtendRight: Draw Fibonacci lines to the far left and/or right edges of the chart.

  • ShowLevelPrice: Toggle the display of prices next to levels.

  • InfoOnLeft: Position level info on the left side.

  • LineColor: Choose the color for the Fibonacci lines.

  • LineWidth: Set the thickness of the level lines.

Note: Due to MQL4 limitations, this MT4 version cannot customize styles for each individual Fibonacci level like the MT5 version can.

How to Use

Simply attach the indicator to your chart by clicking its name. Adjust the settings as needed — all options are explained above.

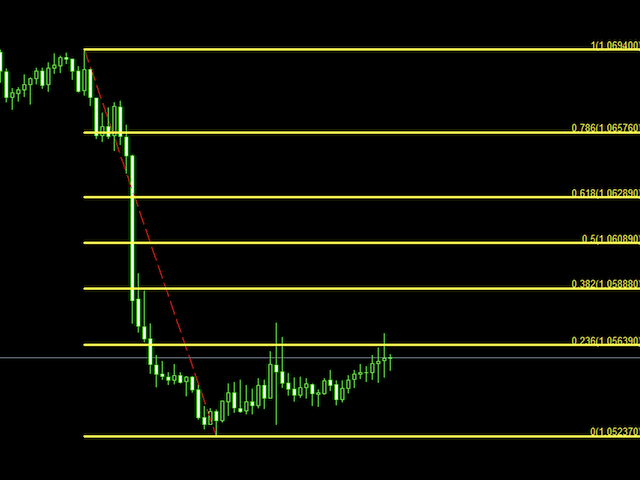
What You’ll See on the Chart

  • A dashed line indicating the main trend direction: green for bullish, red for bearish.

  • Up to 7 horizontal Fibonacci level lines, each labeled with the level and its price.

If you need further assistance, please don’t hesitate to leave a comment!


리뷰 5
david cruz
18
david cruz 2025.07.08 22:34 
 

Excelente herramienta

Alfon45
209
Alfon45 2024.08.25 16:25 
 

Good work !!

yuriy224
84
yuriy224 2026.02.21 10:50 
 

Строит фибо не там где я хочу, а там, где он хочет, не понравился.

추천 제품
BeST_ Classic Pivot Points is an MT4 Indicator that is based on the widely known and definitely classic Pivot Point of a market prices activity. A pivot point is calculated as an average of significant prices (high,low,close) from the performance of a market in the prior trading period. If the market in the following period trades above the pivot point it is usually evaluated as a bullish sentiment, whereas trading below the pivot point is seen as bearish. A pivot point and the associated suppo
FREE
-- 간단하지만 효과적입니다. 역전 지표 - 무엇인가요? 슈퍼트렌드(SuperTrend) 논리와 지수 곡선 기술을 결합한 추세 추종 오버레이 지표입니다. 추세 방향을 감지하고 차트에 동적 채널을 그리며, 추세가 반전될 때 실시간 알림을 보냅니다. 어떻게 작동하나요? 지표는 ATR과 슈퍼트렌드 계수를 사용해 지수형 기준선을 계산합니다. 가격이 이 기준선 위나 아래로 마감되면 추세 반전이 확인됩니다. 녹색 화살표는 매수 추세 시작을, 빨간색 화살표는 매도 추세 시작을 표시합니다. 주요 기능: ATR 기반 동적 채널을 적용한 지수 추세 기준선 녹색/적색으로 구분된 추세선 및 채워진 채널 추세 반전 시 매수/매도 화살표 신호 내장 알림: 팝업, 푸시 알림, 이메일, 소리 중복 알림 방지 (바당 하나의 알림) 완전 커스터마이징 가능: 색상, 선 두께, 화살표 크기, 채널 폭 지연 없는 깔끔한 차트 오버레이 입력값: 지수 추세율, 슈퍼트렌드 계수, ATR 기간, 채널 폭 토글 기능
FREE
SRP (Strong Retracement/Reversal Points) is a powerful and unique support and resistance indicator. It displays the closest important levels which we expect the price retracement/reversal! If all level are broken from one side, it recalculates and draws new support and resistance levels, so the levels might be valid for several days depending on the market! Key Features You can use it in all time-frames smaller than daily! Displays closest significant support and resistance levels Update the le
FREE
UPD1 Fibo Levels
Vitaliy Kuznetsov
5 (3)
표시기는 지정된 수의 양초를 분석하고 고가를 기준으로 피보나치 수준을 표시합니다. 레벨이 재정렬되기 때문에 범위의 오른쪽에 관심이 있습니다. 가격은 레벨을 자화하고 터치에 반응합니다. 이 도구를 사용하여 수정 후 추세 진입점을 찾습니다. 왼쪽에서 레벨이 완벽하게 상승한 것을 보면 극한 지점에서 움직임의 끝을 발견했다고 가정할 수 있습니다. 모든 선은 버퍼 또는 개체를 통해 그려집니다(선택 사항). 입력 매개변수. Bars Count - 계산 범위. Visual Button - 버튼 표시(활성화/비활성화). Corner - 버튼 앵커 각도. X indent - 픽셀의 수평 패딩. Y indent - 픽셀의 수직 패딩. Label Visual - 디스플레이 레벨 레이블. Label Font Size   - 글꼴 크기. Label Shift Bars   - 비문의 들여쓰기(촛불의 수). Label Tooltip   - 레벨 위의 커서 아래에 텍스트 표시. Draw Lines  
FREE
pivot points using by many traders and pivot levels most of the times are very helpfull . this indicator is a custom with internal parameters. it can show two times pivot (weekly and daily). you can choose periods total for each time showing pivots.( 1 week , 2 week ,...1day , 2day ,...) when use weekly and daily pivots , it can show you many support and resistance zones. if have proposal comment too me for upgrading indicator.
FREE
Free automatic fibonacci
Tonny Obare
4.67 (49)
Free automatic Fibonacci is an indicator that automatically plots a Fibonacci retracement based on the number of bars you select on the BarsToScan setting in the indicator. The Fibonacci is automatically updated in real time as new highest and lowest values appears amongst the selected bars. You can select which level values to be displayed in the indicator settings. You can also select the color of the levels thus enabling the trader to be able to attach the indicator several times with differe
FREE
Fibonacci SR Indicator
Martin Eshleman
5 (1)
Fibonacci SR Indicator This indicator creates support and resistance lines. This indicator is based on Fibonacci Retracement and Extension levels. It will consider many combinations of the Fibonacci levels and draw support/resistance lines based on these. This indicator uses tops and bottoms drawn by the ZigZag indicator in its calculations. The ZigZag can also be drawn on the chart, if necessary. The indicator considers many combinations of past reversal points and Fibonacci ratio levels, and w
FREE
OA SnR Power MT4
Duc Hoan Nguyen
Special offer : ALL TOOLS , just $35 each! New tools   will be   $30   for the   first week   or the   first 3 purchases !  Trading Tools Channel on MQL5 : Join my MQL5 channel to update the latest news from me 개요 OA SnR Power는 트레이더가 지지와 저항 레벨의 강도를 식별하고 평가하도록 설계된 강력한 도구입니다. 거래량, 반등 빈도 및 재테스트 횟수와 같은 주요 요소를 통합하여 이 지표는 시장의 주요 가격 영역에 대한 종합적인 뷰를 제공합니다. 더 많은 제품 보기:   모든 제품 OA SnR Power의 작동 원리 고점과 저점 식별 이 지표는 지역 고점과 저점을 계산하기 위해 지능형 알고리즘을 사용합니다. 사용자는 영역 폭 설정을 조정하여 잠재적인 지지 및 저항 수준을 정확하게 탐지할 수 있습니다. 주요
FREE
Wise Men Indicator demo
Bohdan Kasyanenko
3 (2)
The indicator displays signals according to the strategy of Bill Williams on the chart. Demo version of the indicator has the same features as the paid, except that it can work only on a demo account . Signal "First Wise Man" is formed when there is a divergent bar with angulation.  Bullish divergent bar - with lower minimum and closing price in the upper half. Bearish divergent bar - higher maximum and the closing price at the bottom half. Angulation is formed when all three lines of Alligator
FREE
PZ Penta O MT4
PZ TRADING SLU
2.33 (3)
The Penta-O is a 6-point retracement harmonacci pattern which usually precedes big market movements. Penta-O patterns can expand and repaint quite a bit. To make things easier this indicator implements a twist: it waits for a donchian breakout in the right direction before signaling the trade. The end result is an otherwise repainting indicator with a very reliable trading signal. The donchian breakout period is entered as an input. [ Installation Guide | Update Guide | Troubleshooting | FAQ | A
FREE
Major Support and Resistance Indicator
Ahmad Ar Abedalaziz Alazaizeh
This indicator filters the Zigzag indicator to calculate the main support and resistance levels. Variables minimum gap between peaks : is the distance (GAP) between the peaks of the Zigzag peaks sensitivity : Minimum number of nearby peaks look back: it means that it has to test the last 50 peaks in the Zigzag object name perfix: a prefix for level’s line name on chart
FREE
Fibonacci Retracement object is an object that has been provided by metatrader 4 platform. But  Fibonacci Retracement  object doesn't automated adjust the chart. You have to put and manage it manually to the chart. Because of that, this indicator was created. If you like using filbonacci retracement indicator, highly recommended to use Automated Fibonacci Retracement Indicator if you want to get better result in here: https://www.mql5.com/en/market/product/95515 LT Automated Fibonacci Retraceme
FREE
Line
Andrea Fontanini
free only until the end of the week The following indicator must be used and contextualized according to your trading methodologies. It provides excellent trading insights and identifies rejection zones on the drawn lines. Several parameters can be customized. The indicator will plot three levels above and below the opening price on D1, W1, and MN1. It will provide the daily ADR and display two additional daily sessions (EUROPE session and USA session). The colors of the various lines can be cu
FREE
The   Pivot Point indicator   automatically calculates and displays the pivot point line and support and resistance levels. Pivot can be calculated according to the Classic, Floor, Fibonacci, Woodie, Camarilla or DeMark formula. It is also possible to select the period for calculating the indicator. A trader can choose from daily, weekly, monthly, or user-defined periods. Types of pivots Classic Floor Fibonacci Woodie Camarilla DeMark Main features The indicator shows the current and historic
FREE
Necessary for traders: tools and indicators Waves automatically calculate indicators, channel trend trading Perfect trend-wave automatic calculation channel calculation , MT4 Perfect trend-wave automatic calculation channel calculation , MT5 Local Trading copying Easy And Fast Copy , MT4 Easy And Fast Copy , MT5 Local Trading copying For DEMO Easy And Fast Copy , MT4 DEMO Easy And Fast Copy , MT5 DEMO The homeopathic indicator is also called the CCI indicator. The CCI indicator was proposed
FREE
Peak Trough Analysis is the great tool to detect peaks and troughs in your chart. Peak Trough Analysis tool can use three different peaks and troughs detection algorithm. The three algorithm include the orignal Fractals Indicator by Bill Williams, the Modified Fractals indicator and ZigZag indicator. You can use this peak and trough analysis tool to detect the price pattern made up from Equilibrium Fractal-Wave process. For further usage, there are good guide line on how to use this peak trough
FREE
This indicators automatically draws the Support and resistances levels for you once you've dropped it on a chart.  It reduces the hustle of drawing and redrawing these levels every time you analysis prices on a chart. With it, all you have to do is dropped it on a chart, adjust the settings to your liking and let the indicator do the rest.  But wait, it gets better; the indicator is absolutely free!  Get the new and improved version here:  https://youtu.be/rTxbPOBu3nY Parameters Time-frame  -> T
FREE
AdvanceZigZag
Gholamreza Mohammad Mojaveri
5 (1)
AdvaneZigZag Indicator Are you tired of the limitations of the traditional ZigZag indicator? Meet AdvaneZigZag, the ultimate tool to simplify your market structure analysis and enhance your trading strategies. Designed with flexibility and precision in mind, AdvaneZigZag brings you advanced features to navigate the market with confidence. Key Features: 1. Enhanced Flexibility:    - While maintaining the familiar simplicity of the conventional ZigZag indicator, AdvaneZigZag offers superior a
FREE
EA Scalping Expert
Gerard Valldosera Gomez
3 (1)
This is a fully automated scalping Expert Advisor that can be run successfully using EURUSD currency pair at H1 timeframe. This EA can't run in the same account. If you want an Expert Advisor that trades daily this is not because it requires patience to wait for a few days or weeks on the right opportunity for it to trade. It takes advantage of the volatility of the price movement.
FREE
Raymond Cloudy Day Indicator for MT4 – Pivot-Based Reversal and Trend Levels Raymond Cloudy Day Indicator is a pivot-based level indicator for MetaTrader 4 (MT4). It was developed by Ngo The Hung based on Raymond’s original idea and is designed to give a structured view of potential reversal zones, trend extensions and support/resistance levels directly on the chart. The default settings are optimised for XAUUSD on the H1 timeframe, but the indicator can be tested and adjusted for other symbols
PZ The Zone
PZ TRADING SLU
4.33 (3)
This indicator displays buy or sell signals according to Bill Williams' definition of the Trading Zone. [ Installation Guide | Update Guide | Troubleshooting | FAQ | All Products ] Easy to use and understand Avoid trading flat markets Deterministic indicator with clear rules The indicator is non-repainting It implements alerts of all kinds It has straightforward trading implications. A blue arrow is a buy signal A red arrow is a sell signal According to Bill Williams trading in the zone helps to
FREE
Follow The Line
Oliver Gideon Amofa Appiah
3.94 (16)
FOLLOW THE LINE GET THE FULL VERSION HERE: https://www.mql5.com/en/market/product/36024 This indicator obeys the popular maxim that: "THE TREND IS YOUR FRIEND" It paints a GREEN line for BUY and also paints a RED line for SELL.  It gives alarms and alerts of all kinds. IT DOES NOT REPAINT and can be used for all currency pairs and timeframes. Yes, as easy and simple as that. Even a newbie can use it to make great and reliable trades. NB: For best results, get my other premium indicators for more
FREE
Clever Trend Swing Levels
Carlos Forero
4.22 (9)
Description: The indicator measures, through the zigzag indicator, the levels of trend or correction. It shows in the chart the levels of each low or high detected. KEY LINKS:   How to Install  –  Frequent Questions  -  All Products  How is this indicator useful? This indicator determines, depending on Zigzag parameter if a trend is beginning, developing, or ending This indicator determines the direction of the trend Components Levels as positive or negative numbers, depending on the direction
FREE
Aroon Classic
Etsushi Ishizuka
Aroon Classic 지표 개요 Aroon Classic 지표는 차트에서 추세의 발생과 지속성을 정량적으로 파악할 수 있는 기술적 도구입니다. “Aroon Up”과 “Aroon Down” 두 개의 라인을 사용해 추세 강도와 전환 시점을 0~100 범위로 표시합니다. Aroon Up 값이 높을수록 강한 상승 추세를, Aroon Down 값이 높을수록 강한 하락 추세를 의미합니다. 주요 특징 추세의 시작과 전환을 시각적으로 구분 계산 기간(기본값: 14)을 사용자 지정 가능 라인 색상, 두께, 스타일을 유연하게 설정 지표 매개변수 매개변수 설명 기본값 Period Aroon 계산에 사용되는 바 수 14 Aroon Up Color Aroon Up 라인 색상 DodgerBlue Aroon Down Color Aroon Down 라인 색상 Tomato Line Width 라인 두께(픽셀) 2 계산 방법 Aroon Up은 지정 기간 내 최고점 이후 경과한 바 수를 다음 공식으로 계산합니다:
FREE
Better Moving Average
Vincent Jose Proenca
STRUCTURAL TREND LINES - MT4 Indicator Simple indicator that automatically draws trend lines based on market structure. Features: - 3 degrees of structure detection (short, medium, long term) - Configurable swing strength for each degree - Single color per degree for clean visualization - Adjustable number of lines per degree - Customizable colors and line widths How it works: The indicator identifies swing highs and lows based on the strength parameter, then connects these points to create t
FREE
Triple RSI
Pablo Leonardo Spata
1 (1)
LOOK AT THE FOLLOWING STRATEGY WITH THIS INDICATOR. Triple RSI is a tool that uses the classic Relative Strength Indicator, but in several timeframes to find market reversals.    1.  ️ Idea behind the indicator and its strategy: In Trading, be it Forex or any other asset, the ideal is to keep it simple, the simpler the better . The triple RSI strategy is one of the simple strategies that seek market returns. In our experience, where there is more money to always be won, is in the marke
FREE
SX Supply Demand Zones accurately identifies and draws high-probability Supply and Demand zones using a sophisticated algorithm. Unlike traditional indicators that clutter your chart, this indicator is designed with a focus on performance and a clean user experience. New Unique Feature: Interactive Legend System What truly sets this indicator apart from everything else is the Interactive Control Legend. You have a professional dashboard directly on your chart that allows you to: Show/Hide: Ins
FREE
A ready-made multitimeframe trading system based on automatic plotting and tracking of Fibonacci levels for buying and selling any symbol. Demo version - calculation of the last 390 bars is not performed. Advantages Determines the trend direction based on a complex of 14 indicators ( Cx ), extremums of ZigZag ( Z ), RSI ( R ), Impulse ( I ) Displaying the values of 14 indicators comprising the trend direction ( Cx ) Plotting horizontal levels, support and resistance lines, channels View the plo
FREE
Basic Harmonic Pattern
Mehran Sepah Mansoor
4.58 (59)
이 지표는 시장 반전 시점을 예측하는 가장 인기 있는 하모닉 패턴을 식별합니다. 이러한 하모닉 패턴은 외환 시장에서 지속적으로 반복되는 가격 형성이며 향후 가능한 가격 움직임을 제안합니다 / 무료 MT5 버전 또한 이 보조지표에는 시장 진입 신호와 다양한 이익실현 및 손절매 신호가 내장되어 있습니다. 하모닉 패턴 지표는 자체적으로 매수/매도 신호를 제공할 수 있지만 다른 기술 지표를 사용하여 이러한 신호를 확인하는 것이 좋습니다. 예를 들어, 매수/매도하기 전에 추세의 방향과 모멘텀의 강도를 확인하기 위해 RSI 또는 MACD와 같은 오실레이터를 사용하는 것을 고려할 수 있습니다. 이 인디케이터의 대시보드 스캐너: ( Basic Harmonic Patterns Dashboard ) 포함된 하모닉 패턴 가틀리 버터플라이 박쥐 게 Shark Cypher ABCD 주요 입력 Max allowed deviation (%): 이 매개변수는 하모닉 패턴의 형성에 허용되는 허용 오차
FREE
CandlePips
Yawo Julio K Kavege Atileh
This indicator works on this way: Trader should provided the n period "Number of Candle" ( the default period is 6) Then the indicator  will calculate the number of pips in the last n period  (not the current candle) And that is display on the chart With that the should confirmed his up trend or down trend analyse according to the number of pips in the last  n candles( bullish or bearish) he has provided
FREE
이 제품의 구매자들이 또한 구매함
Gann Made Easy
Oleg Rodin
4.83 (156)
Gann Made Easy 는 mr.의 이론을 사용하여 최고의 거래 원칙을 기반으로 하는 전문적이고 사용하기 쉬운 Forex 거래 시스템입니다. W.D. 간. 이 표시기는 Stop Loss 및 Take Profit Levels를 포함하여 정확한 BUY 및 SELL 신호를 제공합니다. PUSH 알림을 사용하여 이동 중에도 거래할 수 있습니다. 거래 팁, 보너스, GANN MADE EA를 무료로 받으시려면 구매 후 저에게 연락주세요! 아마도 Gann 거래 방법에 대해 이미 여러 번 들었을 것입니다. 일반적으로 Gann의 이론은 초보자 거래자뿐만 아니라 이미 거래 경험이 있는 사람들에게도 매우 복잡한 것입니다. Gann의 거래 방식은 이론적으로 적용하기 쉽지 않기 때문입니다. 나는 그 지식을 연마하고 Forex 지표에 최고의 원칙을 적용하기 위해 몇 년을 보냈습니다. 표시기는 적용하기가 매우 쉽습니다. 차트에 첨부하고 간단한 거래 권장 사항을 따르기만 하면 됩니다. 지표는 지속적으로 시장
Scalper Inside PRO
Alexey Minkov
4.74 (69)
An exclusive indicator that utilizes an innovative algorithm to swiftly and accurately determine the market trend. The indicator automatically calculates opening, closing, and profit levels, providing detailed trading statistics. With these features, you can choose the most appropriate trading instrument for the current market conditions. Additionally, you can easily integrate your own arrow indicators into Scalper Inside Pro to quickly evaluate their statistics and profitability. Scalper Inside
Game Changer Indicator
Vasiliy Strukov
4.43 (21)
Game Changer는 모든 금융 상품에 적용 가능한 혁신적인 추세 지표로, MetaTrader를 강력한 추세 분석 도구로 탈바꿈시켜 줍니다. 모든 시간대에서 작동하며 추세 식별, 잠재적 반전 신호 제공, 트레일링 스톱 기능, 그리고 신속한 시장 대응을 위한 실시간 알림 기능을 제공합니다. 숙련된 전문가든 이제 막 시작하는 초보자든, Game Changer는 추세의 역학을 명확하게 이해하고 자신감 있고 규율 있는 거래를 할 수 있도록 도와줍니다. 이 지표는 차트 재구성 기능을 지원합니다. 구매 후 즉시 연락 주시면 특별 보너스를 드립니다. Strong Support 및 Trend Scanner 지표를 무료로 제공해 드립니다. [email protected]으로 메시지를 보내주세요. 참고로, 저는 텔레그램에서 EA나 특별 세트를 판매하지 않습니다. 모든 EA는 MQL5에서만 사용 가능하며, 세트 파일은 제 블로그(여기)에서만 다운로드하실 수 있습니다. 사기꾼을 조심하시고 다른 사
M1 Sniper
Oleg Rodin
5 (19)
M1 SNIPER 는 사용하기 쉬운 거래 지표 시스템입니다. M1 시간대에 맞춰 설계된 화살표 지표입니다. 이 지표는 M1 시간대 스캘핑을 위한 단독 시스템으로 사용할 수 있으며, 기존 거래 시스템의 일부로도 사용할 수 있습니다. 이 거래 시스템은 M1 시간대 거래용으로 특별히 설계되었지만, 다른 시간대에도 사용할 수 있습니다. 원래는 XAUUSD와 BTCUSD 거래를 위해 이 방법을 설계했지만, 다른 시장 거래에도 유용하다는 것을 알게 되었습니다. 이 지표의 신호는 추세 방향과 반대로 거래될 수 있습니다. 저는 지표의 신호를 활용하여 양방향으로 거래할 수 있도록 돕는 특별한 거래 기법을 알려드립니다. 이 방법은 특별한 동적 지지선과 저항선 가격 영역을 활용하는 것을 기반으로 합니다. 구매하시면 M1 SNIPER 화살표 지표를 바로 다운로드하실 수 있습니다. 또한, 아래 스크린샷에 표시된 Apollo Dynamic SR 지표는 M1 SNIPER 도구를 사용하는 모든 사용자에게 무료로
Volatility Trend System - a trading system that gives signals for entries. The volatility system gives linear and point signals in the direction of the trend, as well as signals to exit it, without redrawing and delays. The trend indicator monitors the direction of the medium-term trend, shows the direction and its change. The signal indicator is based on changes in volatility and shows market entries. The indicator is equipped with several types of alerts. Can be applied to various trading ins
RFI levels PRO
Roman Podpora
5 (1)
이 지표는 추세 반전 지점과 가격 반등 영역을 정확하게 보여줍니다.       주요 투자자들   . 새로운 트렌드가 형성되는 곳을 파악하고 최대한 정확하게 의사결정을 내리며 모든 거래를 완벽하게 통제합니다. TREND LINES PRO   지표와 함께 사용할 때 최대의 잠재력을 발휘합니다.  VERSION MT5 지표가 보여주는 내용: 새로운 추세의 시작 시 활성화되는 반전 구조 및 반전 수준. 최소한의 위험 대비 수익률을 갖는 이익 실현   (TAKE PROFIT)   및   손절매(STOP LOSS)   레벨 표시       RR 1:2   . 지능형 손실 감소 로직이 적용된 손절매 기능. 지정된 지표에서 두 가지 추세 유형에 대한 반전 패턴을 표시합니다. 지표: 트렌드를 따라   트렌드 라인 프로   (글로벌 트렌드 변화) 트렌드 프로   (빠른 트렌드 변화) 간단하고 효과적입니다       스캐너       실시간 추세 (신규). 다중 시간 프레임 도구 필터링. 표시하다  
Dynamic Forex28 Navigator
Bernhard Schweigert
4.43 (7)
Dynamic Forex28 Navigator - 차세대 외환 거래 도구. 현재 49% 할인. Dynamic Forex28 Navigator는 오랫동안 인기 있는 지표의 진화형으로, 세 가지의 힘을 하나로 결합했습니다. 고급 통화 Strength28 지표(695개 리뷰) + 고급 통화 IMPULSE with ALERT(520개 리뷰) + CS28 콤보 신호(보너스). 지표에 대한 자세한 정보 https://www.mql5.com/en/blogs/post/758844 차세대 Strength 지표는 무엇을 제공합니까?  원래 지표에서 좋아했던 모든 것이 새로운 기능과 더 높은 정확도로 강화되었습니다. 주요 기능: 독점적인 통화 Strength 공식.  모든 시간대에 걸쳐 부드럽고 정확한 강도선. 추세와 정확한 진입을 식별하는 데 이상적입니다. 역동적인 시장 피보나치 수준(시장 피보나치).  이 지표에만 있는 고유한 기능. 가격 차트가 아닌 통화 강도에 피보나치가 적용됩니다.
Precautions for subscribing to indicator This indicator only supports the computer version of MT4 Does not support MT5, mobile phones, tablets The indicator only shows the day's entry arrow The previous history arrow will not be displayed (Live broadcast is for demonstration) The indicator is a trading aid Is not a EA automatic trading No copy trading function The indicator only indicates the entry position No exit (target profit)  The entry stop loss point is set at 30-50 PIPS Or the front hi
GOLD Impulse with Alert
Bernhard Schweigert
4.64 (11)
이 지표는 Advanced Currency IMPULSE with ALERT  +   Currency Strength Exotics  의 2가지 제품의 슈퍼 조합입니다. 그것은 모든 시간 프레임에 대해 작동하며 8개의 주요 통화와 하나의 기호에 대한 강약의 충동을 그래픽으로 보여줍니다! 이 표시기는 금, 이국적인 쌍, 상품, 지수 또는 선물과 같은 기호에 대한 통화 강도 가속을 표시하는 데 특화되어 있습니다. 금, 은, 오일, DAX, US30, MXN, TRY, CNH 등의 진정한 통화 강도 가속(충동 또는 속도)을 표시하기 위해 9번째 줄에 모든 기호를 추가할 수 있습니다. 새로운 기본 알고리즘을 기반으로 구축되어 잠재적인 거래를 훨씬 더 쉽게 식별하고 확인할 수 있습니다. 이는 통화의 강세 또는 약세가 가속되는지 여부를 그래픽으로 표시하고 가속 속도를 측정하기 때문입니다. 자동차의 속도계처럼 생각하면 됩니다. 가속화할 때 Forex 시장에서 동일한 일이 분명히 더 빠르
Currency Strength Wizard
Oleg Rodin
4.84 (57)
통화 강도 마법사는 성공적인 거래를 위한 올인원 솔루션을 제공하는 매우 강력한 지표입니다. 표시기는 여러 시간 프레임의 모든 통화 데이터를 사용하여 이 또는 해당 외환 쌍의 힘을 계산합니다. 이 데이터는 특정 통화의 힘을 확인하는 데 사용할 수 있는 사용하기 쉬운 통화 지수 및 통화 전력선의 형태로 표시됩니다. 필요한 것은 거래하려는 차트에 표시기를 부착하는 것뿐입니다. 표시기는 거래하는 통화의 실제 강세를 보여줍니다. 지표는 또한 추세와 거래할 때 유리하게 사용할 수 있는 구매 및 판매 거래량 압력의 극한값을 보여줍니다. 지표는 또한 피보나치에 기반한 가능한 대상을 보여줍니다. 표시기는 PUSH 알림을 포함한 모든 유형의 알림을 제공합니다. 구매 후 연락주세요. 나는 당신과 거래 팁을 공유하고 당신에게 무료로 훌륭한 보너스 지표를 줄 것입니다! 나는 당신에게 행복하고 유익한 거래를 기원합니다!
Trend Screener
STE S.S.COMPANY
4.79 (95)
트렌드 표시기, 트렌드 트레이딩 및 필터링을 위한 획기적인 고유 솔루션, 하나의 도구 안에 내장된 모든 중요한 트렌드 기능! Forex, 상품, 암호 화폐, 지수 및 주식과 같은 모든 기호/도구에 사용할 수 있는 100% 다시 칠하지 않는 다중 시간 프레임 및 다중 통화 표시기입니다. 기간 한정 특가: 지원 및 저항 스크리너 지표는 단 100달러에 평생 제공됩니다. (원래 가격 50 달러) (제안 연장) Trend Screener는 차트에 점이 있는 화살표 추세 신호를 제공하는 효율적인 지표 추세 추종 지표입니다. 추세 분석기 표시기에서 사용할 수 있는 기능: 1. 트렌드 스캐너. 2. 최대 이익 분석이 있는 추세선. 3. 추세 통화 강도 측정기. 4. 경고가 있는 추세 반전 점. 5. 경고가 있는 강력한 추세 점. 6. 추세 화살표 Trend Screener Indicator가 있는 일일 분석 예, 일일 신호 성능...등은 여기에서 찾을 수 있습니다.   여기를 클릭하십시오. L
이 지표를 구매하면 제 프로페셔널 트레이드 매니저를 무료로 드립니다. 우선 이 거래 시스템이 리페인팅, 리드로잉 및 레이그 인디케이터가 아니라는 점을 강조하는 것이 중요합니다. 이는 수동 및 로봇 거래 모두에 이상적인 것으로 만듭니다. 온라인 강좌, 설명서 및 프리셋 다운로드. "스마트 트렌드 트레이딩 시스템 MT5"은 새로운 및 경험이 풍부한 트레이더를 위해 맞춤형으로 제작된 종합적인 거래 솔루션입니다. 10개 이상의 프리미엄 인디케이터를 결합하고 7개 이상의 견고한 거래 전략을 특징으로 하여 다양한 시장 조건에 대한 다목적 선택이 가능합니다. 트렌드 추종 전략: 효과적인 트렌드 추이를 타기 위한 정확한 진입 및 손절 관리를 제공합니다. 반전 전략: 잠재적인 트렌드 반전을 식별하여 트레이더가 범위 시장을 활용할 수 있게 합니다. 스캘핑 전략: 빠르고 정확한 데이 트레이딩 및 단기 거래를 위해 설계되었습니다. 안정성: 모든 인디케이터가 리페인팅, 리드로잉 및 레이그가 아니므로 신뢰
FX Power MT4 NG
Daniel Stein
4.95 (21)
FX Power: 통화 강세 분석으로 더 스마트한 거래 결정을 개요 FX Power 는 어떤 시장 상황에서도 주요 통화와 금의 실제 강세를 이해하기 위한 필수 도구입니다. 강한 통화를 매수하고 약한 통화를 매도함으로써 FX Power 는 거래 결정을 단순화하고 높은 확률의 기회를 발견합니다. 트렌드를 따르거나 극단적인 델타 값을 사용해 반전을 예측하고자 한다면, 이 도구는 귀하의 거래 스타일에 완벽히 적응합니다. 단순히 거래하지 말고, FX Power 로 더 스마트하게 거래하세요. 1. FX Power가 거래자에게 매우 유용한 이유 통화와 금의 실시간 강세 분석 • FX Power 는 주요 통화와 금의 상대적 강세를 계산하고 표시하여 시장 역학에 대한 명확한 통찰력을 제공합니다. • 어떤 자산이 앞서고 있고 어떤 자산이 뒤처지는지 모니터링하여 보다 현명한 거래 결정을 내릴 수 있습니다. 포괄적인 멀티 타임프레임 뷰 • 단기, 중기 및 장기 타임프레임에서 통화와 금의 강세를
Advanced Supply Demand
Bernhard Schweigert
4.91 (299)
현재 40% 할인! 초보자나 전문 트레이더를 위한 최고의 솔루션! 이 보조지표는 우리가 다수의 독창적 기능과 새로운 공식을 통합한 독특하고 고품질이며 저렴한 거래 도구입니다. 이 업데이트를 통해 이중 시간대를 표시할 수 있습니다. 더 높은 TF를 표시할 수 있을 뿐만 아니라 차트 TF와 더 높은 TF 모두를 표시할 수 있습니다: 중첩 영역 표시. 모든 Supply Demand 트레이더들이 좋아할 것입니다. :) 중요한 정보 공개 Advanced Supply Demand의 잠재력을 극대화하려면 다음을 방문하십시오. https://www.mql5.com/ko/blogs/post/720245   진입 또는 목표의 명확한 트리거 포인트를 정확히 찾아냄으로 해서 거래가 어떻게 개선될지 상상해 보십시오. 새로운 알고리즘을 기반으로 매수자와 매도자 간의 잠재적인 불균형을 훨씬 더 쉽게 분간할 수 있습니다. 왜냐하면 가장 강한 공급영역과 가장 강한 수요 영역과 과거에 어떻게 진행 되었는지를(이전
Buy Sell Arrow Swing MT4
Sahib Ul Ahsan
5 (1)
Looking for a powerful yet lightweight swing detector that accurately identifies market structure turning points? Want clear, reliable buy and sell signals that work across any timeframe and any instrument? Buy Sell Arrow MT Swing is built exactly for that — precision swing detection made simple and effective. This indicator identifies Higher Highs (HH) , Higher Lows (HL) , Lower Highs (LH) , and Lower Lows (LL) with remarkable clarity. It is designed to help traders easily visualize market stru
현재 40% 할인 ! 초보자 또는 전문가 트레이더를 위한 최고의 솔루션! 이 대시보드 소프트웨어는 28개의 통화 쌍에서 작동합니다. 2가지 주요 지표(Advanced Currency Strength 28 및 Advanced Currency Impulse)를 기반으로 합니다. 전체 Forex 시장에 대한 훌륭한 개요를 제공합니다. 고급 통화 강도 값, 통화 이동 속도 및 모든(9) 시간대의 28 Forex 쌍에 대한 신호를 보여줍니다. 추세 및/또는 스캘핑 기회를 정확히 파악하기 위해 차트의 단일 지표를 사용하여 전체 시장을 볼 수 있을 때 거래가 어떻게 개선될지 상상해 보십시오! 잠재적인 거래를 식별하고 확인하면서 강력한 통화와 약한 통화를 더욱 쉽게 식별할 수 있도록 이 지표에 기능을 내장했습니다. 이 표시기는 통화의 강세 또는 약세가 증가 또는 감소하는지 여부와 모든 시간대에서 수행되는 방식을 그래픽으로 보여줍니다. 추가된 새로운 기능은 현재 시장 조건 변화에 적응하는
Atomic Analyst
Issam Kassas
5 (3)
우선적으로 언급할 점은이 거래 지표가 다시 그리지 않고 지연되지 않으며 이를 통해 수동 및 로봇 거래 모두에 이상적이라는 점입니다. 사용자 매뉴얼: 설정, 입력 및 전략. Atomic Analyst는 가격의 강도와 모멘텀을 활용하여 시장에서 더 나은 이점을 찾는 PA Price Action Indicator입니다. 고급 필터를 장착하여 잡음과 거짓 신호를 제거하고 거래 잠재력을 높이는 데 도움이 됩니다. 복잡한 지표의 다중 레이어를 사용하여 Atomic Analyst는 차트를 스캔하고 복잡한 수학적 계산을 간단한 신호와 색상으로 변환하여 초보 트레이더가 이해하고 일관된 거래 결정을 내릴 수 있도록합니다. "Atomic Analyst"는 새로운 및 경험이 풍부한 트레이더를위한 종합적인 거래 솔루션입니다. 프리미엄 지표와 최고 수준의 기능을 하나의 거래 전략에 결합하여 모든 종류의 트레이더에 대한 다재다능한 선택지가되었습니다. 인트라데이 거래 및 스캘핑 전략 : 빠르고 정확한 일일
Trend Lines PRO
Roman Podpora
5 (1)
트렌드 라인즈 프로       이 지표는 시장이 실제로 어떤 방향으로 전환되는지 파악하는 데 도움이 됩니다. 실제 추세 반전 지점과 주요 시장 참여자들이 다시 진입하는 지점을 보여줍니다. 보시다시피       BOS 라인       복잡한 설정이나 불필요한 노이즈 없이 더 높은 시간대의 추세 변화와 주요 레벨을 확인할 수 있습니다. 신호는 차트에 다시 그려지지 않고 캔들이 마감된 후에도 계속 표시됩니다. VERSION MT 5   -   RFI LEVELS PRO   표시기   와 결합할 때 최대 잠재력을 발휘합니다. 지표가 보여주는 내용: 실제 변화       추세(BOS 라인) 한 번 신호가 나타나면 그 신호는 계속 유효합니다! 이는 신호를 발생시킨 후 변경될 수 있는 리페인팅 방식의 지표와 중요한 차이점입니다. 리페인팅 방식의 지표는 잠재적으로 자금 손실로 이어질 수 있습니다. 이제 더욱 높은 확률과 정확도로 시장에 진입할 수 있습니다. 또한 화살표가 나타난 후 목표가(익절)
El indicador "MR BEAST ALERTAS DE LIQUIDEZ" es una herramienta avanzada diseñada para proporcionar señales y alertas sobre la liquidez del mercado basándose en una serie de indicadores técnicos y análisis de tendencias. Ideal para traders que buscan oportunidades de trading en función de la dinámica de precios y los niveles de volatilidad, este indicador ofrece una visualización clara y detallada en la ventana del gráfico de MetaTrader. Características Principales: Canal ATR Adaptativo: Calcula
Gold Scalper Super
Aleksandr Makarov
5 (2)
Gold Scalper Super is an easy-to-use trading system. The indicator can be used as a standalone scalping system on the M1 time frame, as well as part of your existing trading system. Bonus: when purchasing an indicator, Trend Arrow Super is provided free of charge, write to us after purchase. The indicator 100% does not repaint!!! If a signal appears, it does not disappear! Unlike indicators with redrawing, which lead to the loss of a deposit, because they can show a signal and then remove it.
PRO Renko System
Oleg Rodin
5 (30)
PRO Renko System 은 RENKO 차트 거래를 위해 특별히 고안된 매우 정확한 거래 시스템입니다. 이것은 다양한 거래 상품에 적용될 수있는 보편적 인 시스템입니다. 체계는 효과적으로 당신에게 정확한 반전 신호에 접근을 주는 소위 시장 소음을 중화합니다. 이 표시기는 사용하기가 매우 쉽고 신호 생성을 담당하는 매개 변수가 하나만 있습니다. 당신은 쉽게 당신의 선택의 어떤 무역 계기에 공구를 적응시킬 수 있고 renko 막대기의 크기. 나는 항상 당신이 내 소프트웨어로 수익성있게 거래 할 수 있도록 추가 지원을 제공 할 준비가되어 있습니다! 나는 당신에게 행복하고 수익성있는 거래를 기원합니다! 구매 후 저에게 연락하십시오! 내 렌코 차트 생성기를 보내드립니다. 또한 내 개인 권장 사항 및 시스템의 다른 모듈을 무료로 공유 할 것입니다!
IQ FX Gann Levels
INTRAQUOTES
5 (2)
IQ FX Gann Levels a precision trading indicator based on W.D. Gann’s square root methods . It plots real-time, non-repainting support and resistance levels to help traders confidently spot intraday and scalping opportunities with high accuracy. William Delbert Gann (W.D. Gann) was an exceptional market analyst, whose trading technique was based on a complex blend of mathematics, geometry, astrology, and ancient mathematics which proved to be extremely accurate. Setup & Guide:  Download  MT5 Ver
PZ Harmonacci Patterns
PZ TRADING SLU
3.17 (6)
Trade smarter, not harder: Empower your trading with Harmonacci Patterns This is arguably the most complete harmonic price formation auto-recognition indicator you can find for the MetaTrader Platform. It detects 19 different patterns, takes fibonacci projections as seriously as you do, displays the Potential Reversal Zone (PRZ) and finds suitable stop-loss and take-profit levels. [ Installation Guide | Update Guide | Troubleshooting | FAQ | All Products ] It detects 19 different harmonic pric
Step into the world of Forex trading with confidence, clarity, and precision using   Gold Indicator   a next-generation tool engineered to take your trading performance to the next level. Whether you’re a seasoned professional or just beginning your journey in the currency markets, Gold Indicator equips you with powerful insights and help you trade smarter, not harder. Built on the proven synergy of three advanced indicators, Gold Indicator focuses exclusively on medium and long-term trends eli
Harmonic Pattern Plus MT4
Young Ho Seo
4.44 (18)
Introduction Harmonic Patterns are best used to predict potential turning point. Traditionally, Harmonic Pattern was identified manually connecting peaks and troughs points in the chart. Manual harmonic pattern detection is painfully tedious and not suitable for everyone. You are often exposed under subjective pattern identification with manual pattern detection. To avoid these limitations, Harmonic Pattern Plus was designed to automate your harmonic pattern detection process. The functionality
Pips Stalker
Abdulkarim Karazon
5 (2)
핍스 스토커는 롱 숏 화살표 유형의 지표로, 모든 수준의 트레이더들이 더 나은 시장 결정을 내릴 수 있도록 돕습니다. 이 지표는 절대 재도색되지 않고 RSI를 주요 신호 로직으로 사용합니다. 화살표가 주어지면 절대 다시 도색되거나 다시 도색되지 않고, 화살표 지연도 없습니다. PIPS STALKER ARROW의 특징 : 통계 패널 전체 승률 %와 연속 최대 승리 및 패배 거래 등 유용한 통계, 그리고 기타 유용한 정보를 보여주는 독특한 정보 대시보드입니다. TP와 SL, 내장된 자금 관리 이 지표는 각 화살표마다 TP와 SL 객체를 제공하므로, 거래자는 자금 및 위험 관리를 내장하고 있으며, SL은 ATR을 기반으로 하며, TP는 현재 ATR SL 가치를 기반으로 한 위험 대비 보상 비율을 기반으로 합니다. 재도색 없음, 높은 조정 가능성 이 인디케이터는 신호 품질 개선을 위한 다양한 옵션을 제공하여 어떤 쌍에서도 약간의 기간 조정만으로 작동하며, 패널은 현재 설정과 기간이 수
Meravith
Ivan Stefanov
5 (3)
마켓 메이커를 위한 도구. Meravith는 다음과 같은 기능을 제공합니다: 모든 타임프레임을 분석하고 현재 유효한 추세를 표시합니다. 강세와 약세 거래량이 동일한 유동성 구간(거래량 균형 구간)을 강조 표시합니다. 서로 다른 타임프레임의 모든 유동성 레벨을 차트에 직접 표시합니다. 텍스트 기반 시장 분석을 생성하여 참고용으로 제공합니다. 현재 추세를 기반으로 목표가, 지지선 및 손절가를 계산합니다. 거래의 위험 대비 보상 비율(Risk/Reward)을 계산합니다. 계좌 잔고에 따라 포지션 크기를 산출하고 잠재 수익을 추정합니다. 시장에 중대한 변화가 발생할 경우 경고도 제공합니다. 지표의 주요 라인: 강세/약세 거래량 소진 라인 — 목표가로 사용됩니다. 시장 추세를 나타내는 라인. 시장이 강세인지 약세인지에 따라 색상이 변경되며 추세 지지선 역할을 합니다. 색상은 주로 시장 심리를 보여줍니다. 거래량 균형선(Eq). Eq(Volume Equilibrium) 라인은 시스템의 핵심입니
Scalper Vault
Oleg Rodin
5 (36)
Scalper Vault 는 성공적인 스캘핑에 필요한 모든 것을 제공하는 전문 스캘핑 시스템입니다. 이 표시기는 외환 및 바이너리 옵션 거래자가 사용할 수 있는 완전한 거래 시스템입니다. 권장 시간 프레임은 M5입니다. 시스템은 추세 방향으로 정확한 화살표 신호를 제공합니다. 또한 상단 및 하단 신호와 Gann 시장 수준을 제공합니다.  이 시스템은 사용하기가 매우 쉽습니다. 원하는 시장 지역의 화살표만 따라가면 됩니다. 엑시트는 가격이 적정 수준에 도달하거나 시장의 고점 또는 저점 신호가 나타날 때 수행됩니다.  표시기는 PUSH 알림을 포함한 모든 유형의 경고를 제공합니다. 인디케이터 구매 후 연락주세요. 내 개인 거래 권장 사항과 훌륭한 보너스 지표를 무료로 공유합니다! 나는 당신에게 행복하고 유익한 거래를 기원합니다!
Owl smart levels
Sergey Ermolov
4.26 (38)
MT5 버전  |   FAQ Owl Smart Levels Indicator 는   Bill Williams 의 고급 프랙탈, 시장의 올바른 파동 구조를 구축하는 Valable ZigZag, 정확한 진입 수준을 표시하는 피보나치 수준과 같은 인기 있는 시장 분석 도구를 포함하는 하나의 지표 내에서 완전한 거래 시스템입니다. 시장과 이익을 취하는 장소로. 전략에 대한 자세한 설명 표시기 작업에 대한 지침 고문-거래 올빼미 도우미의 조수 개인 사용자 채팅 ->구입 후 나에게 쓰기,나는 개인 채팅에 당신을 추가하고 거기에 모든 보너스를 다운로드 할 수 있습니다 힘은 단순함에 있습니다! Owl Smart Levels   거래 시스템은 사용하기 매우 쉽기 때문에 전문가와 이제 막 시장을 연구하고 스스로 거래 전략을 선택하기 시작한 사람들 모두에게 적합합니다. 전략 및 지표에는 눈에 보이지 않는 비밀 공식 및 계산 방법이 없으며 모든 전략 지표는 공개되어 있습니다. Owl Smart Leve
Apollo Secret Trend
Oleg Rodin
5 (8)
Apollo Secret Trend는 모든 쌍과 시간대의 추세를 찾는 데 사용할 수 있는 전문적인 추세 지표입니다. 지표는 거래를 선호하는 쌍이나 기간에 관계없이 시장 동향을 감지하는 데 사용할 수 있는 주요 거래 지표가 될 수 있습니다. 표시기의 특수 매개변수를 사용하여 개인 거래 스타일에 맞게 신호를 조정할 수 있습니다. 표시기는 PUSH 알림을 포함한 모든 유형의 경고를 제공합니다. 표시기의 신호는 다시 칠하지 마십시오! 제공된 스크린샷에서 과매수/과매도 오실레이터 표시기와 함께 Apollo Secret Trend 표시기를 볼 수 있습니다. 이 표시기는 제가 절대적으로 무료로 제공합니다. 구매 후 두 번째 과매수 및 과매도 오실레이터 표시기를 무료로 받으려면 저에게 연락하십시오! 또한 시스템 사용 방법에 대한 지침도 제공합니다. 나는 또한 당신에게 큰 보너스를 공유 할 것입니다!
제작자의 제품 더 보기
Auto Fibo Retracement MT5
Nguyen Tuan Son
5 (10)
Auto Fibonacci Retracement Indicator — Flexible and Reliable This isn’t just another Auto Fibonacci Retracement indicator. It’s one of the most flexible and dependable tools available . If you find it useful, please consider leaving a review or comment — your feedback means a lot! Check out my other helpful tools below: Smart Alert Manager   - Set up advanced alerts and send them to Mobile, Telegram, Discord, Webhook... Timeframes Trend Scanner    - Scan the trend of assets in difference timefr
FREE
What Is the Currency Strength Meter? The Currency Strength Meter is an advanced yet easy-to-use indicator that measures the relative strength of 8 major currencies by analyzing their real-time performance across 28 currency pairs . It visually ranks currencies from strongest to weakest, helping you: Spot high-probability trading opportunities Match strong currencies against weak ones Trade with confidence and precision With just a glance at the dashboard, you'll know which currencies to trade –
Easy Toolbar MT5
Nguyen Tuan Son
5 (1)
Easy Toolbar is a user-friendly toolkit that provides fundamental tools and utilities which can helps you analyze market , get notifications and calculate trade factors faster, more accurate and much easier. Easy Toolbar is born with the mission to make analysis tools of MT5 really work & provide more useful utilities . If you are not fully depend on EAs and do your own work to analyze market, this tool is for you! Main features New way to use market analysis tools Introduce new important object
What Is the Currency Strength Meter? The Currency Strength Meter is an advanced yet easy-to-use indicator that measures the relative strength of 8 major currencies by analyzing their real-time performance across 28 currency pairs . It visually ranks currencies from strongest to weakest, helping you: Spot high-probability trading opportunities Match strong currencies against weak ones Trade with confidence and precision With just a glance at the dashboard, you'll know which currencies to trade –
Create custom alerts and advanced alerts based on price and indicator data, setup dynamic alert messages, and send these MT5 alerts to Telegram, Discord, webhooks, mobile, and more. Stay in control of your trades with Smart Alert Manager , a powerful utility for MT5 that lets you create fully customizable alerts. Whether you’re tracking price action or monitoring indicator signals, this tool ensures you never miss an opportunity. It’s easy to set up, flexible to customize, and sending alerts acr
Easy Toolbar MT4
Nguyen Tuan Son
5 (1)
Easy Toolbar is a user-friendly toolkit that provides fundamental tools and utilities which can helps you analyze market , get notifications and calculate trade factors faster, more accurate and much easier. Easy Toolbar is born with the mission to make analysis tools of MT4 really work & provide more useful utilities . If you are not fully depend on EAs and do your own work to analyze market, this tool is for you! Main features New way to use market analysis tools Introduce new important object
Market Trend Scanner   is a trend analyzer or trend screener indicator that helps you know the trend in   selected timeframe of all symbols you're watching . This indicator provides clear & detailed analysis results on a beautiful dashboard, let you able to use this result right away without need   to do any additional analysis. How it works Step 1: Calculate values of 23 selected & trusted technical indicators (Oscillator & Moving Average indicators) Step 2: Analyze all indicators using best pr
Timeframes Trend Scanner is a trend analyzer or trend screener indicator that helps you know the trend in all timeframes of selected symbol you are watching . This indicator provides clear & detailed analysis results on a beautiful dashboard, let you able to use this result right away without need to do any additional analysis. How it works Step 1: Calculate values of 23 selected & trusted technical indicators (Oscillator & Moving Average indicators) Step 2: Analyze all indicators using best pra
Market Trend Scanner   is a trend analyzer or trend screener indicator that helps you know the trend in   selected timeframe of all symbols you're watching . This indicator provides clear & detailed analysis results on a beautiful dashboard, let you able to use this result right away without need to do any additional analysis. How it works Step 1: Calculate values of 23 selected & trusted technical indicators (Oscillator & Moving Average indicators) Step 2: Analyze all indicators using best prac
Timeframes Trend Scanner   is a trend analyzer or trend screener indicator that helps you know the trend in   all timeframes of selected symbol you are watching . This indicator provides clear & detailed analysis results on a beautiful dashboard, let you able to use this result right away without need to do any additional analysis. How it works Step 1: Calculate values of 23 selected & trusted technical indicators (Oscillator & Moving Average indicators) Step 2: Analyze all indicators using bes
필터:
yuriy224
84
yuriy224 2026.02.21 10:50 
 

Строит фибо не там где я хочу, а там, где он хочет, не понравился.

david cruz
18
david cruz 2025.07.08 22:34 
 

Excelente herramienta

Alfon45
209
Alfon45 2024.08.25 16:25 
 

Good work !!

Hector Manuel
446
Hector Manuel 2024.04.08 23:40 
 

Cuando se coloca 2000 barras atrás para analizar, el indicador no muestras las barras reales, sino muestra menos barras.

prayadc chotipat
18
prayadc chotipat 2024.03.26 10:22 
 

사용자가 평가에 대한 코멘트를 남기지 않았습니다

리뷰 답변