PipsZenith SM Swing

📌 PipsZenith Smart Money Swing (SMC) Indicator v1.0

🚀 Bring Institutional Trading Power to Your MT4 Charts

The PipsZenith Smart Money Swing (SMC) Indicator is a cutting-edge trading tool designed for professional traders who want to trade Smart Money Concepts (SMC) directly in MetaTrader 4.
It combines market structure analysis, order block detection, liquidity mapping, and imbalance zones into a single, powerful and fully customizable indicator.

This is not just another repainting arrow tool — this is a true institutional-style framework for traders who want accuracy, clarity, and confidence in their trading decisions.

✨ Key Features

Market Structure Detection

  • Automatic detection of swing highs/lows, BOS (Break of Structure), and CHoCH (Change of Character).

  • Non-repainting structure mapping for reliable signals.

Order Block (OB) Zones

  • Detects both bullish and bearish order blocks in real-time.

  • Drawn as customizable zones with optional alerts when price revisits them.

Liquidity Pools

  • Highlights equal highs/lows where liquidity is resting.

  • Helps identify stop hunts and sweep opportunities.

Fair Value Gaps (FVG)

  • Marks imbalance zones where price is likely to retrace.

  • Fully customizable colors, styles, and display options.

Non-Repainting Swing Signals

  • Arrows on chart when a valid SMC trade setup occurs (OB + BOS confluence).

  • Works in real-time with no back-painting.
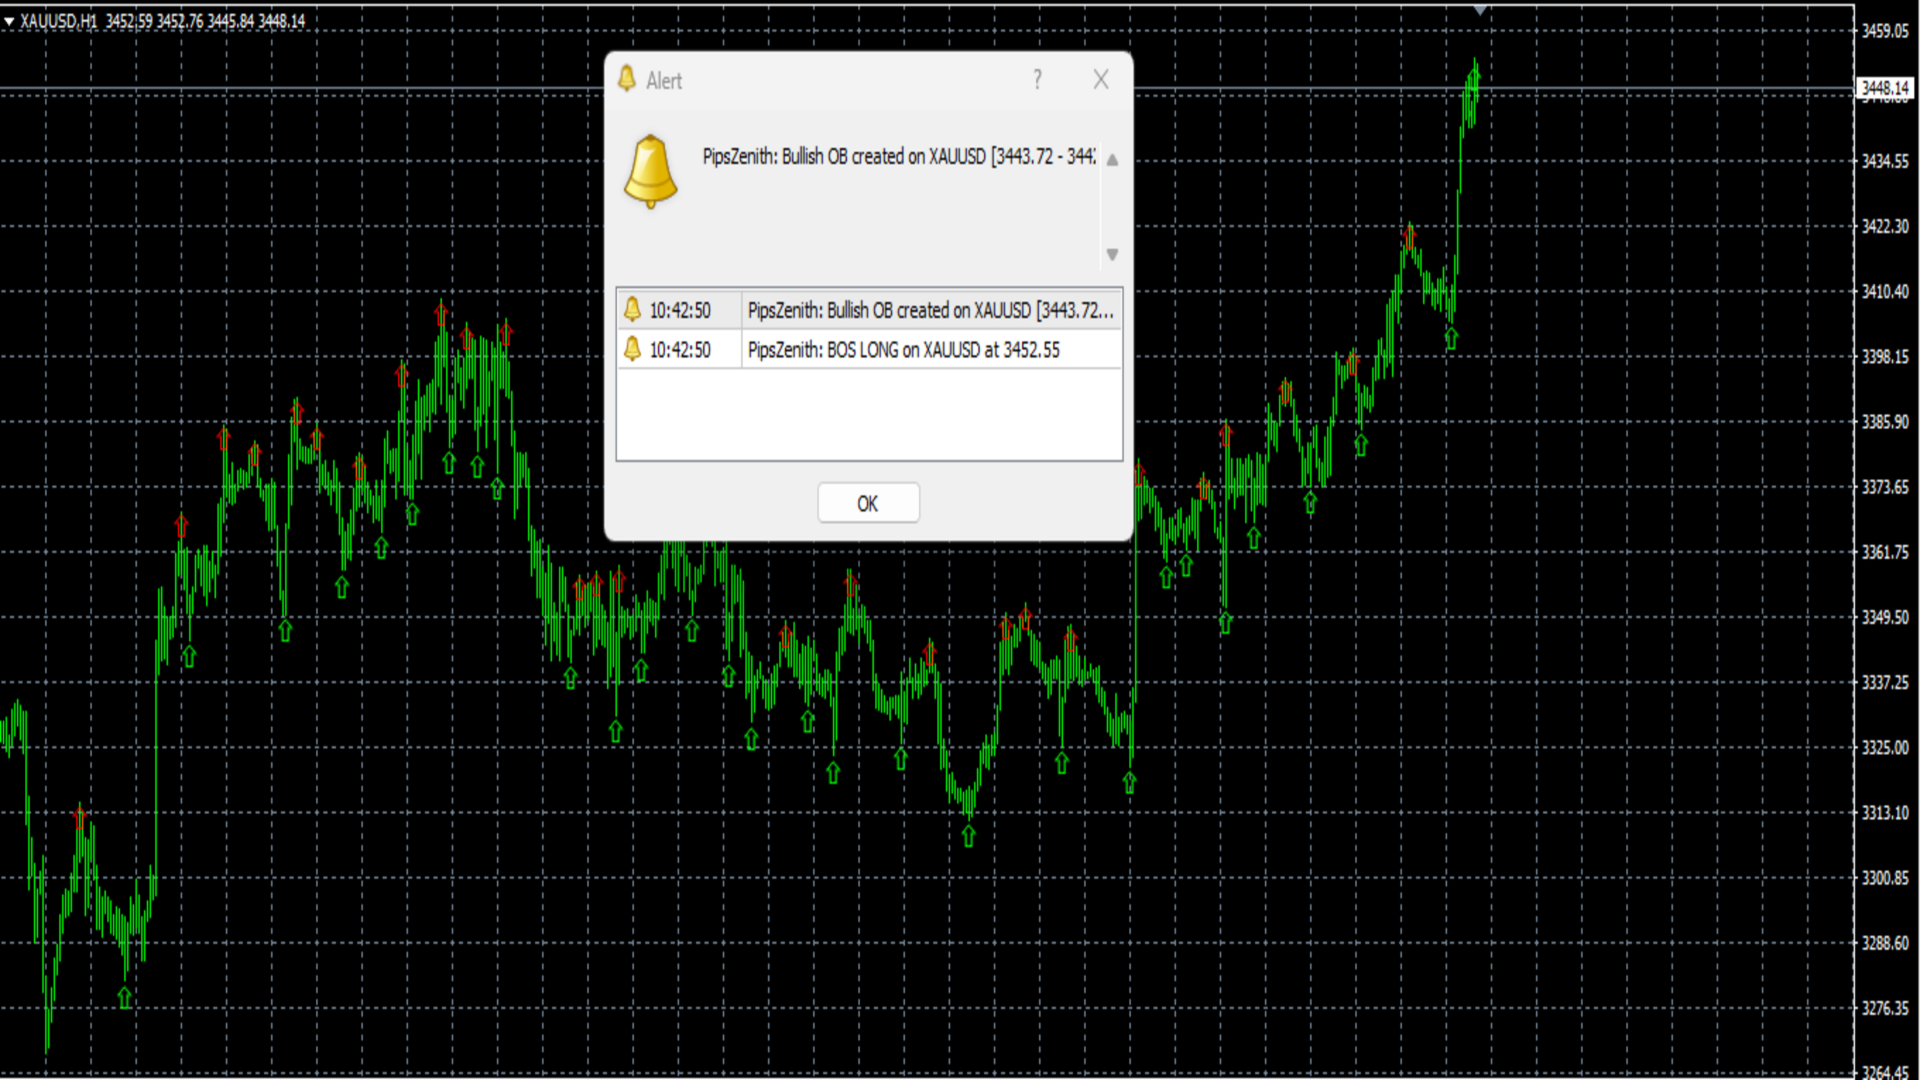
Professional Alerts (No Annoying Popups 🚫)

  • Choose between pop-up, sound, email, or push notifications.

  • All alerts are user-controlled and can be disabled with a single click.

Full Customization

  • Change colors, zone transparencies, swing sensitivity, and alert types.

  • Adaptable to any trading style: scalping, day trading, or swing trading.

🧠 Why Smart Money Concepts?

Most retail indicators lag and confuse traders. Smart Money Concepts (SMC) are the same methods used by institutional traders:

  • Market structure → defines direction.

  • Order blocks → show where big players enter.

  • Liquidity zones → reveal stop hunts.

  • Imbalances → act as magnets for price.

The PipsZenith SMC Indicator puts all these concepts together, saving you hours of manual charting and giving you a clean, professional trading edge.

⚙️ Inputs & Customization

  • Swing Period → adjust sensitivity of highs/lows.

  • Order Block Display → on/off, color, transparency.

  • Liquidity Zones → enable/disable, thickness, color.

  • Fair Value Gaps → enable/disable, styling options.

  • Alerts → enable/disable, choose type (popup, push, sound, email).

  • Max Lookback Bars → optimize performance for your PC.

Everything is fully customizable to your preferences.

📊 Best Use Cases

  • Swing Trading on H1–H4

  • Intraday setups on M15–M30

  • Works on Forex, Gold, Indices, and Crypto

🎯 Why Choose PipsZenith SMC?

✔️ Non-repainting, reliable signals
✔️ No clutter, no confusion — clean professional charts
✔️ Designed with traders in mind: customizable & intuitive
✔️ Institutional trading framework simplified for MT4
✔️ Created by PipsZenith brand — trusted for premium tools

🔔 Important

  • This is an indicator, not an EA. It does not place trades automatically.

  • Works best with proper risk management and trading plan.

  • Supports all MT4 brokers, symbols, and account types.

🚀 Take Your Trading to the Next Level

The PipsZenith Smart Money Swing Indicator is your edge in today’s market.
No more guessing, no more repainting tools — just clear institutional levels and signals.

👉 Add it to your chart today and trade with the confidence of Smart Money!

Brand: PipsZenith
📌 Version: 1.0
📌 Platform: MetaTrader 4
📌 Category: Indicators → Smart Money Concepts


추천 제품
Absolute Bands
Aleksey Ivanov
4.67 (3)
Principles of construction of the indicator.               The Absolute Bands (AB) indicator is reminiscent of the Bollinger Bands indicator with its appearance and functions, but only more effective for trading due to the significantly smaller number of false signals issued to them. This effectiveness of the Absolute Bands indicator is due to its robust nature.               In the Bollinger Bands indicator, on both sides of the moving average - Ma, there are lines spaced from Ma by the standa
FREE
Price pivot points H1 - an indicator that shows price pivot points on the H1 timeframe with an accuracy of up to 95%. 95 signals from 100 will accurately indicate the place of the price reversal in the opposite direction. The indicator does not redraw its values. Suitable for trading on any currency pair. It can be used for both intraday scalping and long-term trading. Price pivot points H1 shows signals as arrows. When the price reverses, the indicator will draw an arrow on the chart. If the p
GTAS STrend
Riviera Systems
4.5 (2)
GTAS S-Trend is a momentum indicator that helps to determine trends using combination of MACD, RSI and moving averages. This indicator was created by Bernard Prats Desclaux, proprietary trader and ex-hedge fund manager, founder of E-Winvest. Description The indicator oscillates between -65 and +65 with a neutral zone between -25 and +25 around a 0 equilibrium line. S-Trend between -25 and +25 indicates congestion zones with a bullish bias between 0 and +25, and a bearish bias between 0 and -25.
FREE
Division
Svyatoslav Kucher
Определения текущей тенденции одна из самых важных задач трейдера не зависимо от стиля торговли. Индикатор Division  поможет с достаточно высокой вероятностью это сделать. Division  - индикатор распознавания тенденции, использующий в качестве источника данных подобие скользящих средних, в расчете которых используются объемы. От этих средних строятся границы, которые служат сигнализатором для смены текущей тенденции. Показания индикатора не изменяются не при каких условиях.  При желании можно вкл
자동 최적화 볼린저 밴드 – 실제 시장 움직임에 기반한 적응형 변동성 도구 자동 최적화 볼린저 밴드는 과거 거래 시뮬레이션을 통해 최적의 기간과 표준 편차 값을 자동으로 찾아내는 MT4용 고급 지표입니다. 고정 설정에 의존하지 않고 시장 변화와 가격 구조에 동적으로 적응하여 실시간으로 변동성을 보다 정확하게 반영하는 밴드를 생성합니다. 수동 조정이 필요 없습니다. 주요 기능: 과거 데이터 기반 볼린저 밴드 매개변수 자동 최적화 중요한 전환점에 매수 및 매도 신호 화살표 표시 사운드, 팝업, 푸시 알림 내장 최적화 깊이, 표시 및 신호 설정 조절 가능 외환, 금, 지수, 암호화폐 등 다양한 자산에 적합 데이 트레이딩과 스윙 트레이딩에 이상적이며, 기존의 고정형 지표보다 더 스마트한 변동성 분석을 제공합니다. ...
Non Repaint EMA crossover
Sufiyan Anwar Bhanji
PLEASE NOTE:   You can  customize the settings of all 3 EMA as per your requirement. The accuracy will change as per your settings. 100% Non repaint Pre-alert (get ready) signals Non-delay indications 24/7 signals 100% No lag No recalculating Lifetime license This is a EMA crossover indicator and its 100% non repaint indicator. The EMA_1 and the EMA_2 is based on which signal is generated. EMA_3 is a Higher EMA value which will remain below or above the candle (market) to identify the trend. Me
Multi Trendlines
Robert Walker
5 (7)
The Multi Trendlines indicator automatically draws the dominant trendlines on the current chart. The indicator looks for the 5 best Up trends and the 5 best Down trends as at the current price, drawing each trendline if filter conditions are met. The trendlines are named "Trendline"+[Direction]+Symbol()+TrendlineSequenceNumber For example: The second Up trendline on a EURUSD chart would be named "TrendlineUpEURUSD2".   To get its current value would be: ObjectGet("TrendlineUpEURUSD2",OBJPROP_PRI
FREE
Pro SuperTrends
Pankaj Prasade
Dear traders! This indicator   automatically plots SuperTrends across 3 timeframes. SuperTrend is a trend following indicator. However, it is not much useful on single timeframe, as that gives many whipsaws. Professionals analysis  across multi timeframes before taking trades.  This adds confluence to trade setups.For the same purpose, Pro SuperTrends shows trend (or absence of trend) on 3 timeframes. Our trading odds improve, when positions are aligned with higher timeframes. Further, SuperTren
FTU idioteg i jipyoneun MT4 peullaespom-yong-imyeo dandog-eulo sayonghal su issjiman daleun jipyo ttoneun jeonlyaggwa gyeolhabhaneun geos-i gajang johseubnida. macd, adx deung dayanghan jipyoleul gyeolhabhayeo jin-ib ttoneun chuse byeonhwa jean-eul wihan hwasalpyo geuligi YouTubeeseo jjalb-eun sogae bidioleul sicheonghaseyo: https://youtu.be/lCRJ3mFNyOQ pyosigi gineung: panmae mich gumae hwasalpyo sigag mich cheong-gag gyeong-go chuse jisog / chogi chuse byeonhwa sinho saeloun gineung: gilog ma
FREE
Coloured Bollinger Bands
Moegamat Luqmaan Titus
Coloured Bollinger Bands The Coloured Bollinger Bands indicator is an enhanced version of the standard Bollinger Bands, offering customizable features to suit your trading needs. It uses the classic Simple Moving Average (SMA) as the middle band, and allows you to easily change the appearance of the bands, including the option to select colors and line types, ensuring better visual clarity and adaptability on your charts
FREE
Auto Fibo Retracement MT4
Nguyen Tuan Son
3.67 (3)
Auto Fibonacci Retracement Indicator — Flexible and Reliable This is not just another Auto Fibonacci Retracement indicator — it’s one of the most flexible and dependable tools available . If you find it useful, please leave a review or comment to support the project. Check out my other helpful tools below: Timeframes Trend Scanner    - Scan the trend of assets in difference timeframes with multiple indicators Market Trend Scanner   - Scan the trend of multiple-assets in with multiple indicators
FREE
Bollinger Bands MT4
Tatiana Savkevych
Bollinger Bands (BB) are similar to Envelopes. The difference between them is that the boundaries of the Trade Bands (Envelopes) are located above and below the moving average curve at a fixed percentage distance, while the Bollinger Bands are plotted at distances equal to a certain number of standard deviations. Since the magnitude of the standard deviation depends on volatility, the bands themselves adjust their width: it increases when the market is unstable, and decreases in more stable per
5/35 Oscillator to be used with our Elliott Wave Indicator as part of the overall strategy on trading the 5th wave. The Elliott Wave Indicator Suite is designed around a simple but effective Swing Trading Strategy. The Indicator Suite is great for Stocks, Futures and Forex trading on multiple timeframes You can find the main Elliott Wave Indicator here  https://www.mql5.com/en/market/product/44034
FREE
Rainbow MT4
Jamal El Alama
Rainbow MT4 is a technical indicator based on Moving average with period 34 and very easy to use. When price crosses above MA and MA changes color to green, it’s a signal to buy. When price crosses below MA and MA changes color to red, it’s a signal to sell. The Expert advisor ( Rainbow EA MT4) based on Rainbow MT4 indicator, as you can see in the short video below is now available here .
FREE
Raymond Cloudy Day Indicator for MT4 – Pivot-Based Reversal and Trend Levels Raymond Cloudy Day Indicator is a pivot-based level indicator for MetaTrader 4 (MT4). It was developed by Ngo The Hung based on Raymond’s original idea and is designed to give a structured view of potential reversal zones, trend extensions and support/resistance levels directly on the chart. The default settings are optimised for XAUUSD on the H1 timeframe, but the indicator can be tested and adjusted for other symbols
Better Moving Average
Vincent Jose Proenca
STRUCTURAL TREND LINES - MT4 Indicator Simple indicator that automatically draws trend lines based on market structure. Features: - 3 degrees of structure detection (short, medium, long term) - Configurable swing strength for each degree - Single color per degree for clean visualization - Adjustable number of lines per degree - Customizable colors and line widths How it works: The indicator identifies swing highs and lows based on the strength parameter, then connects these points to create t
FREE
Binary Option Signal
Yaroslav Varankin
Indicator for binary options arrow is easy to use and does not require configuration works on all currency pairs, cryptocurrencies buy signal blue up arrow sell signal red down arrow tips do not trade during news and 15-30 minutes before their release, as the market is too volatile and there is a lot of noise it is worth entering trades one or two candles from the current period (recommended for 1 candle) timeframe up to m 15 recommended money management fixed lot or fixed percentage of the depo
Based on MACD indicator waves with standard parameters Applies Fibonacci levels to the last two MACD waves, positive and negative respectively, if at the moment the MACD indicator runs out of negative Wave - the color is green, if at the moment the MACD indicator runs out of positive Wave - the color is red. The Wave termination criterion is two ticks with a different MACD sign. Applies trend lines on the last four MACD Waves. Works well with the expert Figures MACD   https://www.mql5.com/ru/mar
VR Pivot
Vladimir Pastushak
VR Pivot is an indicator of key pivot points. Pivot points are a special type of support and resistance levels that are used to determine the strongest price zones. Professional traders use pivot levels to determine prices at which there is a high probability of a price reversal. The levels are calculated using special mathematical formulas, which include the closing, opening, high, and low prices of the previous time period. The most effective is the daily period. It is important to note that a
Automatic Fibonacci  is an indicator for automatic Fibonacci Levels drawing. It is fully customizable by user. User can also select different Fibobonacci Levels by user settings or can use multiple Automatic Fibonacci indicator in one chart. All details can be found >>HERE<< Instructions Move Indicator to the chart (simply drag and drop) When pop up window appears select desired settings. Confirm settings and enjoy the Automatic Fibonacci indicator. Features Any chart Any time-frame Custom
Email Drawdown Alert
Roman Starostin
5 (12)
Free informative Indicator-helper. It'll be usefull for traders who trade many symbols or using grid systems (Averaging or Martingale). Indicator counts drawdown as percent and currency separate. It has a number of settings: Count deposite drawdown according equity value and send e-mail or notifications to user if DD more than set; Sending e-mail when max open orders reached; Shows price and remaining pips amount before MarginCall on current chart and Account generally; Display summary trade lot
FREE
Didi Index indicator with visual buy and sell alert, with confirmation alert. Buy or sell alerts, on screen and for mobile phones, with a visual description in colors of the direction on the screen! A warning in the color of the current direction of the graph on the screen quickly informs you if the pair is bought or sold by Didi Index. With configurable text position and size, making it easier to follow the trend of the pair.
FREE
"돈키안 채널 예측" 표시기를 사용하면 현재 가격 위치를 기반으로 미래의 돈키안 채널 수준의 변화를 예측할 수 있습니다. 표준 Zig-Zag 표시기는 반대쪽 Donchian 채널에 닿을 때 99%에서 광선을 그리기 시작합니다. 채널 경계 수준의 예측은 이러한 이벤트가 얼마나 빨리 발생할 수 있는지 추정하기 위해 수정의 끝점 또는 추세 변경 지점을 찾는 데 도움이 됩니다. ................................................................................................................ 설정 기간 - Donchian 채널을 계산하는 기간입니다. 권장 값은 12~240입니다. ................................................................................................................
Donchian Channels
Marco vd Heijden
The Legendary Donchian Channel Indicator. This is the indicator that Richard Dennis used in the famous turtle experiment where he showed that anybody can become a successful trader by practice.  Some techniques are older then MetaTrader itself. In fact we were unable to find a color picture of Mr. Donchian himself, for use as the product icon for this indicator. We had to artificially colorize an old black and white picture of the genius. But it is okay because he is smiling at us and now you ar
MACD Trend Break
Manoj Kumar Sharma
고급 추세 필터링 및 경고 표시 기능이 있는 MACD 오실레이터. 추세를 결정하고 약한 추세는 걸러지고 추세의 새로운 강점이 표시됩니다. MACD 오실레이터는 모든 시간대와 모든 기호(통화, 지수, 오일, 금속, 주식, 옵션, 오프라인 renko 차트)에서 작동합니다. 1. 사용자는 MACD 값을 변경할 수 있습니다. 2. 최소 MACD 레벨 필터, 3. 나누기 값은 차트에서 추세 변경 표시가 필요한 검정력 비율을 필터링합니다. 4. 버퍼 값에는 추세가 변경된 후 경고 신호를 보내기 위해 추가 Macd 값 이동을 제공하는 추가 필터가 있습니다. 5. 경고 추가 메시지 팝업에 대해 True 또는 False를 선택할 수 있습니다. 이 버전은 모든 차트에서 MACD의 다양한 레벨 확인을 사용하여 추세가 변경되는 거래 진입 신호용입니다. 거래 종료의 경우 사용자는 필요에 따라 거래 종료를 위해 자신의 후행 손절매를 사용할 수 있습니다. 권장되는 차트 기간은 H1, H4, D1 및 renk
Super trend scalping is a set of five Stochastics on different currency pairs in one window. Designed to determine the strength and direction of the trend, as well as to search for price reversal points. Using this indicator, you can simultaneously observe the correlation of 5 Stochastic indicators in one window. You can also determine the divergence of the stochastic and accurately find the entry points to the market. The indicator is suitable for working with any currency pairs and on any tim
DivergenceMRDM
Andriy Sydoruk
Индикатор DivergenceMRDM  ситуацию, когда направление движения цены и технических индикаторов не совпадает. Что можно воспринимать как точки для входа в рынок, точки потенциального разворота рынка. Чаще всего проявляется сигнал при достижении индикатором зоны перекупленности или перепроданности. Один из четырех индикаторов: MACD , RSI , ADX , Momentum . Готовая торговая система. Индикатор не перерисовывается и не запаздывает 95% сделок прибыльные. Работает на всех валютных парах и на всех таймфр
Squeeze Box
Sinan Durkan
**Squeeze Box Indicator**   Squeeze Box  is a powerful technical analysis indicator developed for the MetaTrader 4 platform, designed to support day trading strategies. This indicator analyzes market movements to detect bullish and bearish breakout signals, enabling traders to capture trends early. With its customizable features and user-friendly interface, it is ideal for both novice and experienced traders. ### Features and Functions - **Bullish and Bearish Signals**: Identifies market break
FREE
Smoothed Supertrend 지표 - 변동성 기반 추세 지표와 평활화 기능 Smoothed Supertrend 지표는 MetaTrader 4 용 클래식 Supertrend 지표의 향상된 버전입니다. 추가 평활화 기능을 통합하여 시장 노이즈를 줄이고 추세 신호의 품질을 향상시킵니다. 기술 설명: 이 지표는 시장 변동성을 측정하기 위한 Average True Range(ATR)를 기반으로 하며, 가격 데이터의 이동 평균 평활화와 결합합니다. 결과 라인은 현재 추세 방향을 표시하고 변동성 변화에 동적으로 적응합니다. 계산 방법: 가격의 이동 평균(MA) 계산 N개 기간에 걸친 Average True Range(ATR) 계산 상하단 밴드 계산: 상단 밴드 = MA + (ATR × 승수) 하단 밴드 = MA - (ATR × 승수) 밴드에 대한 종가 위치를 기반으로 한 추세 결정 단계 로직: 라인은 추세 반전 시에만 변경 입력 매개변수: ATR_Period(기본값: 10) - ATR 계
FREE
Classic Fractals indicator for MT4, with additional Trendlines connecting the latest couples of fractals ( fractals are showing highest high, and lowest low on each period) Rules for trendlines: -if new top fractal is below the last one = new resistance line -if new bot fractal is above the last one = new support line -Trendlines can be hidden -Fractals can be hidden Fractal Period = can be both even or uneven number, as it is setting for half (one side) of the bars sequence for findin
이 제품의 구매자들이 또한 구매함
Gann Made Easy
Oleg Rodin
4.83 (153)
Gann Made Easy 는 mr.의 이론을 사용하여 최고의 거래 원칙을 기반으로 하는 전문적이고 사용하기 쉬운 Forex 거래 시스템입니다. W.D. 간. 이 표시기는 Stop Loss 및 Take Profit Levels를 포함하여 정확한 BUY 및 SELL 신호를 제공합니다. PUSH 알림을 사용하여 이동 중에도 거래할 수 있습니다. 거래 팁, 보너스, GANN MADE EA를 무료로 받으시려면 구매 후 저에게 연락주세요! 아마도 Gann 거래 방법에 대해 이미 여러 번 들었을 것입니다. 일반적으로 Gann의 이론은 초보자 거래자뿐만 아니라 이미 거래 경험이 있는 사람들에게도 매우 복잡한 것입니다. Gann의 거래 방식은 이론적으로 적용하기 쉽지 않기 때문입니다. 나는 그 지식을 연마하고 Forex 지표에 최고의 원칙을 적용하기 위해 몇 년을 보냈습니다. 표시기는 적용하기가 매우 쉽습니다. 차트에 첨부하고 간단한 거래 권장 사항을 따르기만 하면 됩니다. 지표는 지속적으로 시장
Pulse Scalping Line - an indicator for identifying potential pivot points. Based on this indicator, you can build an effective Martingale system. According to our statistics, the indicator gives a maximum of 4 erroneous pivot points in a series. On average, these are 2 pivot points. That is, the indicator shows a reversal, it is erroneous. This means that the second signal of the indicator will be highly accurate. Based on this information, you can build a trading system based on the Martingale
Gold Signal Pro
Mohamed Hassan
First 25 copies at $80, after that price becomes $149 (3 copies left) Gold Signal Pro is a powerful MT4 indicator designed to help traders spot strong price reactions in the market. It focuses on clear wick rejections , showing when price strongly rejects a level and often continues in the same direction. Gold Signal Pro is mainly built for scalping gold (XAUUSD) and works best on lower timeframes like M5 and M15 , where timing matters most. That said, it can also be used on any forex pair, a
현재 20% 할인 ! 초보자 또는 전문가 트레이더를 위한 최고의 솔루션! 이 대시보드 소프트웨어는 28개의 통화 쌍에서 작동합니다. 2가지 주요 지표(Advanced Currency Strength 28 및 Advanced Currency Impulse)를 기반으로 합니다. 전체 Forex 시장에 대한 훌륭한 개요를 제공합니다. 고급 통화 강도 값, 통화 이동 속도 및 모든(9) 시간대의 28 Forex 쌍에 대한 신호를 보여줍니다. 추세 및/또는 스캘핑 기회를 정확히 파악하기 위해 차트의 단일 지표를 사용하여 전체 시장을 볼 수 있을 때 거래가 어떻게 개선될지 상상해 보십시오! 잠재적인 거래를 식별하고 확인하면서 강력한 통화와 약한 통화를 더욱 쉽게 식별할 수 있도록 이 지표에 기능을 내장했습니다. 이 표시기는 통화의 강세 또는 약세가 증가 또는 감소하는지 여부와 모든 시간대에서 수행되는 방식을 그래픽으로 보여줍니다. 추가된 새로운 기능은 현재 시장 조건 변화에 적응하는
Smc Blast Signal
Mohit Dhariwal
5 (3)
NEW YEAR 2026 SALE OFFER PRICE AT JUST 75 DOLLARS FEW COPIES ONLY AT This price From 28th Jan -31th Jan MIDNIGHT Final offer GRAB YOUR COPY ON THIS New Year EVE last offer GRAB IT! Prices will be increased to 150 after the offer period ends Full Fledged EA and Alert plus for alerts will also be provided in this offer along with the purchase of Indicator. Limited copies only at this price and Ea too. Grab your copy soon Alert plus for indicator with set file is kept in comment section with the im
Scalper Inside PRO
Alexey Minkov
4.74 (69)
An exclusive indicator that utilizes an innovative algorithm to swiftly and accurately determine the market trend. The indicator automatically calculates opening, closing, and profit levels, providing detailed trading statistics. With these features, you can choose the most appropriate trading instrument for the current market conditions. Additionally, you can easily integrate your own arrow indicators into Scalper Inside Pro to quickly evaluate their statistics and profitability. Scalper Inside
Volatility Trend System - a trading system that gives signals for entries. The volatility system gives linear and point signals in the direction of the trend, as well as signals to exit it, without redrawing and delays. The trend indicator monitors the direction of the medium-term trend, shows the direction and its change. The signal indicator is based on changes in volatility and shows market entries. The indicator is equipped with several types of alerts. Can be applied to various trading ins
M1 Sniper
Oleg Rodin
4.89 (18)
M1 SNIPER 는 사용하기 쉬운 거래 지표 시스템입니다. M1 시간대에 맞춰 설계된 화살표 지표입니다. 이 지표는 M1 시간대 스캘핑을 위한 단독 시스템으로 사용할 수 있으며, 기존 거래 시스템의 일부로도 사용할 수 있습니다. 이 거래 시스템은 M1 시간대 거래용으로 특별히 설계되었지만, 다른 시간대에도 사용할 수 있습니다. 원래는 XAUUSD와 BTCUSD 거래를 위해 이 방법을 설계했지만, 다른 시장 거래에도 유용하다는 것을 알게 되었습니다. 이 지표의 신호는 추세 방향과 반대로 거래될 수 있습니다. 저는 지표의 신호를 활용하여 양방향으로 거래할 수 있도록 돕는 특별한 거래 기법을 알려드립니다. 이 방법은 특별한 동적 지지선과 저항선 가격 영역을 활용하는 것을 기반으로 합니다. 구매하시면 M1 SNIPER 화살표 지표를 바로 다운로드하실 수 있습니다. 또한, 아래 스크린샷에 표시된 Apollo Dynamic SR 지표는 M1 SNIPER 도구를 사용하는 모든 사용자에게 무료로
Trend indicator AI
Ramil Minniakhmetov
4.85 (78)
트렌드 인공 지능 지표는 실행 가능한 진입 점 및 반전 경고와 추세 식별을 결합하여 상인의 시장 분석을 향상시킬 훌륭한 도구입니다. 이 표시기는 사용자가 자신감과 정밀도로 외환 시장의 복잡성을 탐색 할 수 있도록 지원합니다 기본 신호 외에도 트렌드 인공 지능 지표는 풀백 또는 되돌림 중에 발생하는 2 차 진입 점을 식별하여 거래자가 기존 트렌드 내에서 가격 수정을 활용할 수 있도록합니다. 중요한 장점: ·작동 4 및 5 *명확한 구매 또는 판매 신호 *다시 칠하지 않습니다 *모든 자산에서 작동 나는 전보 사기에 개 또는 세트를 판매하지 않도록주의. 모든 설정은 블로그에 여기에 무료.  중요! 지침 및 보너스를 얻기 위해 구입 후 즉시 저에게 연락! 진짜 가동 감시는 뿐 아니라 나의 다른 제품 여기에서 찾아낼 수 있습니다: https://www.mql5.com/en/users/mechanic/seller&nbsp ; 설정 및 입력: 모든 자산에 대해 기본 설정을 권
Atomic Analyst
Issam Kassas
5 (3)
우선적으로 언급할 점은이 거래 지표가 다시 그리지 않고 지연되지 않으며 이를 통해 수동 및 로봇 거래 모두에 이상적이라는 점입니다. 사용자 매뉴얼: 설정, 입력 및 전략. Atomic Analyst는 가격의 강도와 모멘텀을 활용하여 시장에서 더 나은 이점을 찾는 PA Price Action Indicator입니다. 고급 필터를 장착하여 잡음과 거짓 신호를 제거하고 거래 잠재력을 높이는 데 도움이 됩니다. 복잡한 지표의 다중 레이어를 사용하여 Atomic Analyst는 차트를 스캔하고 복잡한 수학적 계산을 간단한 신호와 색상으로 변환하여 초보 트레이더가 이해하고 일관된 거래 결정을 내릴 수 있도록합니다. "Atomic Analyst"는 새로운 및 경험이 풍부한 트레이더를위한 종합적인 거래 솔루션입니다. 프리미엄 지표와 최고 수준의 기능을 하나의 거래 전략에 결합하여 모든 종류의 트레이더에 대한 다재다능한 선택지가되었습니다. 인트라데이 거래 및 스캘핑 전략 : 빠르고 정확한 일일
이 지표를 구매하면 제 프로페셔널 트레이드 매니저를 무료로 드립니다. 우선 이 거래 시스템이 리페인팅, 리드로잉 및 레이그 인디케이터가 아니라는 점을 강조하는 것이 중요합니다. 이는 수동 및 로봇 거래 모두에 이상적인 것으로 만듭니다. 온라인 강좌, 설명서 및 프리셋 다운로드. "스마트 트렌드 트레이딩 시스템 MT5"은 새로운 및 경험이 풍부한 트레이더를 위해 맞춤형으로 제작된 종합적인 거래 솔루션입니다. 10개 이상의 프리미엄 인디케이터를 결합하고 7개 이상의 견고한 거래 전략을 특징으로 하여 다양한 시장 조건에 대한 다목적 선택이 가능합니다. 트렌드 추종 전략: 효과적인 트렌드 추이를 타기 위한 정확한 진입 및 손절 관리를 제공합니다. 반전 전략: 잠재적인 트렌드 반전을 식별하여 트레이더가 범위 시장을 활용할 수 있게 합니다. 스캘핑 전략: 빠르고 정확한 데이 트레이딩 및 단기 거래를 위해 설계되었습니다. 안정성: 모든 인디케이터가 리페인팅, 리드로잉 및 레이그가 아니므로 신뢰
GOLD Impulse with Alert
Bernhard Schweigert
4.64 (11)
이 지표는 Advanced Currency IMPULSE with ALERT  +   Currency Strength Exotics  의 2가지 제품의 슈퍼 조합입니다. 그것은 모든 시간 프레임에 대해 작동하며 8개의 주요 통화와 하나의 기호에 대한 강약의 충동을 그래픽으로 보여줍니다! 이 표시기는 금, 이국적인 쌍, 상품, 지수 또는 선물과 같은 기호에 대한 통화 강도 가속을 표시하는 데 특화되어 있습니다. 금, 은, 오일, DAX, US30, MXN, TRY, CNH 등의 진정한 통화 강도 가속(충동 또는 속도)을 표시하기 위해 9번째 줄에 모든 기호를 추가할 수 있습니다. 새로운 기본 알고리즘을 기반으로 구축되어 잠재적인 거래를 훨씬 더 쉽게 식별하고 확인할 수 있습니다. 이는 통화의 강세 또는 약세가 가속되는지 여부를 그래픽으로 표시하고 가속 속도를 측정하기 때문입니다. 자동차의 속도계처럼 생각하면 됩니다. 가속화할 때 Forex 시장에서 동일한 일이 분명히 더 빠르
Trend Screener
STE S.S.COMPANY
4.79 (95)
트렌드 표시기, 트렌드 트레이딩 및 필터링을 위한 획기적인 고유 솔루션, 하나의 도구 안에 내장된 모든 중요한 트렌드 기능! Forex, 상품, 암호 화폐, 지수 및 주식과 같은 모든 기호/도구에 사용할 수 있는 100% 다시 칠하지 않는 다중 시간 프레임 및 다중 통화 표시기입니다. 기간 한정 특가: 지원 및 저항 스크리너 지표는 단 100달러에 평생 제공됩니다. (원래 가격 50 달러) (제안 연장) Trend Screener는 차트에 점이 있는 화살표 추세 신호를 제공하는 효율적인 지표 추세 추종 지표입니다. 추세 분석기 표시기에서 사용할 수 있는 기능: 1. 트렌드 스캐너. 2. 최대 이익 분석이 있는 추세선. 3. 추세 통화 강도 측정기. 4. 경고가 있는 추세 반전 점. 5. 경고가 있는 강력한 추세 점. 6. 추세 화살표 Trend Screener Indicator가 있는 일일 분석 예, 일일 신호 성능...등은 여기에서 찾을 수 있습니다.   여기를 클릭하십시오. L
Smart Price Action Concepts
Issam Kassas
4.75 (12)
우선적으로, 이 거래 도구는 전문적인 거래에 이상적인 비-다시 그리기 및 지연되지 않는 지표입니다.  온라인 강좌, 사용자 매뉴얼 및 데모. 스마트 가격 액션 컨셉트 인디케이터는 신규 및 경험 많은 트레이더 모두에게 매우 강력한 도구입니다. Inner Circle Trader Analysis 및 Smart Money Concepts Trading Strategies와 같은 고급 거래 아이디어를 결합하여 20가지 이상의 유용한 지표를 하나로 결합합니다. 이 인디케이터는 스마트 머니 컨셉트에 중점을 두어 대형 기관의 거래 방식을 제공하고 이동을 예측하는 데 도움을 줍니다.  특히 유동성 분석에 뛰어나 기관이 어떻게 거래하는지 이해하는 데 도움을 줍니다. 시장 트렌드를 예측하고 가격 변동을 신중하게 분석하는 데 탁월합니다. 귀하의 거래를 기관 전략에 맞추어 시장의 동향에 대해 더 정확한 예측을 할 수 있습니다. 이 인디케이터는 시장 구조를 분석하고 중요한 주문 블록을 식별하고 다양한
Currency Strength Wizard
Oleg Rodin
4.84 (55)
통화 강도 마법사는 성공적인 거래를 위한 올인원 솔루션을 제공하는 매우 강력한 지표입니다. 표시기는 여러 시간 프레임의 모든 통화 데이터를 사용하여 이 또는 해당 외환 쌍의 힘을 계산합니다. 이 데이터는 특정 통화의 힘을 확인하는 데 사용할 수 있는 사용하기 쉬운 통화 지수 및 통화 전력선의 형태로 표시됩니다. 필요한 것은 거래하려는 차트에 표시기를 부착하는 것뿐입니다. 표시기는 거래하는 통화의 실제 강세를 보여줍니다. 지표는 또한 추세와 거래할 때 유리하게 사용할 수 있는 구매 및 판매 거래량 압력의 극한값을 보여줍니다. 지표는 또한 피보나치에 기반한 가능한 대상을 보여줍니다. 표시기는 PUSH 알림을 포함한 모든 유형의 알림을 제공합니다. 구매 후 연락주세요. 나는 당신과 거래 팁을 공유하고 당신에게 무료로 훌륭한 보너스 지표를 줄 것입니다! 나는 당신에게 행복하고 유익한 거래를 기원합니다!
Miraculous Indicator – Gann Square of Nine 기반 100% 비리페인트 Forex 및 바이너리 도구 이 영상은 Miraculous Indicator 를 소개합니다. 이 지표는 Forex 및 바이너리 옵션 트레이더를 위해 특별히 개발된 매우 정확하고 강력한 트레이딩 도구입니다. 이 지표가 독특한 이유는 전설적인 **Gann Square of Nine(Gann 9의 사각형)**과 **Gann's Law of Vibration(Gann 진동의 법칙)**에 기반을 두고 있기 때문입니다. 이는 현대 트레이딩에서 가장 정밀한 예측 도구 중 하나로 손꼽힙니다. Miraculous Indicator는 완전히 비리페인트(non-repaint) 됩니다. 즉, 캔들이 마감된 후에도 신호가 변경되거나 사라지지 않습니다. 보이는 것이 곧 결과입니다. 이는 트레이더가 자신감을 가지고 거래에 진입하고 청산할 수 있는 신뢰할 수 있고 일관된 기반을 제공합니다. 주요 특징: Gann
Currency Strength Exotics
Bernhard Schweigert
4.88 (33)
현재 20% 할인! 초보자 또는 전문가 트레이더를 위한 최고의 솔루션! 이 표시기는 Exotic Pairs Commodities, Indexes 또는 Futures와 같은 기호에 대한 통화 강도를 표시하는 데 특화되어 있습니다. 금, 은, 석유, DAX, US30, MXN, TRY, CNH 등의 진정한 통화 강도를 보여주기 위해 9번째 줄에 모든 기호를 추가할 수 있습니다. 이것은 독특하고 고품질이며 저렴한 거래 도구입니다. 우리는 많은 독점 기능과 새로운 공식을 통합했습니다. 새로운 추세 또는 스캘핑 기회의 정확한 트리거 포인트를 정확히 찾아낼 수 있기 때문에 거래가 어떻게 개선될지 상상해 보십시오. 사용 설명서: 여기를 클릭 https://www.mql5.com/en/blogs/post/708876 모든 시간대에 작동합니다. TREND를 빠르게 확인할 수 있습니다! 새로운 기본 알고리즘을 기반으로 설계되어 잠재적인 거래를 더욱 쉽게 식별하고 확인할 수 있습니다. 8개의
RFI levels PRO
Roman Podpora
사전 지표       시장 반전 수준과 영역을 파악하여   가격이 해당 수준으로 되돌아올 때까지 기다렸다가 새로운 추세의 시작점에서 진입할 수 있도록 해줍니다. 즉, 추세의 끝에서 진입하는 것이 아닙니다. 그는 보여준다       반전 수준       시장이 방향 전환을 확인하고 추가적인 움직임을 형성하는 지점입니다. 이 지표는 차트를 다시 그릴 필요 없이 작동하며, 모든 금융 상품에 최적화되어 있고, 특정 금융 상품과 함께 사용할 때 최대의 잠재력을 발휘합니다.       트렌드 라인즈 프로       지시자. 모든 계측기에 적용 가능한 가역 구조 스캐너 모든 거래 상품을 자동으로 추적하고 모든 R-반전 패턴을 즉시 식별하여 LOGIC AI 신호가 이미 존재하는 위치와 기타 유용한 정보를 표시합니다. 로직 AI – 진입점을 표시해주는 도우미 시장 진입에 가장 적합한 시점을 판단하는 지능형 신호입니다. TPSproSYSTEM 알고리즘을 사용하여 가격 변동, 추세 및 주요 시장 참
IQ Gold Gann Levels
INTRAQUOTES
5 (4)
Presenting one-of-a-kind Gann Indicator for XAUUSD IQ Gold Gann Levels is a non-repainting, precision tool designed exclusively for XAUUSD/Gold intraday trading. It uses W.D. Gann’s square root method to plot real-time support and resistance levels, helping traders spot high-probability entries with confidence and clarity. William Delbert Gann (W.D. Gann) was an exceptional market analyst whose trading technique was based on a complex blend of mathematics, geometry, astrology, and ancient calcul
Basic Harmonic Patterns Dashboard
Mehran Sepah Mansoor
5 (3)
이 대시보드는 선택한 심볼에 대해 사용 가능한 최신 고조파 패턴을 표시하므로 시간을 절약하고 더 효율적으로 사용할 수 있습니다 / MT5 버전 . 무료 인디케이터: Basic Harmonic Pattern 인디케이터 열 Symbol : 선택한 심볼이 나타납니다 Trend : 강세 또는 약세 Pattern : 패턴 유형(가틀리, 나비, 박쥐, 게, 상어, 사이퍼 또는 ABCD) Entry : 진입 가격 SL: 스톱로스 가격 TP1: 1차 테이크프로핏 가격 TP2: 2차 테이크프로핏 가격 TP3: 3차 테이크프로핏 가격 Current price: 현재 가격 Age (in bars): 마지막으로 그려진 패턴의 나이 주요 입력 Symbols : "28개 주요 통화쌍" 또는 "선택한 심볼" 중에서 선택합니다. Selected Symbols : 쉼표로 구분하여 모니터링하려는 원하는 심볼("EURUSD,GBPUSD,XAUUSD")을 선택합니다. 브로커에 쌍에 접미사 또는 접두사가 있는
Quantum Regime Indicator
Gideon Asiamah Yeboah
Product Name:   Quantum Regime Indicator Short Description:   A multi-engine structural regime and volatility filter. Description: Quantum Regime Indicator (QRI) is a sophisticated technical analysis algorithm designed to identify market structure shifts and volatility regimes. Unlike standard indicators that rely on immediate price action, QRI utilizes a hierarchical logic architecture to filter market noise and identify statistical extremes. The indicator is built on the philosophy of "Market
Matrix Arrow Indicator MT4
Juvenille Emperor Limited
5 (3)
매트릭스 화살표 표시기 MT4 는 외환, 상품, 암호 화폐, 지수, 주식과 같은 모든 기호/도구에 사용할 수 있는 100% 다시 칠하지 않는 다중 기간 표시기를 따르는 고유한 10 in 1 추세입니다.  Matrix Arrow Indicator MT4 는 다음과 같은 최대 10개의 표준 지표에서 정보와 데이터를 수집하여 초기 단계에서 현재 추세를 결정합니다. 평균 방향 이동 지수(ADX) 상품 채널 지수(CCI) 클래식 하이켄 아시 캔들 이동 평균 이동 평균 수렴 발산(MACD) 상대 활력 지수(RVI) 상대 강도 지수(RSI) 포물선 SAR 스토캐스틱 오실레이터 윌리엄스의 백분율 범위 모든 지표가 유효한 매수 또는 매도 신호를 제공하면 강력한 상승/하락 추세를 나타내는 다음 캔들/막대가 시작될 때 해당 화살표가 차트에 인쇄됩니다. 사용자는 사용할 표시기를 선택하고 각 표시기의 매개변수를 개별적으로 조정할 수 있습니다. 매트릭스 화살표 표시기 MT4는 선택한 표시기에서만 정보를 수
F-16 비행기 지표를 소개합니다. 이것은 귀하의 거래 경험을 혁신하도록 설계된 최첨단 MT4 도구입니다. F-16 전투기의 비할 데 없는 속도와 정밀성에 영감을 받아이 지표는 고급 알고리즘과 최첨단 기술을 결합하여 금융 시장에서 압도적인 성능을 제공합니다. F-16 비행기 지표를 사용하면 실시간 분석을 제공하고 매우 정확한 거래 신호를 생성하여 경쟁을 앞서갈 수 있습니다. 다양한 자산 클래스에서 수익 기회를 식별하는 데 필요한 동적 기능을 갖추고 있어 확신을 가지고 정보에 근거한 결정을 내릴 수 있습니다. 사용자 친화적인 인터페이스로 구성된 F-16 비행기 지표는 인기있는 MetaTrader 4 플랫폼과 완벽하게 통합되어 원활하고 효율적인 거래 과정을 보장합니다. 초보자 트레이더든 경험 많은 전문가든 이 지표를 쉽게 사용자 정의하여 고유한 거래 스타일과 선호도에 맞출 수 있습니다. F-16 비행기 지표의 강력함을 경험해 보세요. 이 지표는 시장 트렌드를 정확하고 민첩하게 탐색하며
TPSpro RFI Levels
Roman Podpora
4.85 (27)
러시아어 설명서  /  영어   설명서  /  MT5 버전 주요 기능: 판매자와 구매자의 활동 영역을 표시합니다! 이 지표는 매수 및 매도에 대한 모든 올바른 첫 번째 임펄스 레벨/존을 표시합니다. 진입점 검색이 시작되는 이러한 레벨/존이 활성화되면 레벨의 색상이 바뀌고 특정 색상으로 채워집니다. 상황을 더욱 직관적으로 파악할 수 있도록 화살표도 표시됩니다. LOGIC AI - 템플릿 활성화 시 진입점 검색을 위한 영역(원) 표시 시각적 명확성을 개선하기 위해 인공지능을 사용하여 진입점을 검색한 영역을 표시하는 기능이 추가되었습니다. 더 높은 시간대의 레벨/존 표시(MTF 모드) 더 높은 시간 간격을 사용하여 레벨/존을 표시하는 기능이 추가되었습니다. 또한, 이 지표는 자동 추세 감지 기능(   TPSproTREND PRO   )을 구현했습니다. 거래를 위한 별도의 전문적인 단계별 알고리즘 이 알고리즘은 추세 방향과 반대 방향으로의 당일 거래 모두에 적합하도록 설계되었습니다. 각
FX Volume
Daniel Stein
4.63 (38)
FX Volume: 브로커 시각에서 바라보는 진짜 시장 심리 간단 요약 트레이딩 접근 방식을 한층 더 향상시키고 싶으신가요? FX Volume 는 소매 트레이더와 브로커의 포지션을 실시간으로 파악할 수 있게 해 줍니다. 이는 COT 같은 지연된 보고서보다 훨씬 빠릅니다. 꾸준한 수익을 추구하는 분이든, 시장에서 더 깊은 우위를 원하시는 분이든, FX Volume 을 통해 대규모 불균형을 찾아내고, 돌파 여부를 확인하며 리스크 관리를 정교화할 수 있습니다. 지금 시작해 보세요! 실제 거래량 데이터가 의사결정을 어떻게 혁신할 수 있는지 직접 경험해 보시기 바랍니다. 1. 트레이더에게 FX Volume이 매우 유익한 이유 탁월한 정확도를 지닌 조기 경보 신호 • 다른 사람들보다 훨씬 앞서, 각 통화쌍을 매수·매도하는 트레이더 수를 거의 실시간으로 파악할 수 있습니다. • FX Volume 은 여러 리테일 브로커에서 추출한 실제 거래량 데이터를 종합해 명확하고 편리한 형태로 제공하는
PRO Renko System
Oleg Rodin
5 (30)
PRO Renko System 은 RENKO 차트 거래를 위해 특별히 고안된 매우 정확한 거래 시스템입니다. 이것은 다양한 거래 상품에 적용될 수있는 보편적 인 시스템입니다. 체계는 효과적으로 당신에게 정확한 반전 신호에 접근을 주는 소위 시장 소음을 중화합니다. 이 표시기는 사용하기가 매우 쉽고 신호 생성을 담당하는 매개 변수가 하나만 있습니다. 당신은 쉽게 당신의 선택의 어떤 무역 계기에 공구를 적응시킬 수 있고 renko 막대기의 크기. 나는 항상 당신이 내 소프트웨어로 수익성있게 거래 할 수 있도록 추가 지원을 제공 할 준비가되어 있습니다! 나는 당신에게 행복하고 수익성있는 거래를 기원합니다! 구매 후 저에게 연락하십시오! 내 렌코 차트 생성기를 보내드립니다. 또한 내 개인 권장 사항 및 시스템의 다른 모듈을 무료로 공유 할 것입니다!
FX Power MT4 NG
Daniel Stein
4.95 (21)
FX Power: 통화 강세 분석으로 더 스마트한 거래 결정을 개요 FX Power 는 어떤 시장 상황에서도 주요 통화와 금의 실제 강세를 이해하기 위한 필수 도구입니다. 강한 통화를 매수하고 약한 통화를 매도함으로써 FX Power 는 거래 결정을 단순화하고 높은 확률의 기회를 발견합니다. 트렌드를 따르거나 극단적인 델타 값을 사용해 반전을 예측하고자 한다면, 이 도구는 귀하의 거래 스타일에 완벽히 적응합니다. 단순히 거래하지 말고, FX Power 로 더 스마트하게 거래하세요. 1. FX Power가 거래자에게 매우 유용한 이유 통화와 금의 실시간 강세 분석 • FX Power 는 주요 통화와 금의 상대적 강세를 계산하고 표시하여 시장 역학에 대한 명확한 통찰력을 제공합니다. • 어떤 자산이 앞서고 있고 어떤 자산이 뒤처지는지 모니터링하여 보다 현명한 거래 결정을 내릴 수 있습니다. 포괄적인 멀티 타임프레임 뷰 • 단기, 중기 및 장기 타임프레임에서 통화와 금의 강세를
Reversal Zones Pro is an indicator specifically designed to accurately identify key trend reversal zones. It calculates the average true range of price movement from the lower to upper boundaries and visually displays potential zones directly on the chart, helping traders effectively identify important trend reversal points. Key Features: Reversal Zone Identification: The indicator visually displays potential reversal zones directly on the chart. This helps traders effectively identify importan
Day Trader Master
Oleg Rodin
5 (15)
Day Trader Master 는 데이 트레이더를 위한 완벽한 거래 시스템입니다. 시스템은 두 개의 지표로 구성됩니다. 하나의 지표는 매수 및 매도를 위한 화살표 신호입니다. 얻을 수 있는 화살표 표시기입니다. 2차 지표를 무료로 드립니다. 두 번째 지표는 이러한 화살표와 함께 사용하도록 특별히 설계된 추세 지표입니다. 표시기는 반복하지 않고 늦지 않습니다! 이 시스템을 사용하는 것은 매우 간단합니다. 2색 선으로 표시되는 현재 추세 방향의 화살표 신호를 따라가기만 하면 됩니다. 파란색은 구매 추세입니다. 빨간색은 판매 추세입니다. 파란색 화살표는 매수 신호입니다. 빨간색 화살표는 매도 신호입니다. 추세선의 색상과 일치하려면 화살표의 색상과 신호의 방향이 필요합니다. 화살표 표시기는 주로 시간 간격 M5 및 M15에서 일중 거래를 위해 만들어졌습니다. 그러나 기술적으로 시스템은 다른 시간 간격으로 사용할 수 있습니다. 표시기에는 PUSH 메시지 기능이 있는 팝업 경고가 장착되어 있
지진계 Marketquake Detector. Description in English : https://www.mql5.com/en/market/product/113869?source=Site+Market+Product+Page#description How to use the Seismograph : https://www.mql5.com/en/market/product/113869#!tab=comments&page=2&comment=52806941 Create an EA : https://www.mql5.com/en/market/product/113869#!tab=comments&page=3&comment=52816509 어떤 방식으로 거래하든 유동성이 낮은 시장에 진입하는 것을 피하고 싶을 것입니다.- 지진계는 시장 랠리 전에 시장에 진입할 수 있는 적절한 시기를 도와줄 것입니다. 그러나 바쁠 시장 시간에 진입을 확인했음에도 불구하고 많은 사람들이 유동성이 부족한 시
제작자의 제품 더 보기
What is this Indicator? The   Volume Power Meter   is a lightweight MT4 indicator that measures the   strength of trading volume   and converts it into an easy-to-read   rating between 1/10 and 10/10 . Instead of showing complex histograms or volume bars, it gives traders a   simple numeric score   in one corner of the chart: 1/10 = Very weak volume 5/10 = Average volume 10/10 = Extremely high volume This helps traders quickly judge   market participation and momentum   without cluttering th
PipsZenith – Spread, Time, Session & Candle Timer Indicator (v3.2) Description: Stay one step ahead in Forex trading with PipsZenith , the ultimate on-chart tool that gives you everything you need at a glance. Designed for precision traders, this indicator displays: Real-time Spread – Know the exact cost of your trades instantly. Server Time – Always stay synchronized with broker time. Day & Weekday Info – Track your trading week effortlessly. Active Trading Session – Instantly identify Tokyo,
Multi-Line Alert with Buffer & Push Notifications (MT4 Indicator) Originally shared as a free community tool , this upgraded version is now available on the MQL Market for traders who want professional-grade alerts without sitting in front of the screen all day. With this indicator, simply place horizontal lines on your chart — the indicator will automatically track them, highlight your chosen buffer zone, and notify you the moment price approaches your level. Whether you’re trading support/r
PipsZenith Smart Money Momentum Zones (SM-MZ) v1.0 Brand: PipsZenith Platform: MetaTrader 4 (MT4) Type: Momentum / Smart Money / Swing Zone Indicator Version: 1.0 Overview Unlock the secrets of the market with PipsZenith SM-MZ , a revolutionary momentum-based indicator inspired by Smart Money and liquidity concepts . SM-MZ detects areas where momentum accelerates near swing highs and lows—highlighting potential explosive price zones before big market moves. Perfect for traders looking to anticip
PipsZenith Volatility Breakout Indicator – Product Description Overview The PipsZenith Volatility Breakout Indicator is a professional MT4 tool designed for traders who want to identify high-probability breakout zones based on volatility and recent price action . With clear visual signals, adjustable display, and safe alerts, this indicator helps you stay ahead of market moves , maximize trading opportunities, and trade with confidence. Key Features Breakout Levels Based on Volatility Automatica
PipsZenith — Currency Strength Matrix & Volatility The PipsZenith Currency Strength Matrix & Volatility Indicator is a powerful and easy-to-use tool designed to transform the way you trade. Whether you're a beginner or an experienced trader, this indicator gives you clear and actionable insights into which currencies are strong, which are weak, and where the best trading opportunities are. With this tool, you’ll always know what to trade and in which direction , so you can make smarter, faster,
PipsZenith Momentum Box – Complete Details Indicator Name: PipsZenith Momentum Box Version: 1.0 Platform: MetaTrader 4 (MT4) – ATR-based momentum detection Product Overview: The PipsZenith Momentum Box is a professional ATR-based momentum indicator designed to detect high-probability price moves in real time. It identifies strong momentum candles, highlights them visually with dynamic boxes, and projects potential Take Profit (TP) and Stop Loss (SL) levels to give traders a clear roadmap for
PipsZenith Trend Range Assistant Overview The PipsZenith Trend Range Assistant is a clean, professional MT4 indicator designed to help traders quickly identify whether the market is in a trend (bullish/bearish) or range (sideways). It removes guesswork and prevents false trades in choppy conditions by combining Moving Average slope and ADX strength filters, while also offering Heiken Ashi confirmation for smoother trading decisions. This tool is lightweight, intuitive, and built with contr
PipsZenith Virtual Candle Levels – Indicator Description Take your trading to the next level with PipsZenith Virtual Candle Levels – the ultimate multi-timeframe support and resistance tool. This powerful indicator plots High, Low, Open, and Close levels from multiple standard and custom timeframes, helping traders identify key market zones with precision. Unlike ordinary indicators, PipsZenith Virtual Candle Levels lets you see levels from: Yearly, 6-Month, 4-Month, 3-Month, 2-Month Monthly, We
필터:
리뷰 없음
리뷰 답변