Levels of Pivots

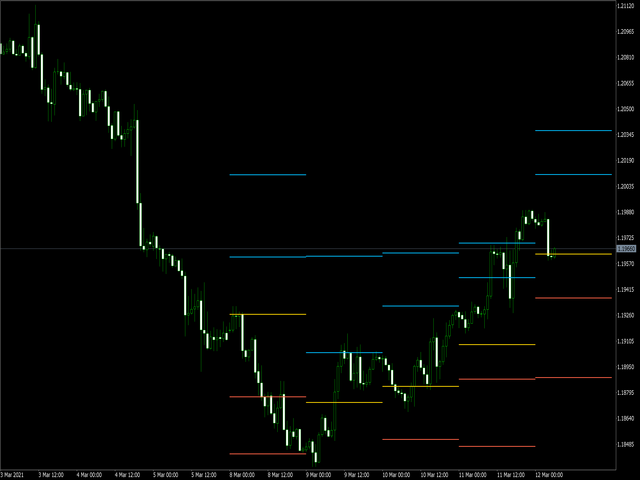
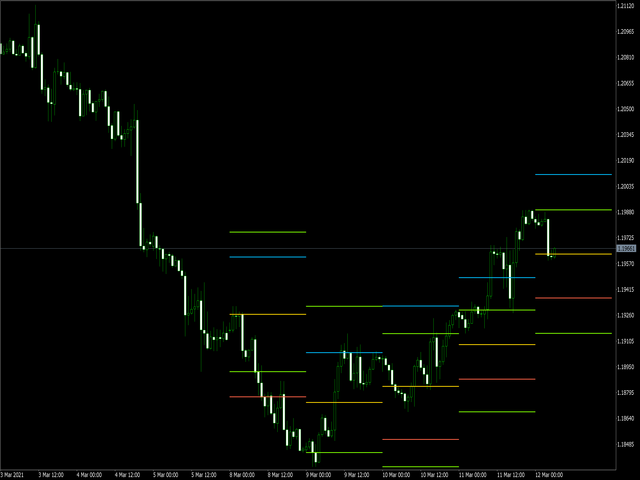
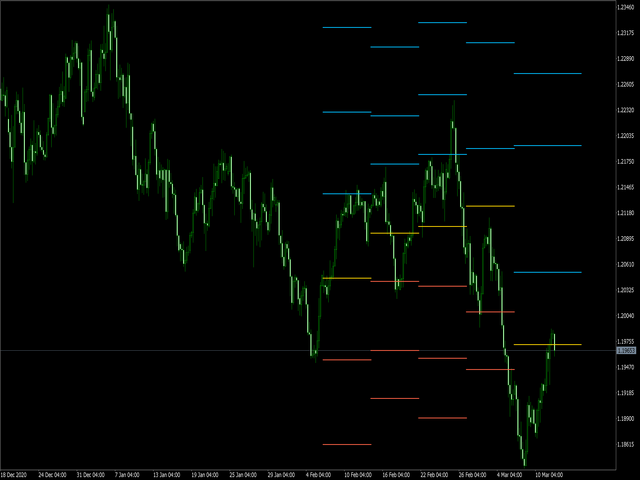
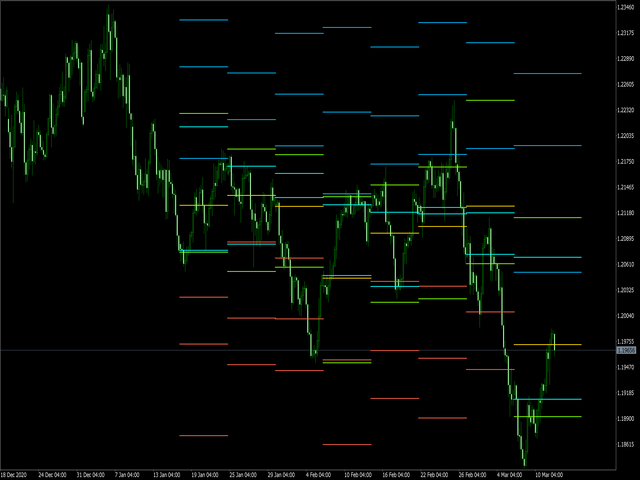
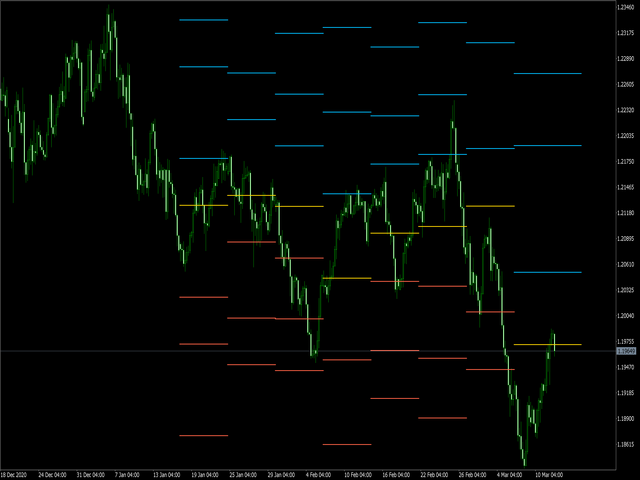
The utility draws reversal levels using the formulas for each of the selected number of candles:

Pivot = (high + close + low) / 3
R1 = (2 * Pivot) - low
S1 = (2 * Pivot) - high
R2 = Pivot + (R1 -S1)
R3 = high + (2 * (Pivot - low))
S2 = Pivot - (R1 - S1)
S3 = low - (2 * (high - Pivot))
H = high
L = low
U = if the candle is bullish, then close. Otherwise - open
D = if the candle is bullish, then open. Otherwise - close

On any timeframe.

After a new candle closes on the calculated timeframe, the levels of the last day are deleted.

That is, the chart always contains up-to-date data for the selected period.

It is possible to turn off levels. In addition to the main one - Pivot
추천 제품
Swiss VWAPsimple
Terence Gronowski
4.8 (5)
Swiss VWAPsimple Motivation Did not find free VWAP that works, the one that I found craseh. So I created a VWAP which calculates values only for the actual day. So computer resouces are not over stressed. What is VWAP, how is it used?  VWAP stands for Volume Weighed Average Price, it calculates the running sum of tick volume and the runnung sum of price times tickvolume. The division of these sums result in a weighed price (Sum P*V/Sum V). The calculation starts normally at midnight. The values
FREE
Volume Weighted Average Price or VWAP is an indicator wich shows different average prices on chart. This is very useful to find strong negotiation price areas and as trend following. Configurations: Day, Week and Month - Show different VWAPs according to the period. You can change each line style on "colors" tab. Any doubt or suggestion please contact us. Enjoy! This is a free indicator, but it took hours to develop. If you want to pay me a coffee, I appreciate a lot   <3 PayPal, Skrill, Nete
FREE
VWAP Diaria
Samuel De Souza Ferreira
Daily VWAP — Institutional Reference for Intraday Value The Daily VWAP is a professional indicator based on the Volume-Weighted Average Price (VWAP) , designed to reveal the true balance between price and volume throughout the trading session. Unlike traditional moving averages, the Daily VWAP incorporates the weight of traded volume in every price movement, providing a much more accurate reference to the behavior of institutional traders and large market participants. What the indicator deliver
FREE
Pivot Points are a classic technical analysis indicator that calculates the central pivot point (PP) as well as support (S1–S3) and resistance (R1–R3) levels based on the previous day’s High, Low, and Close. The indicator allows you to: • identify key zones where the price may bounce or break through • determine the direction of the trend • find good entry points, as well as set stop loss and take profit levels Indicator settings: • enable/disable PP, R1/S1, R2/S2, R3/S3 • enable/disable price l
FREE
This indicator is stand alone version from  MP Pivot Levels  (All in one) containing Woodie Pivots. Woodie’s pivot points are made up of multiple key levels, calculated from past price points, in order to frame trades in a simplistic manner. The key levels include the ‘pivot’ itself, and multiple support and resistance levels (usually up to three each). Traders use these levels as a guide for future price movements when setting up trades. The pivot : (Previous high + previous low + 2 x previous
FREE
Macro-R Pro Signal — Advanced Trading Signal Indicator Macro-R Pro Signal is a professional trading indicator designed to deliver high-quality BUY and SELL signals with enhanced precision and reduced market noise. By combining Bollinger Bands, RSI, and adaptive volatility filtering , this indicator helps traders identify high-probability reversal points while avoiding unfavorable market conditions. How the Strategy Works This indicator is built on a mean reversion + momentum confirmation concep
FREE
Pivots Lines
Abakou Nazaire Ayelenou
5 (1)
모든 시간대에 Traditionnal, Fibonacci, Woodie, Classic, Demark, Camarilla의 피벗 포인트 그리기 모든 유형의 피벗 Traditionnal, Fibonacci, Woodie, Classic, Demark, Camarilla 지원 모든 기간 지원(M1...H1...D1...MN1...매년) 서버 일광 절약 시간제 지원 시드니에서 미국으로 열리는 외환 일일 섹션 지원 닫기 암호화 거래 지원 피벗과 추세 사이의 간격을 채우면 매우 유용합니다. 피벗 포인트는 추세의 방향을 보여주고 수요와 공급을 모니터링하기 위한 결정적인 영역을 제공합니다. 추세 지표로서 피벗 포인트는 주로 감상적 분석에 도움이 됩니다. PP보다 높은 가격은 강세를 나타내고, PP보다 낮은 가격은 시장에서 약세를 나타냅니다.
FREE
This indicator is stand alone version from  MP Pivot Levels  (All in one) containing Demark's Pivots. Calculations:     PP = X / 4     R1 = X / 2 - LOWprev     S1 = X / 2 - HIGHprev Uses: When the pair currency price may change the direction of movement. Possible constraints of support and resistance that creates plateaus for the currency pair prices. Tendency identification by comparing the present prices according to current day's pivot point and also the prior day's pivot points. ____________
FREE
VWAP Daily Clean
Bambang Nugroho
English VWAP Daily (Clean) is a simple and lightweight indicator that plots the classic Daily VWAP (Volume Weighted Average Price) directly on your MT5 chart. Features: Classic Daily VWAP calculation Supports real volume (if available) or tick volume Timezone offset option to match your broker’s server time Weekend merge option (merge Saturday/Sunday data into Friday) Clean version → no arrows, no alerts, only VWAP line VWAP is widely used by institutional traders to identify fair value, su
FREE
Raymond Cloudy Day
The Hung Ngo
5 (3)
Raymond Cloudy Day Indicator for MT5 – Pivot-Based Reversal and Trend Levels Raymond Cloudy Day Indicator is a pivot-based level indicator for MetaTrader 5 (MT5). It was developed by Ngo The Hung based on Raymond’s original idea and is designed to give a structured view of potential reversal zones, trend extensions and support/resistance levels directly on the chart. The default settings are optimised for XAUUSD on the H1 timeframe, but the indicator can be tested and adjusted for other symbols
FREE
The   Pivot Point indicator   automatically calculates and displays the pivot point line and support and resistance levels. Pivot can be calculated according to the Classic, Floor, Fibonacci, Woodie, Camarilla or DeMark formula. It is also possible to select the period for calculating the indicator. A trader can choose from daily, weekly, monthly, or user-defined periods. Types of pivots Classic Floor Fibonacci Woodie Camarilla DeMark Main features The indicator shows the current and historic
FREE
VWAP and MVWAP
Flavio Javier Jarabeck
3.88 (8)
Volume Weighted Average Price (VWAP) is a trading benchmark commonly used by Big Players that gives the average price a Symbol has traded throughout the day. It is based on both Volume and price. Additionally we put in this indicator the MVWAP (Moving Volume Weighted Average Price). For those who do not know the usage and the importance od this indicator I recommend a great article about this subject at Investopedia ( https://www.investopedia.com/articles/trading/11/trading-with-vwap-mvwap.asp )
FREE
Basic Vwap
james mugendi
4 (1)
Simple Vwap with the daily, weekly and monthly VWAP is the abbreviation for   volume-weighted average price , which is a technical analysis tool that shows the ratio of an asset's price to its total trade volume. It provides traders and investors with a measure of the average price at which a stock is traded over a given period of time. How it's used Identify entry and exit points:   Traders can use VWAP to determine when to buy or sell an asset.   Understand price trends :  Traders can use V
FREE
Lib5 EAPadPRO for MT5
Vladislav Andruschenko
4.5 (6)
Library to add the Information Panel to your Expert Advisor for MetaTrader 5. We can not guarantee that the information and interface of the program will give you a profit on deals, but we will definitely say that even the simplest interface of the program can strengthen the first impression. Detailed description and instructions for adding our panel to your Expert Advisor are in our blog: LIB - EAPADPRO Step-by-step instruction Detailed description of our panel and instructions for using EAPADP
FREE
My Candle Patterns
Francisco Gomes Da Silva
5 (1)
이 지표는 My Candle Complete의 데모 버전으로, 여기에서 다운로드할 수 있습니다: Candle Patterns Creator 전체 버전을 사용하면 자신만의 캔들 규칙을 생성하고 전통적인 캔들 패턴을 전략에 맞게 수정하여 더 정확하게 조정할 수 있습니다. 이 지표에는 여러 가지 캔들 규칙 예제가 포함되어 있지만, 여기에서는 일부만을 소개합니다: Pattern Rule Candle Green C > O Candle Red C < O Doji C = O Hammer (C > O and (C-O) *2 < O-L and (C-O) *0.5 > H-C) or (C < O and (O-C) *2 < C-L and (O-C) *0.5 > H-O) Hammer Green C > O and (C-O) *2 < O-L and (C-O) *0.5 > H-C Hammer Red C < O and (O-C) *2 < C-L and (O-C) *0.5 > H-O Marubozu  (C > O
FREE
This indicators automatically draws the   support and resistances   levels (key levels) for you once you've dropped it on a chart. It reduces the hustle of drawing and redrawing these levels every time you analyse prices on a chart. With it, all you have to do is drop it on a chart, adjust the settings to your liking and let the indicator do the rest. But wait, it gets better; the indicator is absolutely free! For more information:  https://youtu.be/rTxbPOBu3nY For more free stuff visit:  https:
FREE
LT Mini Charts
Thiago Duarte
4.88 (8)
This is a utility indicator that creates mini charts on left side of the chart you are looking at. It is very useful to watch many timeframes simultaneously, without having to change between multiple charts. Its configuration is very simple. You can have up to 4 mini charts opened. They automatically load the template of the "parent" chart. If you have any doubt please contact me. Enjoy! This is a free indicator, but it took hours to develop. If you want to pay me a coffee, I appreciate a lot  
FREE
Tick Database — export of tick database from MT5 terminal to MT4. The utility provides access to the tick database in real time. This is necessary to generate synthetic charts in the MT4 terminal, which initially does not provide for loading a tick database. For example, you can organize permanent access to the tick database for the Seconds Chart utility. If the opening time of the current candle in the terminals is different, then you need to specify the time offset in hours. Example We open M1
FREE
MIDAS Super VWAP
Flavio Javier Jarabeck
4.27 (11)
Imagine VWAP, MVWAP and MIDAS in one place... Well, you found it! Now you can track the movement of Big Players in various ways, as they in general pursue the benchmarks related to this measuring, gauging if they had good execution or poor execution on their orders. Traders and analysts use the VWAP to eliminate the noise that occurs throughout the day, so they can measure what prices buyers and sellers are really trading. VWAP gives traders insight into how a stock trades for that day and deter
FREE
Pivot MT5
Dmitrij Isaenko
The indicator draws daily support and resistance lines on the chart, as well as the Pivot level (reversal level). Adapted to work in MT5 The standard timeframe for calculating support and resistance levels is D1. You can choose other timeframes according to your strategy (for example, for M1-M15, the optimal timeframe for calculations is H1) The function for calculating support and resistance levels has been updated; in this calculation option, fibonacci levels are taken into account, respec
FREE
Pivot RPS
Raka
5 (2)
Pivot Point Multi-Method with Dashboard This indicator is a technical analysis tool designed to calculate and display horizontal support and resistance levels based on various Pivot Point methodologies. It is built using the MQL5 Canvas library, ensuring efficient performance and a clean visual presentation on the chart. The tool calculates levels using the data from the previous completed candle of a user-defined reference timeframe. This ensures that the levels remain fixed for the duration of
FREE
Pnitrol Levels
Nikolay Mitrofanov
Draws trend lines from the high and / or low values ​​of the week. The color and thickness of the levels are customizable. All trend lines can be edited. Suitable levels of the past can be renamed and other properties changed. Levels are re-read only on the H1 timeframe once an hour. ...
FREE
Amiguinhos Bar Counter
Eduardo Correia Da Silva
3.67 (3)
Amiguinho's Bar Counter is a price action indicator to display the bar count (candles) with some interesting options. About the "Period of analysis" parameter: if the current timeframe is in minutes, then the analysis period will be considered in days; if the current timeframe is in days, then the analysis period will be considered in months; or  if the period of analysis will be considered in years.
FREE
Important Lines
Terence Gronowski
4.88 (24)
This indicator displays Pivot-Lines, preday high and low, preday close and the minimum and maximum of the previous hour. You just have to put this single indicator to the chart to have all these important lines, no need to setup many single indicators. Why certain lines are important Preday high and low : These are watched by traders who trade in a daily chart. Very often, if price climbs over or falls under a preday low/high there is an acceleration in buying/selling. It is a breakout out of a
FREE
Forex Time Ext
Yuriy Ponyatov
An extended version of the indicator for visualizing the time ranges of key trading sessions: Asian, European and American. The main advantage of this indicator is the automatic construction of a price profile for a trading session. The indicator has the functionality to set the start and end time of each trading session, as well as automatically determine the time zone of the trading server. The indicators include the ability to work with minimal CPU usage and save RAM. In addition, the option
FREE
Free automatic Fibonacci is an indicator that automatically plots a Fibonacci retracement based on the number of bars you select on the BarsToScan setting in the indicator. The Fibonacci is automatically updated in real time as new highest and lowest values appears amongst the selected bars. You can select which level values to be displayed in the indicator settings. You can also select the color of the levels thus enabling the trader to be able to attach the indicator several times with differe
FREE
Wir stellen den Chart Chimes vor - den MT4/MT5-Indikator, der den Handel zu einer Klangsymphonie macht! Sind Sie es leid, den ganzen Tag auf Charts zu starren? Brauchen Sie einen kleinen Muntermacher, um Ihre Stimmung beim Handeln hochzuhalten? Nun, Chart Chimes hat Sie abgedeckt! Mit Chart Chimes hören Sie jedes Mal, wenn Sie diese Taste drücken, einen lustigen Ton, der ein Lächeln auf Ihr Gesicht zaubert und Ihren Schritt zum Hüpfen bringt. Stellen Sie sich vor, Sie handeln mit dem Klang ein
FREE
AC Pivot Panel
Atefe Shoopani
5 (2)
AC Pivot Panel – Your Ultimate Pivot Trading Tool The   AC Pivot Panel   is a powerful yet user-friendly pivot point indicator designed to help traders identify key support and resistance levels with ease. Whether you’re a beginner or an experienced trader, this indicator simplifies pivot trading and enhances your decision-making process. Key Features : Interactive Selection Panel : Easily adjust pivot settings directly on the chart with a compact and intuitive panel. Multiple Pivot Methods : C
FREE
Fair Value Gap Zone
Mattia Impicciatore
일반 설명 Fair Gap Value 지표는 MetaTrader 5 차트에서 “페어 밸류 갭(Fair Value Gaps)”을 감지하고 강조 표시합니다. 페어 밸류 갭은 한 캔들의 저점과 그로부터 두 캔들 앞의 고점 사이에 가격 공백이 생길 때 발생합니다. 이 지표는 이러한 구간을 색이 입혀진 사각형으로 표시하여 가격 행동 전략에 시각적 지원을 제공합니다. 주요 기능 강세 갭 감지 : 현재 캔들의 저점과 두 캔들 이전의 고점 사이 갭을 녹색 사각형으로 표시합니다. 약세 갭 감지 : 반대 방향 갭을 빨간색 사각형으로 표시합니다. 동적 확장 : 사각형을 오른쪽으로 원하는 바(캔들) 수만큼 연장할 수 있습니다. 투명도 조절 : 차트 배경을 가리지 않도록 불투명도를 설정할 수 있습니다. 토글 옵션 : 강세 갭과 약세 갭을 개별적으로 켜고 끌 수 있습니다. 히스토리 제한 : 스캔할 최대 바 수를 설정하여 데이터 양이 많을 때 성능을 최적화할 수 있습니다. 자동 정리 : 타임프레임이 변경되거나
FREE
Vwap Freeze
Ricardo Almeida Branco
5 (1)
The previous day's vwap is used by some traders as a support and resistance point, after all it is one of the ways to consider the fair price of that asset or that pair the day before. Possible defenses can occur in this region indicating a reversal, or triggering stops starting a new, more directional movement. It is a matter of analyzing how it will add to your operational. To avoid manually drawing the previous day's vwaps and saving time for your analysis, use the Vwap Freeze indicator, as
이 제품의 구매자들이 또한 구매함
Trade Assistant MT5
Evgeniy Kravchenko
4.42 (208)
거래당 위험 계산, 라인을 사용한 손쉬운 신규 주문, 부분 청산 기능을 통한 주문 관리, 7가지 유형의 트레일링 스탑 및 기타 유용한 기능을 제공합니다. 추가 자료 및 지침 설치 지침   -   애플리케이션 지침   -   데모 계정용 애플리케이션 평가판 라인 기능       - 차트에 개시선, 손절매, 차익실현을 표시합니다. 이 기능을 사용하면 새로운 주문을 쉽게 하고 개봉 전에 추가 특성을 볼 수 있습니다. 위기 관리       -       위험 계산 기능은 설정된 위험과 손절매 주문의 크기를 고려하여 새 주문의 볼륨을 계산합니다. 이를 통해 손절매 크기를 설정하고 동시에 설정된 위험을 존중할 수 있습니다. 로트 계산 버튼 - 위험 계산을 활성화/비활성화합니다. 필요한 위험 값은 위험 필드에 0에서 100 사이의 백분율 또는 예금 통화로 설정됩니다. 설정 탭에서 위험 계산 옵션을 선택합니다. $ 통화, % 잔액, % 지분, % 자유 마진, % 사용자 정의, % AB 이전
Trade Manager EA에 오신 것을 환영합니다. 이 도구는 거래를 보다 직관적이고 정확하며 효율적으로 만들기 위해 설계된 궁극적인 리스크 관리 도구 입니다. 단순한 주문 실행 도구가 아닌, 원활한 거래 계획, 포지션 관리 및 리스크 제어를 위한 종합 솔루션입니다. 초보자부터 고급 트레이더, 빠른 실행이 필요한 스캘퍼에 이르기까지 Trade Manager EA는 외환, 지수, 상품, 암호화폐 등 다양한 시장에서 유연성을 제공합니다. Trade Manager EA를 사용하면 복잡한 계산은 이제 과거의 일이 됩니다. 시장을 분석하고 진입, 손절 및 익절 수준을 차트의 수평선으로 표시한 후 리스크를 설정하면, Trade Manager가 이상적인 포지션 크기를 즉시 계산하고 SL 및 TP 값을 실시간으로 표시합니다. 모든 거래가 간편하게 관리됩니다. 주요 기능: 포지션 크기 계산기 : 정의된 리스크에 따라 거래 크기를 즉시 결정합니다. 간단한 거래 계획 : 진입, 손절, 익절을 위한
Local Trade Copier EA MT5
Juvenille Emperor Limited
4.96 (135)
Local Trade Copier EA MT5 를 사용하여 매우 빠른 거래 복사 경험을 해보세요. 1분 안에 간편하게 설정할 수 있으며, 이 거래 복사기를 사용하면 Windows 컴퓨터 또는 Windows VPS에서 여러 개의 MetaTrader 터미널 간에 거래를 0.5초 미만의 초고속 복사 속도로 복사할 수 있습니다. 초보자든 전문가든   Local Trade Copier EA MT5 는 다양한 옵션을 제공하여 사용자의 특정 요구에 맞게 맞춤 설정할 수 있습니다. 이는 수익 잠재력을 높이려는 모든 사람을 위한 최고의 솔루션입니다. 지금 사용해보시고 이것이 왜 시장에서 가장 빠르고 쉬운 무역용 복사기인지 알아보세요! 팁: 여기 에서 데모 계정에서 Local Trade Copier EA MT5 데모 버전을 다운로드하여 사용해 볼 수 있습니다. 다운로드한 무료 데모 파일을 MT5 >> File >> Open Data Folder >> MQL5 >> Experts 폴더에 붙여넣고 터
TradePanel MT5
Alfiya Fazylova
4.87 (152)
Trade Panel은 다기능 거래 도우미입니다. 이 애플리케이션에는 50개 이상의 수동 거래 기능이 포함되어 있으며 대부분의 거래 작업을 자동화할 수 있습니다. 주의! 할인은 시간 제한이 있으며, 매주 화요일마다 가격이 5달러씩 인상됩니다. (최대 100달러까지). 구매하기 전에 데모 계정에서 데모 버전을 테스트할 수 있습니다. 데모 계정용 애플리케이션 체험판 다운로드: https://www.mql5.com/en/blogs/post/750865 . 전체 지침 여기 . 거래. 한 번의 클릭으로 거래를 수행할 수 있습니다: 리스크 자동 계산과 함께 예약 주문 및 포지션 열기. 한 번의 클릭으로 여러 주문 및 포지션 열기. 주문 그리드 열기. 예약 주문 및 포지션을 그룹별로 닫기. 포지션 방향 전환 (Buy 닫기 > Sell 열기, Sell 닫기 > Buy 열기). 포지션 잠금 (부족한 포지션을 열어 Buy와 Sell 포지션의 수량을 동일하게 만들기). 모든 포지션 한 번의 클릭으로 부
베타 출시 Telegram to MT5 Signal Trader 는 곧 공식 알파 버전을 출시할 예정입니다. 일부 기능은 아직 개발 중이며, 작은 버그가 발생할 수 있습니다. 문제가 있으면 꼭 보고해 주세요. 여러분의 피드백은 소프트웨어 개선에 도움이 됩니다. Telegram to MT5 Signal Trader 는 Telegram 채널 또는 그룹의 거래 신호를 자동으로 MetaTrader 5 계정으로 복사하는 강력한 도구입니다. 공개 및 비공개 채널을 모두 지원하며, 여러 신호 제공자를 여러 MT5 계정에 연결할 수 있습니다. 소프트웨어는 빠르고 안정적으로 동작하며, 복사된 거래를 완벽히 제어할 수 있습니다. 인터페이스는 깔끔하며 대시보드와 차트가 시각적으로 구성되어 있고, 직관적인 네비게이션이 가능합니다. 여러 Signal Account를 관리하고, 공급자별 설정을 세밀하게 조정하며, 모든 동작을 실시간으로 모니터링할 수 있습니다. 필수 조건 MQL의 제한으로 인해 EA는 Te
Farmed Hedge Yield Farming | All Markets (Manual - Hybrid - Semi/Automated EA) MULTI-ASSET SUPPORT Trade any asset available on your broker - Forex: Major, Minor, Exotic pairs - Crypto: BTC, ETH, XRP, SOL, BNB - Stocks: Apple, Tesla, Amazon, Google, etc. - Commodities: Gold, Silver, Oil, Gas - Indices: US30, NAS100, SPX500, DAX40 - Any CFD your broker offers VERIFIED TRADING RESULTS - Farmed Hedge Yield Axi Copy:  https://www.mql5.com/en/signals/2356376 - Farmed Hedge Yield Exn Copy:   https:/
HINN Lazy Trader
ALGOFLOW OÜ
5 (2)
Limited time offer: 20% off for a few days only!  - Annual subscription $360 instead of $450  - Lifetime plan $550 instead of $690 The core idea: using the user interface, you configure the parameters the chart must meet before entering a position (or positions), choose which entry models to use, and set the rules for when trading and planning should end. Lazy Trader  handles the rest: it  takes over all the routine chart watching and execution! full description  :: 3 key videos [1] ->  [2]   -
Exp COPYLOT CLIENT for MT5
Vladislav Andruschenko
3.82 (34)
MetaTrader 5용 전문 트레이드 복사기 MetaTrader 용 빠르고 전문적이며 신뢰할 수 있는 트레이드 복사기 입니다. COPYLOT 은 MT4와 MT5 터미널 간의 Forex 거래 복사를 지원하며, Hedge 및 Netting 계좌를 모두 지원합니다. COPYLOT MT5 버전 지원 구성: - MT5 Hedge → MT5 Hedge - MT5 Hedge → MT5 Netting - MT5 Netting → MT5 Hedge - MT5 Netting → MT5 Netting - MT4 → MT5 Hedge - MT4 → MT5 Netting MT4 버전 전체 설명 + DEMO + PDF 구매 방법 설치 방법 로그 파일 확인 방법 테스트 및 최적화 방법 Expforex의 모든 제품 MT4 터미널로도 거래를 복사할 수 있습니다(MT4 → MT4, MT5 → MT4): COPYLOT CLIENT for MT4 COPYLOT은 2개, 3개, 심지어 10개의 터미널과 동시에 작동할
Trade Dashboard MT5
Fatemeh Ameri
4.94 (123)
Tired of complex order placement and manual calculations? Trade Dashboard is your solution. With its user-friendly interface, placing orders becomes effortless, by a single click, you can open trades, set stop loss and take profit levels, manage trade lot size, and calculate risk to reward ratios, allowing you to only focus on your strategy. Say goodbye to manual calculations and streamline your trading experience with Trade Dashboard. Download  Demo Version  right now. You can find  Details of
Footprint Chart Pro — Professional OrderFlow EA for MetaTrader 5 Version 6.34 | Professional tool for real traders | Institutional-Grade Visualization DEMO USERS - PLEASE SELECT EVERY TICK / REAL TICK WHEN TESTING AND YOU HAVE DOWNLOADED HISTORICAL DATA. IF YOU SEE A WAITING SCREEN AND IT IS NOT DOWNLOADING, IT MEANS YOU HAVE LOW HISTORICAL DATA. TRY 1 MIN AND 5 MIN FIRST ON 1 DAY DATA. ONE DAY DATA SHOULD BE THE NEWEST AND MOST CURRENT DATE. PLEASE WAIT UNTIL THE MARKET HAS ROLLED OVER PERIOD.
Trade copier MT5
Alfiya Fazylova
4.59 (41)
Trade Copier는 거래 계정 간의 거래를 복사하고 동기화하도록 설계된 전문 유틸리티입니다. 복사는 공급자의 계정/단말기에서 동일한 컴퓨터 또는 vps에 설치된 수신자의 계정/단말기로 발생합니다. 프로모션 - 이미 "Trade copier MT5"를 구매하셨다면, "Trade copier MT4"를 무료로 받으실 수 있습니다 (MT4 → MT5 및 MT4 ← MT5 복사용). 조건에 대한 자세한 정보를 원하시면, 개인 메시지를 통해 저희에게 문의해 주시기 바랍니다! 구매하기 전에 데모 계정에서 데모 버전을 테스트할 수 있습니다. 데모 버전 여기 . 전체 지침 여기 . 주요 기능 및 이점: 복사기는 "МТ5> МТ5", "МТ4> МТ5", "МТ5> МТ4" 복사를 지원합니다. 복사기는 데모 계정 > 실 계정, 실 계정 > 데모 계정, 데모 계정 > 데모 계정 및 실제 계정 > 실 계정 복사를 지원합니다. 복사기는 읽기 전용 암호가 적용된 투자자 계정에서 복사를 지원합니다. 하
Copy Cat More Trade Copier MT5 (복사 고양이 MT5) 는 오늘날의 거래 과제를 위해 설계된 로컬 거래 복사기이자 완전한 위험 관리 및 실행 프레임워크입니다. 프롭펌 챌린지부터 개인 포트폴리오 관리까지, 견고한 실행, 자본 보호, 유연한 구성 및 고급 거래 처리의 조합으로 모든 상황에 적응합니다. 복사기는 마스터(송신자)와 슬레이브(수신자) 모드 모두에서 작동하며, 시장 주문과 예약 주문, 거래 수정, 부분 청산 및 헷지 청산 작업의 실시간 동기화를 제공합니다. 데모 및 실계좌, 거래 또는 투자자 로그인과 호환되며, EA, 터미널 또는 VPS가 재시작되어도 지속적인 거래 메모리 시스템을 통해 복구를 보장합니다. 고유 ID로 여러 마스터와 슬레이브를 동시에 관리할 수 있으며, 브로커 간 차이는 접두사/접미사 조정 또는 사용자 정의 심볼 매핑을 통해 자동으로 처리됩니다. 매뉴얼/설정  | Copy Cat More MT4 | 채널  특별 기능: 설정이 간편함 —
The product will copy all telegram signal to MT5 ( which you are member) , also it can work as remote copier.  Easy to set up, copy order instant, can work with almost signal formats, image signal,  s upport to translate other language to English Work with all type of channel or group, even channel have "Restrict Saving Content", work with  multi channel, multi MT5 Work as remote copier: with signal have ticket number, it will copy exactly via ticket number. Support to backtest signal. How to s
Timeless Charts
Samuel Manoel De Souza
5 (4)
Timeless Charts is an advanced charting solution designed for professional traders seeking for custom charts / custom timeframes , including seconds charts / seconds timeframe, renko charts / renko bars, cluster charts / footprint charts and advanced tools present in most of the popular platforms. Unlike traditional offline charts or simplistic custom indicators, this solution constructs fully custom bars with true timestamp accuracy , down to miliseconds, allowing for a powerful and precise tr
Anchor Trade Manager
Kalinskie Gilliam
5 (2)
Anchor: The EA Manager A coordination system for traders running multiple EAs. Anchor ensures only one EA can trade at a time, preventing conflicting positions and keeping your portfolio safer. Attach Anchor to any chart. Configure your EAs and their magic numbers. Anchor handles the rest. Built for portfolios. Built for discipline. Built for prop firms. The Problem Running multiple EAs on the same account creates risk. Two gold EAs can open opposite positions on the same candle. Three EA
Helios Pulse
Jonathan Mboya Kinaro
Helios Pulse v1.03 — 실시간 확률 대시보드|수동 트레이더를 위한 도구 Helios Pulse는 시장을 읽는 방식을 근본적으로 바꿔줍니다. 여러 지표 창을 번갈아 확인하며 상충하는 신호를 해석할 필요가 없습니다. 하나의 명확한 답 — 현재 시장의 방향성 편향을 보여주는 실시간 확률 퍼센티지가 매 틱마다 지속적으로 갱신됩니다. 이것은 또 하나의 시그널 화살표 패널이 아닙니다. Helios Pulse는 여러 기술적 차원 간의 일치 정도를 측정하고, 실제로 신뢰할 수 있는 확신도 점수를 산출하는 확률 엔진입니다. 방향뿐만 아니라 그 방향이 얼마나 확고한지, 그리고 지금 이 순간 강해지고 있는지 약해지고 있는지를 실시간으로 확인할 수 있습니다. 차트에서 보이는 것 컴팩트한 다크 테마 패널이 차트 위에 배치되며, 롱과 숏 두 개의 다이나믹 확률 카드가 표시됩니다. 시장 상황이 변함에 따라 카드의 색상 강도가 흐릿한 상태에서 선명한 상태로 전환되어, 숫자를 확인하기 전에 즉각적인
MT5 to Telegram Signal Provider 는 사용하기 쉽고 완전히 커스터마이즈 가능한 유틸리티로, 특정 신호를 Telegram의 채팅, 채널 또는 그룹으로 전송하고, 귀하의 계정을 신호 제공자 로 만듭니다. 경쟁 제품과 달리 DLL 임포트를 사용하지 않습니다. [ 데모 ] [ 매뉴얼 ] [ MT4 버전 ] [ 디스코드 버전 ] [ 텔레그램 채널 ]  New: [ Telegram To MT5 ] 설정 단계별 사용자 가이드 가 제공됩니다. 텔레그램 API에 대한 지식은 필요하지 않습니다; 개발자가 제공하는 모든 것이 필요합니다. 주요 특징 구독자에게 보낸 주문 상세 정보를 커스터마이즈할 수 있습니다. 예를 들어, 브론즈, 실버, 골드와 같은 계층 구독 모델을 만들 수 있습니다. 골드 구독에서는 모든 신호를 받습니다. id, 심볼, 또는 코멘트로 주문을 필터링할 수 있습니다. 주문이 실행된 차트의 스크린샷이 포함됩니다 보낸 스크린샷에 닫힌 주문을 그려 추가 검증을 합니다
Seconds Chart MT5
Boris Sedov
4.59 (17)
Seconds Chart - MetaTrader 5에서 초 단위 차트를 생성하는 독특한 도구입니다. Seconds Chart 를 사용하면 초 단위로 설정된 타임프레임으로 차트를 작성할 수 있어, 표준 분 또는 시간 단위 차트에서는 불가능한 유연성과 정밀한 분석이 가능합니다. 예를 들어, S15 타임프레임은 15초 동안의 캔들로 구성된 차트를 의미합니다. 사용자 정의 심볼을 지원하는 모든 인디케이터와 전문가 어드바이저를 사용할 수 있습니다. 이를 사용하는 것은 표준 차트에서 거래하는 것만큼 편리합니다. 표준 도구와 달리, Seconds Chart 는 초고속 타임프레임에서도 높은 정확도와 지연 없이 작업할 수 있도록 지원합니다. Seconds Chart의 장점 1초부터 900초까지 의 타임프레임 지원. 내장 틱 데이터베이스 덕분에 역사 데이터 즉시 로딩 . 실시간 데이터 업데이트로 지연이나 차이 없음 . 여러 초 단위 차트를 동시에 생성 가능. Seconds Chart가 이상적인 경우
HINN MagicEntry Extra
ALGOFLOW OÜ
4.71 (14)
HINN MAGIC ENTRY – the ultimate tool for entry and position management! Place orders by selecting a level directly on the chart! full description   ::  demo-version  :: 60-sec-video-description Key features: - Market, limit, and pending orders - Automatic lot size calculation - Automatic spread and commission accounting - Unlimited partitial take-profits  - Breakeven and trailing stop-loss and take-profit  functions - Invalidation leves - Intuitive, adaptive, and customizable interface - Works
EA Auditor
Stephen J Martret
5 (1)
EA AUDITOR — EA and Signal Verification Tool for MetaTrader 5 EA Auditor is an independent analysis tool for traders evaluating Expert Advisors and trading signals on MetaTrader 5. It audits backtest reports, reviews posted developer signals, and cross-verifies the two against each other to help traders assess strategies before committing capital. The MQL5 market offers a wide range of Expert Advisors from many developers, with varying approaches, quality, and transparency. EA Auditor provides a
Trader Evolution
Siarhei Vashchylka
5 (7)
" Trader Evolution " - A utility designed for traders who use wave and technical analysis in their work. One tab of the utility is capable of money management and opening orders, and the other can help in making Elliott wave and technical analysis. Manual (Be sure to read before purchasing) | Version for MT4 Advantages 1. Trading in a few clicks. Immediate and pending orders are available in the panel 2. Money management. The program automatically selects the appropriate lot size 3. Simplifies
Trade Assistant 38 in 1
Makarii Gubaydullin
4.91 (23)
다기능 도구: 로트 계산기, 그리드 주문, R/R 비율, 트레이드 관리자, 수급 구역, 가격 행동 등 데모 버전   |   사용자 설명서 트레이드 어시스턴트   는 전략 테스터에서 작동하지 않습니다 :   여기에서 데모 버전을 다운로드  하여 유틸리티 를 테스트하세요. 질문/개선 아이디어/버그 발견 시 연락주세요 MT4 버전이 필요하시면 여기 에서 이용 가능합니다 거래   프로세스 를 간소화, 가속화, 자동화하세요. 이   대시보드 로 표준 터미널 기능을 확장합니다. 트레이딩 패널은  모든 거래 상품에서 작동: 외환, 주식, 지수, 암호화폐 등. 1. 새 거래 개시 : 로트 / 위험 / RR 계산 : 수동 거래를 위한 위험 관리 로트 계산기 (위험 크기 기반 거래량 계산) 위험 계산기 (로트 크기 기반 위험 금액) 위험 대비 보상   비율 그리드 주문:  + 동적 간격 옵션, 로트 분할 옵션 주문 활성화 트리거, + 매수 스톱리밋 / 매도 스톱리밋 가상 SL, 가상 TP (숨김
Trade Manager DashPlus
Henry Lyubomir Wallace
5 (13)
DashPlus 는 MetaTrader 5 플랫폼에서 거래 효율성과 효과를 향상시키기 위해 설계된 고급 거래 관리 도구입니다. 리스크 계산, 주문 관리, 고급 그리드 시스템, 차트 기반 도구 및 성과 분석 등 포괄적인 기능을 제공합니다. 주요 기능 1. 리커버리 그리드 불리한 시장 상황에서 거래를 관리하기 위한 평균화 및 유연한 그리드 시스템을 구현합니다. 거래 회복을 최적화할 수 있도록 전략적인 진입 및 종료 포인트를 제공합니다. 2. 스택 그리드 강한 시장 움직임 동안 포지션을 추가하여 유리한 거래에서 잠재적 수익을 극대화하도록 설계되었습니다. 유리한 시장 트렌드에서 승률을 높이며 거래를 확장할 수 있도록 합니다. 3. 손익(P&L) 라인 차트에서 잠재적인 수익 및 손실 시나리오를 시각적으로 표현합니다. 설정을 조정하고 P&L 라인을 드래그하여 실행 전에 다양한 거래 결과를 평가할 수 있습니다. 4. 바스켓 모드 동일한 심볼에 여러 포지션을 단일 집계 포지션으로 결합하여 관리합니
EasyTrade MT5
Alain Verleyen
5 (3)
Easy Trade – 스마트하고 간단하며 강력한 트레이드 관리 Easy Trade는 리스크를 철저히 관리하고 실행을 더욱 원활하게 하려는 MetaTrader 사용자들을 위한 올인원 트레이드 관리 솔루션입니다. 트레이더들의 피드백을 바탕으로 처음부터 설계된 Easy Trade는 여러 종목의 거래를 간단하게 실행, 모니터링 및 관리할 수 있도록 하며, 작업 흐름을 복잡하게 만들지 않습니다. 수동 스캘핑이든, 소규모 전략 포트폴리오 관리든, Easy Trade는 트레이더가 현명한 판단과 안정적인 수익에 집중할 수 있도록 돕습니다. ⸻ Easy Trade를 사용해야 하는 이유 정밀한 리스크 관리: 고정 로트 또는 퍼센트 기반 리스크 설정 가능. 실시간 리스크 및 수익률 정보 제공. 바스켓 기반 트레일링: 여러 거래의 수익을 모니터링하고 목표 달성 시 이익을 부분 확정 가능. 군집 진입에 이상적. 거래 캡처: 각 거래를 스크린샷으로 기록 가능 – 트레이딩 저널 및 성과 분석에 적합.
Poc Breakout Signal: The Ultimate Institutional Order Flow & Price Action System Elevate your trading with Poc Breakout, a comprehensive technical analysis tool designed to bridge the gap between retail trading and institutional market understanding. This all-in-one system combines powerful Buy/Sell signals, advanced Volume Profile analysis, real-time Order Flow (Depth of Market), and critical macroeconomic data to give you a clear, unambiguous edge in the markets. Poc Breakout Signal decodes c
Advanced Dashboard Ultra
Mirel Daniel Gheonu
5 (1)
MT5용 통계 대시보드 & 저널 ULTRA (Stats Dashboard & Journal ULTRA) 완벽한 트레이딩 지휘 본부: 분석, 자동화 및 뉴스 인텔리전스. Stats Dashboard ULTRA는 Pro 분석 도구의 궁극적인 진화형입니다. 이는 MetaTrader 5를 전문 트레이딩 스테이션으로 변모시키며, 기관급 성과 분석과 자동화된 뉴스 보호 및 고급 심리 지표를 결합합니다. 완전한 통제력을 원하는 수동 트레이더와 EA 포트폴리오 관리자를 위해 설계되었습니다. ULTRA 버전의 새로운 기능 뉴스 인텔리전스 엔진 (News Intelligence Engine): 뉴스를 보기만 하지 말고 분석하십시오. 대시보드는 과거 뉴스 이벤트가 오픈된 포지션에 어떤 영향을 미쳤는지 시뮬레이션하여 포지션을 보유할지 청산할지 알려줍니다. EA 봇 가드 (자동 보호): 중요도가 높은 뉴스(High-Impact News) 발표 중에 다른 전문가 자문(EA)을 자동으로 일시 중지하고 시장이
Ultimate Trailing Stop EA MT5
BLAKE STEVEN RODGER
4.13 (8)
This EA Utility allows you to manage (with advanced filtering) unlimited open orders (manual or EA) with 16 trailing stop methods: fixed, percent, ATR Exit, Chandelier Exit, Moving Average, Candle High Low Exit, Bollinger Bands, Parabolic, Envelope, Fractal, Ichimoku Kijun-Sen, Alligator, Exit After X Minutes or Bars, RSI and Stochastic. The trailing stop can be either real or virtual, and you can exit fully or with a partial close percent on touch or bar close.  Moreover, you can add (override
Smart Stop Scanner – 실제 시장 구조 기반의 멀티자산 스톱로스 분석 시스템 개요 Smart Stop Scanner는 여러 시장에서 스톱로스 구조를 전문적으로 모니터링하기 위해 설계된 강력한 도구입니다. 실제 시장 구조, 핵심 브레이크아웃, 가격 행동 로직을 기반으로 가장 의미 있는 스톱 영역을 자동으로 감지하며, 고해상도(DPI 지원)의 깔끔하고 일관된 패널에 모든 정보를 표시합니다. 포렉스(FOREX), 금, 지수, 금속, 암호화폐 등 다양한 자산군을 지원합니다. 스톱 레벨 계산 방식 이 시스템은 기존의 인디케이터 공식을 사용하지 않습니다. 대신 브레이크아웃, 더 높은 고점, 더 낮은 저점 과 같은 실제 시장 구조 이벤트를 분석합니다. 스톱 레벨은 이러한 구조적 지점에서 직접 생성되므로 시장의 실제 움직임과 자연스럽게 일치하며, 더 신뢰도 높은 스톱 시스템을 제공합니다. 주요 기능 • 고정밀 멀티자산 호환성 포렉스, 금속, 금, 지수, 암호화폐 등 다양한
Trade Manager DaneTrades
Levi Dane Benjamin
4.28 (29)
거래 관리자는 위험을 자동으로 계산하는 동시에 거래를 빠르게 시작하고 종료하는 데 도움을 줍니다. 과잉 거래, 복수 거래 및 감정 거래를 방지하는 데 도움이 되는 기능이 포함되어 있습니다. 거래를 자동으로 관리할 수 있으며 계정 성과 지표를 그래프로 시각화할 수 있습니다. 이러한 기능은 이 패널을 모든 수동 거래자에게 이상적으로 만들고 MetaTrader 5 플랫폼을 향상시키는 데 도움이 됩니다. 다중 언어 지원. MT4 버전  |  사용자 가이드 + 데모 트레이드 매니저는 전략 테스터에서 작동하지 않습니다. 데모를 보려면 사용자 가이드로 이동하세요. 위기 관리 % 또는 $를 기준으로 위험 자동 조정 고정 로트 크기 또는 거래량과 핍을 기반으로 한 자동 로트 크기 계산을 사용하는 옵션 RR, Pips 또는 Price를 사용한 손익분기점 손실 설정 추적 중지 손실 설정 목표 달성 시 모든 거래를 자동으로 마감하는 최대 일일 손실률(%)입니다. 과도한 손실로부터 계정을 보호하고 과도한
Equity Protect Pro: 안심 거래를 위한 종합 계좌 보호 전문가 계좌 보호, 자산 보호, 포트폴리오 보호, 다중 전략 보호, 수익 보호, 수익 확보, 거래 보안, 위험 관리 프로그램, 자동 위험 관리, 자동 청산, 조건부 청산, 예약 청산, 동적 청산, 추적 손절매, 원클릭 종료, 원클릭 청산, 원클릭 복원 등의 기능을 찾고 있다면 Equity Protect Pro가 바로 필요한 프로그램입니다. 설정이 간편하고 사전 설정된 조건이 충족되면 모든 차트를 닫을 수 있으며 신호 구독 취소도 지원합니다(이는 모든 거래 프로그램도 중지됨을 의미합니다). 이 시점에서 새로운 주문이 생성되지 않으며 최종적으로 모든 주문이 종료되어 예상치 못한 손실을 효과적으로 방지하고 안심하고 거래할 수 있습니다. Equity Protect Pro (Technical Manual) Equity Protect Pro Demo Version for yo u to test   Equity Protect
제작자의 제품 더 보기
Auto Fibo DWM
Nikolay Mitrofanov
The indicator takes the last closed bar from three timeframes (daily, weekly, monthly) and draws Fibonacci levels based on the high and low prices of that bar. Depending on the opening and closing prices, the high and low are reversed. That is, if the candle is bullish, the low price is used as the starting price; otherwise, the high price is used. There's a second drawing option. Two opposing Fibonacci levels are drawn, each colored differently. Coincident levels and levels within the 0-100 ra
FREE
Mahisto Trend Chart
Nikolay Mitrofanov
5 (2)
The indicator makes calculations based on data obtained from one of seven (7) moving averages and colors the chart. Simple moving averages are those that have only one important calculation parameter - the period. The shift in the indicator is not used. There is a shift trick setting, it is used to smooth the result of calculations. You can see the changes if you reduce this parameter to 1 (minimum value). shift trick must always be less than the period value. Available averages: MA Simpl
FREE
RSI Chart Levels
Nikolay Mitrofanov
4.83 (6)
The indicator draws levels based on the overbought and oversold values ​​of the RSI indicator. The maximum values ​​are taken into account, which are equal to or exceeded certain limits. That is, for example, when the price has gone into the overbought zone, the highest price is selected from all prices in this zone for this period of time, and as soon as the indicator value returns to a value below the overbought value, the level is fixed and the calculation of new values ​​begins. The same
FREE
Strong movement levels
Nikolay Mitrofanov
5 (2)
Looks for strong price movements and draws levels upon their completion. You determine the strength of the movement yourself by specifying in the settings the number of points and the number of candles of the same color in a row in one direction. There are 2 types of building in the settings: extrenum - high / low close - close price You can also adjust the number of displayed levels and the number of candles for calculations. By default, the settings indicate 5 levels for 360 candles. That
FREE
The utility draws pivot levels based on a selection from day week month The previous candlestick of the selected timeframe is taken and the values for the levels are calculated using the following formulas: Pivot = (high + close + low) / 3 R1 = ( 2 * Pivot) - low S1 = ( 2 * Pivot) - high R2 = Pivot + (R1 -S1) R3 = high + ( 2 * (Pivot - low)) S2 = Pivot - (R1 - S1) S3 = low - ( 2 * (high - Pivot)); The style and thickness for all lines are adjusted. The colors for the R, Pivot and S lines ar
FREE
The indicator uses moving average reversal values ​​on all selected timeframes to plot levels where the moving average has reversed, which can be considered support or resistance levels, as well as trend change signals on the timeframe of the newly drawn line. The moving average is passed through the RSI indicator. The line colors are customizable and, by default, indicate the following: 1. Purple - the moving average has changed direction downwards. 2. Gold - the moving average has changed di
FREE
The indicator draws a normal chart by coloring it in colors based on prices calculated by the Heiken Ashi indicator algorithm. That is, the shape of the candles does not change. In fact, this is the same Heiken Ashi that does not distort the price chart. Then there will be a drawing of a cat, because there is nothing more to write about the indicator. .                                                       
FREE
Stop Loss Util
Nikolay Mitrofanov
The utility automatically sets the take-profit and stop-loss levels specified by the user in the parameters and moves the stop-loss line when the specified number of points above the trade price is exceeded. There are 4 trailing stop options: Disabled - Disabled Trail - Simply move the stop-loss level To breakeven - Move the stop-loss to breakeven when the value of points specified in the settings is exceeded and do not move the level any further As steps - Move the stop-loss to breakeven when
FREE
The indicator highlights in color the places on the chart where the price moves in one direction continuously from the selected number of candles. You can specify the number of points from the beginning of the movement to select only movements from this amount. It can be useful for looking for reversals or sharp impulses. I also recommend purchasing this utility to determine local weekly / monthly trends and support and resistance lines. https://www.mql5.com/en/market/product/61401
FREE
Calculates pivot levels. It paints the histogram depending on the location of prices relative to these levels. Parameter values: style - select the type of display (Histogram, Line, Arrow) price - price, has little effect on the final look, but this can be customized timeframe - select a timeframe for calculating levels. color over pivot line - color of everything above the pivot level color under pivot line - color of everything below the pivot level pivot line intersection color - the color
FREE
Trendline Equalizer
Nikolay Mitrofanov
1.5 (2)
When creating, modifying and moving a trend line, two anchor points will be selected: high / low, open / close, median or weighted from the candlestick prices. For high / low, open / close, if the anchor point is above the candlestick, the upper price will be taken, below the candlestick - the lower one. If the point is inside the candlestick, then if the first point is higher than the second, then the first one goes up, the second goes down. Conversely, if the second is higher than the first.
FREE
Pnitrol Levels
Nikolay Mitrofanov
Draws trend lines from the high and / or low values ​​of the week. The color and thickness of the levels are customizable. All trend lines can be edited. Suitable levels of the past can be renamed and other properties changed. Levels are re-read only on the H1 timeframe once an hour. ...
FREE
The indicator draws a colored histogram from comparisons of the strengths of bulls and bears. It works like this: The values ​​of two indicators Bears and Bulls are taken, who is stronger on the candlestick is compared, the column is filled in. It's all. .
FREE
The indicator draws levels based on the overbought and oversold values ​​of the RSI indicator. All timeframes are available. Can be enabled or disabled in any combination. The most recently closed overbought levels are selected based on the bar's closing price or the level of the first RSI indicator intersection with the 50% line. For more information, you can enable the display of RSI values ​​for the most recently closed bars (candles) and the current values ​​of all enabled indicators (upda
The indicator averages the price using one of four methods: Simple Exponential Linear Weighted Smoothed Tema Dema None Then filters the result through the RSI values. This results in a line drawn that approximates the trend change in the RSI peak zones. The last three screenshots show two indicators on a single chart with RSI high and low prices and the rest of the default parameters. The up color (red) for the high prices is set to None, while the down color (blue) for the low prices is set to
필터:
리뷰 없음
리뷰 답변