Triangle Patterns


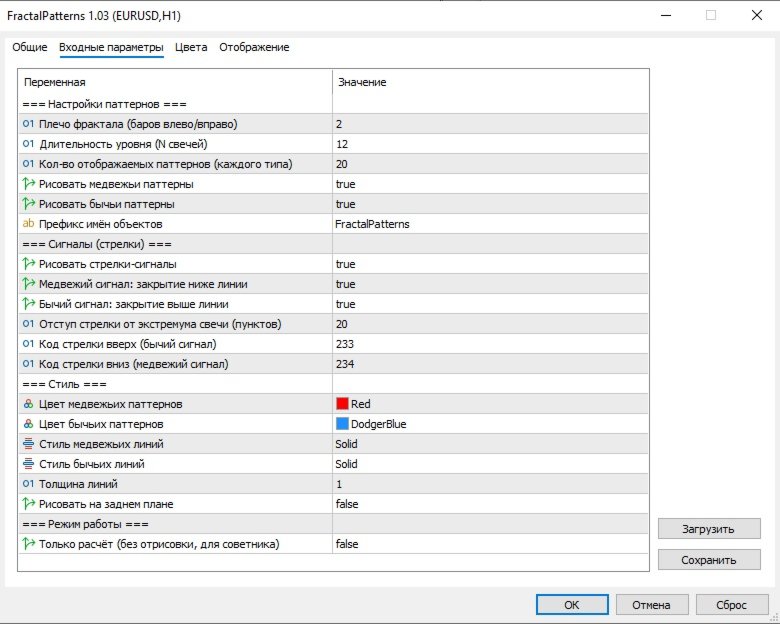
A swing pattern indicator based on fractals.
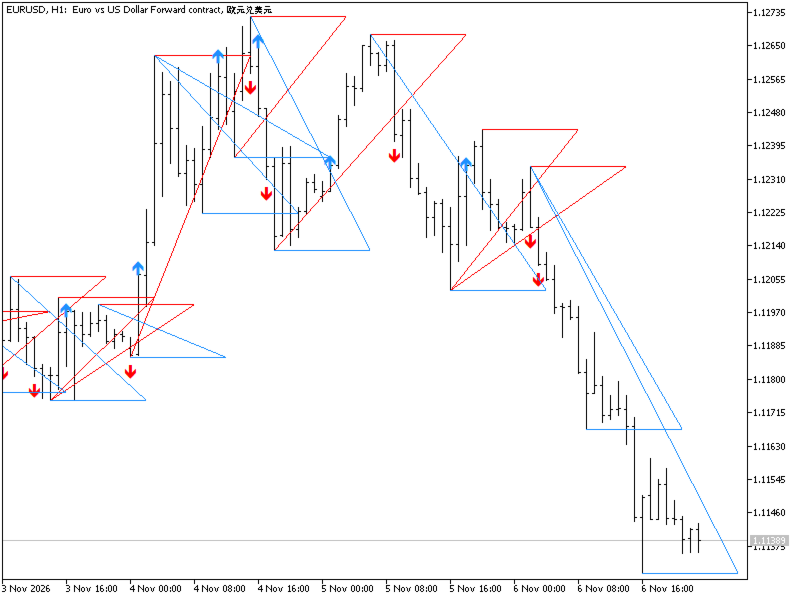
At each confirmed swing extreme (fractal), a horizontal level lasting N candles is drawn.
A trend line is drawn from the previous fractal to the right edge of the level.
Arrow signals: when a candle crosses the trend line and closes beyond it, an arrow is displayed pointing in the direction of the trade.
A stop loss is placed beyond the extreme.
제작자의 제품 더 보기
Индикатор показывает финансовый результат по всем открытым позициям открытым по инструменту. Это полезно если открыто несколько сделок в разных направениях. В подсчете результата учтены накопленные свопы и комиссии за открытие сделок. Результат отображается в отдельном подокне, чтобы не нагружать информацией рабочий график. Результат сделок отображается на горизонтальном уровне, который пользователь сам наносит на график и переносит на интересующий уровень цены. Горизонтальному уровню по умолчан
FREE
Советник использую в своей торговле. Данный советник не открывает сделки, он показывает статистику по счету. Финансовый результат отображается по ордерам открытых с определенным Magic. Статистику можно отсортировать в разрезе каждого magic, по прибыли / убытку, по количеству сделок, по максимально допущенной просадке. Используя данный советник можно своевременно внести корректировки в торговую стратегию советника на вашем счету и избежать непредвиденных убытков. PS Если у Вас есть предложения и
FREE
LiquidityHunt
Evgenii Kuropov
This indicator shows the most probable current price movement, predicting the price movement for the purpose of collecting liquidity. The main advantage is that the indicator does not repaint. Small arrows on the chart indicate each price direction signal. Large/long arrows indicate the price direction toward specific levels indicated on the chart. This indicator can be used to implement the "Stop Hunt" strategy.
WolfeWaves
Evgenii Kuropov
This indicator significantly simplifies manual chart marking when trading using the Wolfe Wave strategy. First, click the start button. A chart appears with points marked 1-2-3-4-5. The user manually places points 2-3-4 on the chart, according to the strategy conditions. Then the magic happens: The indicator finds point 1. Calculates and displays the following levels on the chart: * Trade entry level * Stop loss level * Take profit closing level
The advisor searches for open positions and pending orders with the specified magic number and opens another order with the magic number specified by the user. You can specify the same magic number so that the main robot will accept it as its own and execute it, in the same direction and at the same price (market or pending). Duplicate volume: fixed or x-multiple of the volume of the found order. The duplicate is automatically closed when the main order closes.
POC ZigZag
Evgenii Kuropov
The indicator displays the POC (Point of Control) at the extremes of a swing zigzag.  Algorithm: 1. A zigzag is plotted: swing extremes (fractal pivots) with a depth of N bars to the left and right of the extreme. 2. For each extreme, a volume profile is plotted over a window of N candlesticks (the window is centered on the extreme bar). 3. The POC is the level with the highest volume in this window; it is plotted on the chart as a horizontal line.
필터:
리뷰 없음
리뷰 답변