VWAP Price Rejection Signals

The VWAP Rejection Signals Indicator: A Comprehensive Overview

The Genesis of a Precision Trading Instrument

This isn't just another indicator cluttering your chart. The VWAP Rejection Signals Indicator represents a sophisticated fusion of institutional-grade volume analysis, session-based anchoring, and structural price action confirmation. It's a complete trading ecosystem designed to identify high-probability setups where the convergence of multiple independent factors creates a compelling edge.

The Core Architecture: Four Pillars of Market Insight

1. The Volume Profile Engine – Your Market X-Ray

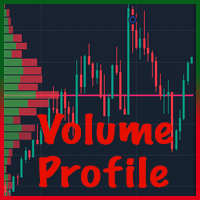
Imagine being able to see exactly where the big money has been accumulating positions, not just over the last few bars, but across a meaningful lookback period. The volume profile visualization in this system mirrors the professional tools used by institutional traders, displaying volume distribution as horizontal histograms that reveal the market's true structure.

The green and red bars extending from the right edge of your chart aren't just decoration – they're a visual representation of cumulative buying versus selling pressure at each price level. When you see a thick green cluster, you're witnessing a volume node where buyers have been aggressively accumulating. Conversely, thick red bars signal selling pressure zones that act as formidable resistance.

The Point of Control (POC) – that bright yellow horizontal line – represents the single most traded price level in your selected lookback period. This isn't just a random level; it's the market's equilibrium point, a magnet that price tends to return to, and often the most significant support or resistance on your chart.

2. Session-Anchored VWAP Curves – Following the Smart Money

This is where the system truly separates itself from basic indicators. Instead of a single, static VWAP line, you get three distinct curves, each anchored to its respective session's opening bell:

Asia VWAP (Teal): Anchors at midnight and accumulates throughout the Asian session, reflecting the true average price paid by Asian institutional participants.

London VWAP (Blue): Resets at 8 AM, capturing European institutional activity and often setting the tone for the broader trading day.

NY VWAP (Purple): Anchors at 1 PM, representing Wall Street's entry price and their cumulative positioning through the US session.

The brilliance of this approach lies in its dynamic nature. Each VWAP curve evolves in real-time, flattening and smoothing as the session progresses, mirroring exactly how professional traders use these levels. These aren't static lines – they're living indicators of where the institutional bids and offers reside.

3. The Daily Bias Filter – Your Macro Compass

Before you even consider taking a trade, this system forces you to check the prevailing wind. The daily bias determination isn't a simplistic "price above/below moving average" signal. It synthesizes:

· 20-period Daily EMA: The trend's gravitational center
· 14-period RSI: Momentum and overextended conditions
· ADX with 25 Threshold: Trend strength verification
· A News Filter: Market-moving event awareness

The result is a clear directive: "BUY ONLY," "SELL ONLY," or "NO CLEAR BIAS." This prevents the cardinal sin of trading against the prevailing daily sentiment, saving you from countless losing positions that might have worked on lower timeframes but failed due to larger context.

4. The Entry Trigger System – Precision Timing

Here's where the magic happens. The VWAP Rejection Signals Indicator doesn't just alert you to random price movements. It waits for a very specific sequence:

Step One: Rejection at Key Levels
The price must approach a significant level (POC or any of the three VWAP curves) and demonstrate clear rejection. This isn't just touching the level – the system requires a wick-to-body ratio of at least 55%. A long lower wick at a support level indicates aggressive buying rejection, while a long upper wick at resistance shows selling pressure.

Step Two: Structural Confirmation
Following the rejection, the system scans for Market Structure Shift (MSS), Change of Character (CHOCH), or Confirmed Inversion Signal (CISD). This means:

· For a buy setup: The system confirms that price has broken above a recent swing high, demonstrating that sellers have been overwhelmed and the market structure has shifted from bearish to bullish.
· For a sell setup: Price must violate a recent swing low, proving that buyers have lost control and bears are in command.

Step Three: Entry Execution
Once both conditions are met, the system generates an entry signal at the close of the rejection bar. It automatically calculates a stop-loss below the rejection low (for buys) or above the rejection high (for sells), and a take-profit based on your predetermined risk-to-reward ratio.

Maximizing Profit: Strategic Implementation

The Optimal Way to Use This System

Trade with a Bias, Not Against It
This cannot be overstated: when the VWAP Rejection Signals Indicator displays "BUY ONLY," your entire focus should be on long setups. Even if you see what appears to be a perfect sell signal, the daily bias filter is there for a reason – it's preventing you from catching falling knives in a bull market or trying to pick tops in a bear market.

Wait for Confluence
The most powerful setups occur when multiple levels align. Imagine an Asia VWAP curve intersecting with the POC, and price rejects from this exact zone. This is your jackpot scenario – the volume profile and institutional anchoring confirming each other.

Let the Rejection Develop
Patience is paramount. The system specifically looks for rejection bars with substantial wicks. These are your evidence that institutional money is defending these levels. Don't be tempted to enter prematurely just because price touched the level.

Multiple Timeframe Symmetry
While the system operates on your current chart timeframe, the concepts of POC and VWAP are independent of your chart's compression. The levels remain valid regardless of whether you're watching 1-minute, 5-minute, or 15-minute charts.

Strategic Advantages That Give You an Edge

Institutional-Level Insights
You're essentially seeing what the big players see. The volume profile and VWAP curves are fundamental tools used by professional trading desks worldwide. This system democratizes access to that information.

Objective Entry Criteria
Emotion is removed from the entry process. You're not guessing – you're responding to a specific set of conditions that have been coded into the system. The rejection + structure combination filters out false signals that plague simpler strategies.

Risk Management Built-In
The automatic stop-loss placement at the rejection extreme provides logical, objectively determined risk parameters. Your risk isn't arbitrary; it's based on the actual price action that triggered the setup.

Bias Confirmation Prevents Common Mistakes
The daily bias filter is perhaps the system's greatest gift. It prevents the human tendency to try and pick tops and bottoms, forcing you to trade in harmony with the larger trend.

Visual Clarity and Reduced Chart Clutter
Despite the powerful analysis occurring beneath the surface, the chart remains clean and actionable. The volume profile, VWAP curves, and trade boxes provide clear visual cues without overwhelming the trader.

Critical Watchouts – What Can Go Wrong

VWAP Resets Can Cause Whipsaw
When each session's VWAP resets at the opening bell, the curve may initially be volatile and potentially trap traders. The early session VWAP is based on very little volume and can swing dramatically.

Volume Profile Lag
The volume profile is based on historical data and may not immediately reflect the most current market dynamics. In extremely fast-moving markets, the profile might lag behind price action.

News-Driven Gaps
If there's a significant news event between sessions, the VWAP and volume profile might be "disconnected" from the new reality. This is why the news filter is available, but you should be even more cautious during high-impact news releases.

False Rejection Signals
Sometimes what looks like rejection is actually a pause before a powerful continuation. The structural confirmation step helps mitigate this, but no system is perfect.

Expectancy in Low Volatility
During periods of extremely low volatility, rejection wicks may be small and structural breaks less pronounced. This system thrives in markets with reasonable volatility and clear directional movement.

The Do's and Don'ts of Mastery

DO's

DO Wait for the Complete Signal Chain
Never enter on rejection alone, and never enter based on structure alone. The VWAP Rejection Signals Indicator requires both components sequentially for a reason.

DO Respect the Daily Bias
If the system says "BUY ONLY," and you're tempted to short, ask yourself if you're trying to be smarter than the volume profile and the broader market sentiment. The answer is almost always no.

DO Scale Into Multiple Confluences
When a setup occurs at a level where multiple VWAP curves align with the POC, consider a larger position size. This confluence represents a higher probability scenario.

DO Use the Alerts to Free Your Time
The system will alert you when setups occur. This isn't cheating – it's efficient use of your attention. Let the algorithm monitor price action while you maintain broader perspective.

DO Review Your Trades Against the System's Output
After each trade, whether winning or losing, evaluate if you followed the system's rules or introduced discretionary elements. Consistency is the mother of trading success.

DO Maintain Multiple Session Level Awareness
The Asia VWAP might provide support during London trading. The London VWAP might offer resistance during NY trading. Understanding these session dynamics improves your level analysis significantly.

DON'Ts

DON'T Chase Entries
If you miss the initial rejection bar, wait for the next setup. Chasing price after a breakout often results in poor risk-reward ratio and increased probability of reversal.

DON'T Ignore the News Filter During Volatile Events
During NFP, FOMC, or other high-impact releases, price movements can violate all technical levels. Consider temporarily disabling the system or dramatically reducing position size.

DON'T Average into Losing Positions
If price moves against your entry and hits the stop-loss, the setup is invalidated. Adding to a losing position based on VWAP levels is a recipe for disaster.

DON'T Trade in Choppy, Ranging Markets
When the daily bias shows "NO CLEAR BIAS," this is the system telling you to stand aside. Forcing trades in these conditions wastes capital and psychological energy.

DON'T Overlook the Volume Profile Visualization
The green and red bars are more than aesthetic – they show you where the real volume is accumulating. Ignoring this information is like driving with your eyes closed.

DON'T Adjust Risk Reward Based on Emotion
The system's RR ratio is set for a reason. Widening it in hope of bigger profits or narrowing it out of fear will disrupt the statistical expectancy of the strategy.

The Psychological Framework for Success

Cultivating Patience in a World of Noise

The greatest challenge with this system isn't understanding the levels or the signals – it's having the discipline to wait for setups that meet all criteria. The market will present hundreds of "almost setups" for every genuine signal. Learning to ignore the near-misses is a skill that separates successful traders from the rest.

Embracing the Inevitable Losses

Even with all these confluences, the VWAP Rejection Signals Indicator will lose trades. Understanding this intellectually is easy; accepting it emotionally is the true test. View each trade as a single data point in a distribution, not as a referendum on your trading competence.

Trusting the Process Over the Outcome

Your focus should be on flawless execution of the system rules, not on whether this specific trade wins or loses. Consistency in following the methodology will, over a statistically significant number of trades, produce the desired expectancy.

Managing Your State of Mind

The system's alert can fire at any time. Be mentally prepared to evaluate the setup objectively even if you're tired, frustrated, or distracted. If you can't maintain this state, have the discipline to ignore the alert and wait for the next signal when you're psychologically ready.

Advanced Integration Strategies

Enhancing with Chart Patterns

While the system is comprehensive, you can elevate your analysis by observing traditional chart patterns. A bull flag forming at the POC, with the system showing "BUY ONLY" bias and a recent rejection wick, is a potent convergence of technical factors.

Volume Context at Key Levels

Pay attention to the volume profile bars at the level where rejection occurs. A rejection at a price level with massive green bars (buying volume) is stronger than one at a level with limited volume participation.

Multi-Session Level Dynamics

Watch how the VWAP curves interact across sessions. If London VWAP crosses above Asia VWAP, it might represent a shift in the broader institutional sentiment. These crossover events often precede significant directional movement.

The Cumulative Effect

Consider tracking the system's performance over time. Understanding its win rate, average winner versus average loser, and frequency of signals across different market conditions will build confidence and help you fine-tune your risk management.

Final Perspective: The Edge in Your Hands

The VWAP Rejection Signals Indicator represents a convergence of professional trading concepts rarely accessible in a single, integrated package. It's not a magic bullet, but rather a powerful framework that, when used with discipline and psychological fortitude, provides a genuine edge in the markets.

The edge comes not from any single component, but from the synergy of combining volume-profile analysis, session-anchored VWAP curves, structural confirmation, and daily bias filtering. Each element independently provides value; together, they create a synthesis that significantly improves the probability of successful trades.

Your success with this system will ultimately be determined by your ability to execute its rules with discipline, manage risk appropriately, and maintain the psychological composure necessary to let the statistical edge play out over time.

This is the path to consistent profitability – not the illusion of perfect trades, but the reality of a well-designed system executed with unwavering discipline.
추천 제품
Desi Bulls PA King Pro
Muhammad Bilal Hussain Khan Muhammad
Desi Bulls PA King Pro — Pure Naked Price Action Sniper Indicator Desi Bulls PA King Pro is an institutional-grade, 100% NON-REPAINTING Naked Price Action indicator designed for precision scalping on Gold (XAUUSD) and Bitcoin (BTCUSD) on the M5 and M15 timeframes. Unlike conventional indicators that clutter your chart with lagging moving averages, RSI, or stochastics, PA King Pro uses pure candlestick geometry, fractal liquidity sweeps, and macro trend flow to identify high-probability instit
MTF VWAP Indicator - Quick Overview   This indicator shows you where institutional money is flowing across multiple timeframes using Volume Weighted Average Price (VWAP) to identify high-probability trading zones. New version has VWAP bands plotting capability if user enabled and display panel (whose background changes colour on confluence) can be toggled on/off.      What It Actually Does:     1. Tracks Smart Money Levels: - Shows Daily, Weekly, and Monthly VWAP lines where big players (banks,
Scan a fixed list of assets (Ibovespa) in the chosen timeframe (TimeFrame). For each pair and for various periods. Calculate a regression model between the two assets (and, if desired, using the bova11 index as a normalizer). Generate the spread of this relationship, its mean, standard deviation, speculative deviation, and betas (B1 and B2). Apply an ADF test without exclusion (cointegration/stationarity). Calculate the Z-score of the current exclusion (how many standard deviations are away from
FREE
Moving VVC mt5
Andriy Sydoruk
The   Visual Volatility Clustering   indicator clusters the market based on volatility. The indicator does not redraw and gives accurate data, does not use closing prices. Uses the opening prices or the highs or lows of the previous completed bar. Therefore, all information will be clear and unambiguous. The essence of the indicator is to divide the price market into certain areas according to a similar type of volatility. This can be done in any way. In this example, the indicator is configure
Mean Volume indicator for MT5
Renaud Herve Francois Candel
Mean Volume Most indicators are based on price analysis. This indicator is based on volume. Volume is overlooked piece of information in most trading systems. And this is a big mistake since volume gives important information about market participants. Mean Volume is an indicator that can be used to spot when volume is above average. It usually means that institutional traders are active. Peak in volume can be used to confirm an entry since increased volume can sustain the move in one or anot
Weis Wave Scouter
Jean Carlos Martins Roso
Weis Wave Scouter는 MetaTrader 5용으로 개발된 혁신적인 지표로, Wyckoff 방법론과 VSA(Volume Spread Analysis)의 검증된 원칙을 결합했습니다. 높은 정확성과 깊이 있는 분석을 원하는 트레이더를 위해 설계되었으며, 누적 거래량 파동 분석을 통해 시장을 전술적으로 읽고 추세 반전 및 지속의 핵심 포인트를 식별하는 데 도움을 줍니다. 이 지표는 선명한 시각적 인터페이스를 제공하며, Classic, NightVision, OceanBreeze 등 다양한 테마의 사용자 지정 가능한 색상 히스토그램을 통해 상승 및 하락 파동을 시각화합니다. 주요 기능에는 거래량 급증 감지, 낮은 활동 영역(DeadZone) 식별, 거래량 기반 파동 반전 경고 설정이 포함되어 있습니다. 또한 노력 대비 결과 분석, 원인과 결과 분석, 수요와 공급 분석 등 Wyckoff 및 VSA 이론의 핵심 요소를 지원합니다. Brick Size, Volume Scale Fact
VWAP Sniper Reversal Pro
Charles Mwangi Ndungu
VWAP Sniper Reversal Pro is an MT5 reversal and pullback indicator combining Volume-Weighted Average Price (VWAP), dual-layer ATR volatility bands, volume exhaustion spikes, and RSI momentum filters for Forex, Gold (XAUUSD), Indices, and Crypto. Designed for scalping, day trading, and swing trading, this tool identifies market turning points when price becomes overstretched from fair value, calculating all confirmed signals strictly on completed bars with zero historical repainting. Core 4-Facto
IC Flat Pro The True Math
Aruncharan Ganapathy Sivakumar
IC FLAT PRO – THE TRUE MATH   Early Adopter Pricing Secure IC FLAT PRO – THE TRUE MATH at the current launch price. Once the first 10 purchases  have been sold, the price will increase by USD 300 . Institutional-Grade Market Structure Analysis for MetaTrader 5 IC FLAT PRO – THE TRUE MATH is a premium institutional-grade market structure indicator developed for serious traders who demand precision, consistency, and high-quality trade opportunities. Built using advanced mathematical algorithms
ZigZag Market Structure Breakout Pro ZigZag Extras Display BreakOut points is a MetaTrader 5 indicator for traders who use ZigZag, breakout points, market structure, BOS, CHoCH, swing high, swing low, support and resistance, and higher timeframe bias in their trading analysis. Main Benefits Displays confirmed ZigZag swing highs and swing lows Marks BOS Up, BOS Down, CHoCH Up and CHoCH Down Shows Depth Highest High and Depth Lowest Low lines Adds HH, HL, LH and LL structure labels Includes HTF bi
VOLUME PROFILE SAF-XII MT5용 전문가급 마켓 프로파일 분석 도구 (그리드 스타일 트레이더를 위한 드림 인디케이터) 볼륨 프로파일(Volume Profile)이란? 볼륨 프로파일은 단순히 '시간'에 따른 거래량을 보여주는 일반 지표와 달리, 특정 '가격 수준'에서의 거래 활동을 표시하는 전문 기관용 도구입니다. 설정한 기간 내에 거래가 '어디서' 발생했는지를 시각화하여 다음을 식별할 수 있도록 돕습니다. 가치 영역 (VAH/VAL) – 전체 거래의 대부분이 발생한 가격대. 제어 지점 (POC) – 거래량이 가장 많이 집중된 단일 가격 수준. 유동성 불균형 – 각 가격대에서의 매수(Bull) vs 매도(Bear) 지배력. 지지/저항 – 실제 거래 활동에 기반한 자연적인 가격 지지 및 저항선. 3가지 작동 모드 – "설정 후 방치(Set and Forget)" 가능 VP_MANUAL (스윙 트레이딩 및 주요 레벨 분석) 사용자가 수직선을 드래그하여 분석 범위를 직접
WickAndBody Volume Flow
Henry Armando Baltazar
WickAndBody Volume Flow v5.2 Order Flow Analysis through Candle Segmentation The WickAndBody Volume Flow is an advanced diagnostic tool for MetaTrader that allows traders to "see" inside every Japanese candlestick. Unlike conventional volume indicators, this algorithm utilizes Multi-Timeframe (MTF) technology to break down real volume and determine exactly how much capital was traded in the wicks versus the candle body . Key Features Volume Detection: Uses lower timeframe data (M1/M5) to reconst
FREE
Color Histogram Volume Set
Ricardo Almeida Branco
Do you use volume in your reading of the market? Certainly many traders use it, and do not imagine operating without it. The Color Histogram Volume Set indicator allows the user to choose the value that he considers interesting to monitor. When you pass this you will have visual confirmation and if you want you will also have the audible alert that is given by the indicator. Of course, there are other ways to try to find a high volume, such as assessing whether the volume is above av
Blahtech Market Profile MT5
Blahtech Limited
5 (10)
Was: $249  Now: $99   Market Profile defines a number of day types that can help the trader to determine market behaviour. A key feature is the Value Area, representing the range of price action where 70% of trading took place. Understanding the Value Area can give traders valuable insight into market direction and establish the higher odds trade. It is an excellent addition to any system you may be using. Inspired by Jim Dalton’s book “Mind Over Markets”, this indicator is designed to suit the
Key level wedge MT5
Presley Annais Tatenda Meck
The   Key level wedge MT5   indicator automatically draws rising wedge pattern and falling wedge pattern for you on the chart. This pattern is really good when used as a confirmation entry at key support & resistance, supply & demand and reversal zones. Advantages  The   Key level wedge MT5   block DOES NOT RE-PAINT, giving you confidence when a signal appears and also helps when looking back.  The   Key level wedge MT5   includes an on/off button on the chart to easily keep the charts clean
OrderFlow St AutoPOC Pro v8
Sergio Millares Raposo
ORDER FLOW STRUCTURE AUTOPOC PRO Order Flow Structure AutoPOC Pro is a MetaTrader 5 market analysis indicator that combines market structure, Order Flow, Volume Profile, POC, Value Area, liquidity, FVG, Order Blocks, daily levels, session analysis and risk planning in one visual workspace. The indicator is designed for traders who want to analyze price action and market participation without relying on multiple separate indicators. It does not execute trades automatically. All trading decisions
TradeAQ
Guo Sheng Zhao
LuoMo Volume & Price Structure 8.98 A multi-function chart indicator for   MetaTrader 4 and MetaTrader 5 , designed to display key volume, volatility, sentiment, and price-structure information directly on the main chart. Main Features Volume and price-based Support & Resistance Volume spike and exhaustion signals ATR volatility expansion alerts Volume Profile with HVN and LVN Bullish and bearish sentiment distribution Developing or fixed POC VAH and VAL levels Supply and Demand zones Volume-wei
Indicator LTS for MT5 (Level + Trends + Speed) The LTS indicator was specially created for quick analysis of consolidations on the chart, which greatly facilitates decision-making when trading. LTS marks resistance and gives information about the forces affecting it, as well as the current speed and average travel. The indicator is easily customizable and can analyze any timeframe.    LTS uses a unique trend analysis algorithm based on 4 parameters from global to local.
IBI Vwap
Brahim Eljaziri
IBI Vwap draws the Volume-Weighted Average Price calculated on the real volume of the exchange , with ±1 and ±2 standard-deviation bands. What you see VWAP : the average price paid by all participants since the session start, weighted by real traded volume. Institutions use it as a benchmark: above it buyers are in control, below it sellers are. ±1 and ±2 standard-deviation bands : how far price stretches from its average. The ±2 band marks an extension zone. Short labels on the right: VWAP (wit
FREE
The VWAP indicator is our version of the popular Volume-Weighted Average Price indicator. The VWAP is the ratio between the value traded (price multiplied by the number of volume traded) and the total volume traded over a specific time period. As a result, it measures the average price of the instrument much better than the simple moving average. Although there are many ways to use the VWAP, most investors use it to calculate the daily average.  The indicator works in five modes: Moving  - In
Buy Sell Visual MTF V2 for MT5
Naththapach Thanakulchayanan
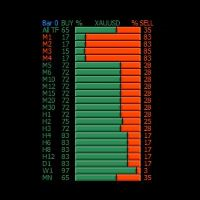
This MT5 indicator, Bull Bear Visual MTF V2, summarize the strength color graphic and percentages of power for both  Bull and Bear in current market emotion stage which will show you in multi timeframes (21) and sum of the total Bull and Bear power strength which is an important information for traders especially you can see all Bull and Bear power in visualized graphic easily, Hope it will be helpful tool for you for making a good decision in trading.
English Version Unlock the Power of Volume with Next-Generation Volume Profile This advanced Volume Profile indicator transforms your MetaTrader 5 chart into a powerful volume analysis tool. Unlike standard volume indicators that only show volume over time, this tool displays volume distribution across   price levels , allowing you to pinpoint exactly where the "big money" is trading. Why choose this indicator? Dynamic Price Bins:   Set your own precision (number of rows) to view volume clust
If you like this project, leave a 5 star review. Follow on TikTok: @quantum.trader       [ Any Symbol Can Be ADDED ]       DM me for adding any Pair symbol, crypto, index, stock or anything related. you can also DM me in TikTok [@quantum.trader] Works on [ EURUSD-GBPUSD-GBPJPY-USDJPY-XAUUSD-US30-BTCUSD-ETHUSD-SOLUSD ] This indicator calculate and draw the Prediction or Forecast the peaks of the current day ( forecast high - forecast low - forecast middle - forecast upper q - forecast lower q
这是一个基于前一个交易日的最高价、最低价和收盘价来计算的枢轴点指标,具体公式如下: 计算前一日的 Pivot Point (枢轴点): Pivot = (High + Low + Close) / 3 计算 Resistance 1 (R1) 、 Support 1 (S1) ​ 等: R1 = (2 * Pivot) - Low S1 = (2 * Pivot) - High R2 = Pivot + (High - Low) S2 = Pivot - (High - Low) 与市面上其他的枢轴点指标相比,该指标主要有以下4个特点: 1、可以修改交易日的开始时间; 2、可以设定支撑压力线的颜色; 3、可以设定是否显示各个支撑压力线对应的价格; 4、可以设定天数用以显示枢轴点的历史记录; 开发这个指标的最初目的是为了解决设定交易日开始时间的问题,接下来会进一步说明。基于计算公式,我们需要获得上一个交易日的最高价、最低价和收盘价,在夏令时,北京时间6点是开市时间,大多数交易平台服务器的0点对应的是北京时间的6点,但是香港的服务器6点才是对应的是北京时间的6点。如果你有多个平台,且存在
Volume Anchor Levels: support & resistance anchored to traded volume Most support and resistance tools draw a line at the exact high or low of a swing. But price rarely turns at the exact tip of a wick. It turns where the market actually traded. Volume Anchor Levels builds a rolling volume profile and pulls each swing toward the strongest nearby volume node, so you get levels that sit where trading really happened. Each level gets a 0-100 score , so you can see right away which levels are worth
VibeFox Volume — 전문 트레이더를 위한 거래량 분석 인디케이터 VibeFox Volume은 MetaTrader 5의 별도 서브윈도우에서 실행되는 전문가용 거래량 인디케이터입니다. 틱 볼륨의 컬러 히스토그램, 이동평균선, 그리고 거래량 스파이크 발생 시 가격 차트 위에 화살표 마커를 자동으로 그려줍니다. 직관적인 구조와 강력한 시각화로 시장의 모멘텀을 즉각적으로 파악할 수 있습니다. 거래량 히스토그램 서브윈도우에는 각 바의 틱 볼륨이 컬러 히스토그램으로 표시됩니다. 종가가 시가 이상인 강세 바는 Vol Up Color (기본값: LimeGreen), 종가가 시가 미만인 약세 바는 Vol Down Color (기본값: Tomato)로 표시됩니다. 각 색상의 투명도는 Vol Up Transparency 와 Vol Down Transparency 로 개별 조정할 수 있습니다. 히스토그램 하나만 봐도 매수세와 매도세의 균형을 직관적으로 읽을 수 있습니다. Vol MA와 Spike
Volume Profile For MT5
Abdelkhabir Yassine Alaoui
MT5용 Volume Profile VPVR Volume Profile VPVR은 고급 거래량 프로파일(Visible Range)을 차트에 직접 표시하도록 설계된 강력하고 고성능의 MetaTrader 5 지표입니다. 거래 활동이 집중된 영역을 시각화하여 시장 구조에 대한 심층적인 통찰력을 제공하며, 트레이더가 주요 가격대를 정확하게 파악할 수 있도록 도와줍니다. 이 지표는 가격대별 거래량 분포를 동적으로 분석하고 차트에 상세한 히스토그램을 직접 표시하여 시장 수용, 거부 영역 및 유동성 밀집 지역을 한눈에 파악할 수 있도록 합니다. 주요 기능 • Visible Range 및 Fixed Range 모드 VPVR(표시되는 캔들에 따라 자동 조정) 모드와 사용자 지정 범위 모드 간에 원활하게 전환하여 더욱 정밀한 분석을 수행할 수 있습니다. • Point of Control(POC) 거래량이 가장 많은 가격대, 즉 시장의 관심이 가장 높은 가격대를 자동으로 감지하고 강조 표
VWAP Bands
Rafael Caetano Pinto
This indicator uses VWAP and projects this VWAP into up to 3 levels, shifted by a percentage of the chart's symbol. How to configure: Choose the symbol and desired graphic time Set the start time of the symbol (in bovespa, WIN and WDO start at 9 o'clock). This time is used as the cutoff reference for VWAP. Check which VWAP period fits the chart better: Ideally, a period when VWAP is not too distant from the chart Set percentage levels: Ideally, you should set levels based on history, so that le
Volume Profile Canvas
Mauro Italo Gaspari
Volume Profile Canvas - Professional Volume Profile Indicator for MetaTrader 5 DESCRIPTION Volume Profile Canvas is a professional volume profile indicator for MetaTrader 5 that renders directly on the chart using a high-performance Canvas engine. It calculates and displays the volume distribution across price levels, identifying the Point of Control (POC), Value Area High (VAH) and Value Area Low (VAL) in real time. This is a pure analysis tool. It does not trade. It gives you an instant vi
Swiss VWAPsimple
Terence Gronowski
4.8 (5)
Swiss VWAPsimple Motivation Did not find free VWAP that works, the one that I found craseh. So I created a VWAP which calculates values only for the actual day. So computer resouces are not over stressed. What is VWAP, how is it used?  VWAP stands for Volume Weighed Average Price, it calculates the running sum of tick volume and the runnung sum of price times tickvolume. The division of these sums result in a weighed price (Sum P*V/Sum V). The calculation starts normally at midnight. The values
FREE
MR Volume Profile 5
Sergey Khramchenkov
The "MR Volume Profile 5" indicator is a charting tool that displays trading volume at different price levels rather than time intervals. A key concept in volume profile is the point of control (POC)—the price level with the highest volume traded during the session or time range. While tools like VWAP or OBV provide volume trends, the "MR Volume Profile 5" indicator offers granular detail about where the most market activity occurs at specific price levels. This makes it a more precise tool for
이 제품의 구매자들이 또한 구매함
Trend Sniper X
Sarvarbek Abduvoxobov
4.86 (44)
Trend Sniper X 는 트레이더가 추세 방향과 잠재적 반전 지점을 명확하고 정확하게 포착할 수 있도록 도와주는 MetaTrader 5용 멀티 타임프레임 추세 추종 지표입니다. MT4용: https://www.mql5.com/en/market/product/193245 가격 정보: 현재 가격은 프로모션 할인가이며, 향후 업데이트 및 새로운 기능이 출시됨에 따라 변동될 수 있습니다. 보너스 혜택: 본 지표 전용 무료 자동매매 Assistant EA를 받으시려면 구매 후 작성자에게 메시지를 보내주시기 바랍니다. Code2Profit 채널 멀티 타임프레임 분석으로 시장을 마스터하세요! Trend Sniper X로 승률을 극대화하는 방법: 핵심 규칙 및 세션 팁 기술 사양 플랫폼 MetaTrader 5 지표 유형 멀티 타임프레임 추세 지표 운용 타임프레임 모든 차트 타임프레임 지원, 독립적으로 선택 가능한 상위 타임프레임(M1–MN1) 주요 상품 외환, 금(XAUUSD) 및 기타 C
새로운 왕의 등장 - 인디케이터 + 주문 관리 표시(TP1 + TP2 + TP3) + 선택형 텔레그램 시그널 전송 기능 포함 (무료) (완전한 트레이딩 및 시그널 시스템) 골드를 위한 최고의 EA: Gold Slayer 이 인디케이터는 고급 전략, 사용자 지정 가능한 주문 관리 시스템, 그리고 엔벨로프 확장을 결합한 평균 회귀(mean reversion) 시스템을 포함하고 있습니다. 또한 RSI와 같은 여러 지능형 확인 필터를 통해 높은 확률의 반전 진입 구간을 포착하여 BUY 및 SELL 시그널을 제공합니다. 단순히 거래 방법만 배우는 것이 아니라, 여러 포지션을 효과적으로 관리하고 이전에 수익 중인 오픈 포지션으로 손실 거래를 커버하는 방법까지 익힐 수 있습니다. M5 전용으로 설계 및 최적화되었으며, 유동성이 풍부해 시그널이 더 깔끔하고 신뢰도 높은 BTCUSD와 XAUUSD에서 뛰어난 성능을 발휘합니다. 이 인디케이터는 ATR 기반으로 자동 계산된 진입가, 손절가, 익절가와
Smart Trend Trading System — MetaTrader 5 구매 후 MQL5에서 저에게 메시지를 보내시면 Smart Universal Expert Advisor를 무료로 받으실 수 있으며, 온라인 강좌, PDF 매뉴얼 및 비공개 그룹 이용 권한도 함께 제공됩니다. STTS는 추세 방향, 진입·청산 신호, 반전 구간, 주요 가격 수준을 차트에 모아 보여줍니다. 시스템을 참고해 수동으로 거래하거나, 별도의 호환 EA를 연결하여 선택한 설정에 따라 자동으로 거래를 실행할 수 있습니다. 하나의 시스템, 네 가지 트레이딩 접근법 STTS의 트레이딩 접근법은 크게 네 가지로 나뉩니다. • 스캘핑 — 단기 신호와 시장 움직임을 살펴봅니다. • 추세 매매 — 방향을 평가하고 추세 안에서 기회를 찾습니다. • 반전 매매 — 잠재적인 전환 구간과 방향 변화를 파악합니다. • 거래량 매매 — 거래량 기반 정보로 시장 활동을 평가합니다. 진입·청산 화살표, 추세 정보, 지지·저항 수
Entry Points Pro for MT5
Yury Orlov
4.52 (153)
Entry Points Pro는 주문을 넣기 전에 어디에서 진입하고, 스탑을 어디에 두고, 어떤 랏으로 거래할지 보여 줍니다. 가격 지금 199 USD이며, 이 가격으로는 8카피입니다. 이후 가격은 249 USD, 최종 가격은 349 USD입니다. 저는 시장에서 트레이딩으로 돈을 벌고 그것을 보여 드립니다. 그래서 이 인디케이터를 모두에게 팔 필요가 없습니다. 스스로 생각하는 트레이더를 위한 도구이지, 마법 버튼이 아닙니다. 돌파가 없으면 거래도 없습니다. 회색 화살표는 취소된 신호입니다. 가격이 신호 캔들을 돌파하지 못했으므로 진입도 손실도 없습니다. 화살표는 캔들이 마감될 때 나타나며 리페인팅되지 않습니다. 설정은 두 가지: 예치금과 거래당 리스크. 결제 전에 확인하세요: 무료 데모는 MT5 전략 테스터에서 작동하며 2분이면 됩니다. 구매 후에는 제가 직접 설정을 도와 드리겠습니다. 2019년, 저는 이 지표가 무엇을 할 수 있는지 전 세계에 보여 주었습니다. 실계좌에서 지표의
M5 Sniper
MeanFX
5 (4)
당신의 트레이딩 우위를 한눈에 확인하세요! M5 Sniper 는 MeanFX의 새로운 지표입니다. 정확한 트레이딩 신호 와 적응형 TP/SL 레벨 을 결합하여, 결과적으로 가능한 최고의 통계적 트레이딩을 만들어냅니다! 5회 구매마다 가격이 인상되며, 다음 가격은 69$입니다. 구매 후 저에게 메시지를 보내주시면 팁/가이드와 보너스 EA를 제공해 드립니다. 무엇이 이 지표를 특별하게 만들까요? Gold XAUUSD에서 검증된 통계적 성과 ( 거의 모든 자산에서 작동 하며, 일관된 결과 없이 모든 것을 다루려고 하기보다는 하나의 타임프레임을 완전히 익히는 데 집중합니다) 각 심볼당 하루 1~8회의 트레이드 와 높은 승률을 제공하며, 모든 통계적 우위를 우리의 편으로 가져갑니다. 차트에는 확인된 BUY 및 SELL 신호만 표시됩니다. 각 트레이드에 대해 지표가 생성하는 적응형 TP 및 SL 레벨 평균 승률 75%+ 평균 Signal Ratio 최소 1.1+ 알람 및 알림이 휴대폰 으로도
Gann Made Easy MT5
Oleg Rodin
5 (13)
Gann Made Easy 는 mr.의 이론을 사용하여 최고의 거래 원칙을 기반으로 하는 전문적이고 사용하기 쉬운 Forex 거래 시스템입니다. W.D. 간. 이 표시기는 Stop Loss 및 Take Profit Levels를 포함하여 정확한 BUY 및 SELL 신호를 제공합니다. PUSH 알림을 사용하여 이동 중에도 거래할 수 있습니다. 구매 후 거래 방법 안내 및 유용한 추가 지표를 무료로 받으시려면 저에게 연락주세요! 아마도 Gann 거래 방법에 대해 이미 여러 번 들었을 것입니다. 일반적으로 Gann의 이론은 초보자 거래자뿐만 아니라 이미 거래 경험이 있는 사람들에게도 매우 복잡한 것입니다. Gann의 거래 방식은 이론적으로 적용하기 쉽지 않기 때문입니다. 나는 그 지식을 연마하고 Forex 지표에 최고의 원칙을 적용하기 위해 몇 년을 보냈습니다. 표시기는 적용하기가 매우 쉽습니다. 차트에 첨부하고 간단한 거래 권장 사항을 따르기만 하면 됩니다. 지표는 지속적으로 시장 분석
SuperScalp Pro
Van Minh Nguyen
4.54 (37)
SuperScalp Pro - Professional Multi-Layer Confluence Scalping System SuperScalp Pro는 기존 Supertrend에 여러 지능형 확인 필터를 추가하여 기능을 강화한 고급 스캘핑 지표입니다. 잘못된 신호를 크게 줄이면서 성공 가능성이 더 높은 Buy/Sell 거래 기회를 식별하는 데 도움을 줍니다. 명확한 Buy 및 Sell 화살표가 차트에 직접 표시되며, ATR 기반 Stop Loss 및 Take Profit 레벨도 실시간으로 자동 계산됩니다. 구매 후 MQL5 메시지로 저에게 연락하시면 SuperScalp Pro Auto Trader EA를 무료로 받으실 수 있으며, 사용자 가이드와 비공개 그룹 이용 권한도 제공됩니다. 권장 설정 파일 다운로드: [Set File] 전체 문서는 제품 블로그에서 확인할 수 있습니다: [User Guide] 업데이트를 받으려면 공식 채널에 참여하세요: [Official Channel]
Ultra Indicator
Ihor Otkydach
5 (1)
ULTRA는 “올인원” 방식으로 작동하는 기술적 지표로, 시장을 독자적으로 분석하고, 매매 신호를 생성하며, 손절매 주문 설정 수준을 표시하고, 이익을 실현하거나 손실을 최소화하기 위해 포지션을 청산해야 할 시점을 제안합니다. 다시 말해, 시장을 분석하는 법을 모르거나, 가격 수준(손절매를 어디에 설정할지)을 파악하지 못하거나, 자금 관리에 어려움을 겪더라도 상관없습니다. ULTRA가 그 모든 것을 대신 해줄 테니까요! 구매자 특전 : ULTRA 지표를 구매하신 후, 저에게 비공개 메시지를 보내주시면 “ULTRA BOT”을 무료 선물로 드립니다. 이 도구는 해당 지표의 신호를 바탕으로 개설한 거래를 관리하는 데 도움을 주는 특별한 도구입니다(각 거래에 대해 손절매를 설정하고, 최상의 결과를 얻을 수 있도록 전략의 규칙에 따라 거래를 자동으로 청산해 줍니다).  또한 구매자분들께 다양한 자산에 바로 적용할 수 있는 설정값을 제공해 드리고 있으며, 이를 통해 지표가 최대 효율로 작동할
Gold Trend Coach MT5
Cristhian Alexander Gaibor Cuasquer
4.27 (11)
MetaTrader 5용 골드(XAUUSD) 매수·매도 신호, 리페인팅 없음. 모든 신호에 손절가와 세 개의 익절가가 함께 나옵니다. BOS와 CHoCH를 활용한 Smart Money Concepts 필터로 구조를 거스르지 않고 구조를 따라 매매합니다. 패널의 실시간 멘토가 진입부터 TP3까지 모든 단계를 안내합니다. 알림은 휴대폰과 나만의 Telegram 채널로 바로 옵니다. 이것이 Gold Trend Coach입니다. 이제 혼자 매매하지 마세요. 구매 시 무료 구매자 키트 제공: 1. Telegram Alert Bridge: 신호가 차트 스크린샷, 일일 리포트와 함께 나만의 Telegram 채널로 전송됩니다. 2. 사용자 매뉴얼과 설정 가이드. 받는 방법: 키트는 다운로드 파일에 들어 있지 않습니다. 구매 후 MQL5 메시지로 연락 주시면 당일에 보내드립니다. $39, $45 런칭가 물량은 매진되었습니다. 지금은 다음 10카피까지 $59, 이후 $79입니다. 먼저, 솔직한 이야
GoldenX Entry MT5
VividMind Digital Solutions
5 (17)
GoldenX Entry는 MT5용 인디케이터로, 적응형 Smart Entry Trend 알고리즘, 신호 스코어링 시스템, 시장 레짐 감지 기능, 그리고 변동성 필터를 포함합니다. 각 신호에는 계산된 진입 레벨, 3개의 익절(TP1, TP2, TP3) 레벨, 그리고 손절(Stop-Loss) 레벨이 포함됩니다. 이 인디케이터는 다양한 시장 환경에 적응하도록 설계된 다중 분석 레이어 구조 위에 구축되어 있으며, 내장 최적화기와 통계 추적 시스템을 결합합니다. 또한 Risk-to-Reward(RR) 지표와 과거 거래 행동 기반의 정량 분석을 제공합니다. 시작은 간단합니다 — 선택한 타임프레임에서 최적화기를 실행한 뒤 차트에서 바로 인디케이터를 사용하면 됩니다. 핵심 기능 GoldenX Entry는 하나의 차트에서 신호 엔진, 트레이드 관리 기능, 그리고 과거 통계 추적을 통합합니다: - 내장 최적화기: 최적화기는 차트에서 원클릭으로 실행됩니다. 200개의 파라미터 조합을 두 단계 탐색
SMC Intraday Formula
VividMind Digital Solutions
5 (26)
먼저 솔직하게 말하겠습니다. 어떤 인디케이터도 단독으로 당신을 수익성 있게 만들어주지 않습니다. 누군가 그렇게 말한다면, 그는 당신에게 꿈을 파는 것입니다. 완벽한 매수/매도 화살표를 보여주는 모든 인디케이터는 완벽하게 보이도록 만들 수 있습니다 — 단지 올바른 과거 구간을 확대하고 승리한 거래만 캡처하면 됩니다. 우리는 그렇게 하지 않습니다.  SMC Intraday Formula는 도구입니다. 시장 구조를 읽고, 가장 높은 확률의 가격 구간을 표시하며, 현재 스마트 머니의 흐름이 어떻게 보이는지 아주 단순한 언어로 보여줍니다. 최종 결정은 여전히 당신이 합니다. 실행도 당신이 합니다. 하지만 이제는 희망이 아니라 정확성으로 거래하게 됩니다. 우리는 이 인디케이터를 지난 약 3년 동안 골드(XAUUSD) 및 주요 외환 통화쌍의 데이 트레이딩 스캘핑에 사용해 왔습니다. M1, M5, M15, M30에서 우리의 핵심 도구입니다. 이 도구는 미래를 예측하려 하지 않습니다 — 지금 형성
Boba Analysis Suite
Trade Ready Solutions LLC
5 (2)
Boba Analysis Suite Boba Analysis Suite는 MetaTrader 5용 분석 지표입니다. 시장 구조, 주요 가격 영역, 전반적인 시장 상황을 하나의 차트 화면에 통합하여 표시합니다. 트레이더이자 트레이딩 코치로서의 실무 경험을 바탕으로 개발되었으며, 시장 방향 평가, 주요 가격 수준 식별, 여러 시간대의 종합적인 분석 등 체계적인 분석 과정을 지원합니다. 시장 맥락을 고려한 분석 개별 신호의 의미는 시장 상황에 따라 달라집니다. Boba Analysis Suite는 현재 차트 상황을 더 넓은 시장 구조와 연결하고, 사전에 정한 규칙에 따라 매매 아이디어를 검토할 수 있도록 돕습니다. 주요 분석 기능은 다음과 같습니다. 추세 및 시장 구조: 시장 방향과 관련 구조적 맥락을 평가합니다. 주요 가격 영역 및 수준: 추가 분석이 필요한 중요한 영역을 차트에 시각적으로 표시합니다. 여러 시간대: 서로 다른 시간대의 정보를 통합하여 전반적인 시장 상황을 평가합니다.
FX Power MT5 NG
Daniel Stein
5 (33)
FX Power: 통화 강세 분석으로 더 스마트한 거래 결정을 개요 FX Power 는 어떤 시장 상황에서도 주요 통화와 금의 실제 강세를 이해하기 위한 필수 도구입니다. 강한 통화를 매수하고 약한 통화를 매도함으로써 FX Power 는 거래 결정을 단순화하고 높은 확률의 기회를 발견합니다. 트렌드를 따르거나 극단적인 델타 값을 사용해 반전을 예측하고자 한다면, 이 도구는 귀하의 거래 스타일에 완벽히 적응합니다. 단순히 거래하지 말고, FX Power 로 더 스마트하게 거래하세요. 1. FX Power가 거래자에게 매우 유용한 이유 통화와 금의 실시간 강세 분석 • FX Power 는 주요 통화와 금의 상대적 강세를 계산하고 표시하여 시장 역학에 대한 명확한 통찰력을 제공합니다. • 어떤 자산이 앞서고 있고 어떤 자산이 뒤처지는지 모니터링하여 보다 현명한 거래 결정을 내릴 수 있습니다. 포괄적인 멀티 타임프레임 뷰 • 단기, 중기 및 장기 타임프레임에서 통화와 금의 강세를
M1 Sniper MT5
Oleg Rodin
5 (7)
M1 SNIPER 는 사용하기 쉬운 거래 지표 시스템입니다. M1 시간대에 맞춰 설계된 화살표 지표입니다. 이 지표는 M1 시간대 스캘핑을 위한 단독 시스템으로 사용할 수 있으며, 기존 거래 시스템의 일부로도 사용할 수 있습니다. 이 거래 시스템은 M1 시간대 거래용으로 특별히 설계되었지만, 다른 시간대에도 사용할 수 있습니다. 원래는 XAUUSD와 BTCUSD 거래를 위해 이 방법을 설계했지만, 다른 시장 거래에도 유용하다는 것을 알게 되었습니다. 이 지표의 신호는 추세 방향과 반대로 거래될 수 있습니다. 저는 지표의 신호를 활용하여 양방향으로 거래할 수 있도록 돕는 특별한 거래 기법을 알려드립니다. 이 방법은 특별한 동적 지지선과 저항선 가격 영역을 활용하는 것을 기반으로 합니다. 구매하시면 M1 SNIPER 화살표 지표를 바로 다운로드하실 수 있습니다. 또한, 아래 스크린샷에 표시된 Apollo Dynamic SR 지표는 M1 SNIPER 도구를 사용하는 모든 사용자에게 무료로
FiboSniper Pro
Van Minh Nguyen
5 (4)
FiboSniper Pro – Multi-Filter Fibonacci System with Auto SL/TP and Control Panel FiboSniper Pro는 동적 Fibonacci Envelopes와 여러 확인 필터를 결합하여 선별된 Buy 및 Sell 신호를 생성하는 기술적 지표입니다. Fibonacci 레벨은 Moving Average와 ATR을 기반으로 계산된 후 ADX, EMA, RSI, ATR, Volume, Time 및 Candle 구조를 통해 필터링됩니다. 이 지표는 ATR 기반의 자동 Stop Loss 및 Take Profit 레벨을 차트에 직접 표시하며, 빠른 설정 조정을 위한 인터랙티브 Control Panel을 제공합니다. 구매 후 MQL5 메시지로 저에게 연락하시면 Auto Trader X를 무료로 받으실 수 있으며, 이 지표의 거래 신호를 자동화하는 방법에 대한 안내도 제공됩니다. User Guide 및 Set Files: [Click here
Apex Patterns PRO 인디케이터 구매 시 - 기반 Expert Advisor 무료 제공. 자체 최적화 차트 패턴 및 브레이크아웃 분석 시스템 기존의 패턴 스캐너는 고정된 파라미터에 의존하므로 시장 변동성과 구조가 변화할 때 성능이 저하되는 경우가 많습니다. Apex Patterns PRO는 구조적 차트 패턴 인식, 모멘텀 필터링, 통계적 자체 최적화를 하나의 분석 프레임워크로 결합하여 변화하는 시장 환경에 적응하도록 설계되었습니다. 적응형 스캐닝 엔진 자체 최적화 패턴 모드 최근 과거 데이터를 바탕으로 적절한 패턴 파라미터를 자동으로 탐색하여, 정적인 설정 대신 현재 시장 행보에 맞춰 인디케이터의 구조 감지 방식을 적응시킵니다. 스마트 브레이크아웃 필터링 클래식 패턴 인식과 모멘텀, 거래량, 프라이스 액션 지표를 결합합니다. 모든 브레이크아웃을 동일하게 다루는 대신, 시장의 기저 구조를 평가하여 현재 통계적 환경에 부합하는 셋업을 식별합니다. 주요 기능 리페인트 없는 고
Auto Optimized SpeedAngle 은 지속적인 워크포워드 최적화(Walk-Forward Optimization, WFO)를 통해 곡선 적합(curve-fitting)을 제거한 기관 수준의 모멘텀 벡터화 시스템입니다. 시장 체제가 바뀔 때 성능이 떨어지는 정적 입력에 의존하는 대신, 이 지표는 표본 외(Out-of-Sample, OOS) 검증을 사용하여 매개변수를 동적으로 재보정하며, 표시되는 신호가 과거의 우연이 아닌 진정한 통계적 우위를 나타내도록 보장합니다. 핵심 기관용 프레임워크 워크포워드 최적화 엔진: 핵심 알고리즘은 수천 가지의 룩백(lookback) 및 임계값 조합을 지속적으로 스캔하며, 데이터를 인샘플(in-sample)과 표본 외(out-of-sample) 세트로 엄격하게 분리합니다. 미지의 데이터 환경에서 수학적 우수성이 증명된 경우에만 새로운 매개변수 구성을 채택합니다. 정량적 목적 함수: 순수한 총이익을 쫓는 대신, 최적화 엔진은 기관 수준의 안정성
SQN Max indicator for MT5 by ITC
Renaud Herve Francois Candel
Sqn Max Indicator Sqn Max is an exclusive indicator to trade the market with high effectiveness. The indicator is based on price action, volatility and trend. This indicator is as simple as possible but not too simple. The indicator can generate alerts to ease the trading process. You don't have to stay all day in front of your screen. The indicator can be used with any class of assets and with any time frame. It is possible to achieve better results trading our list of selected assets. We achi
다음 업데이트 — 버전 2.52 곧 출시! [신규] 시장 분석 및 트레이딩 워크플로를 향상시키기 위해 설계된 4가지 주요 신규 기능을 기대해 주세요. 트레이딩 요구 사항을 충족하도록 설계된 4가지 새로운 기능으로 시장 분석을 한 단계 더 발전시킵니다. 다음 기능을 소개합니다: 1. TRADE OVERVIEW DASHBOARD 2. CONFLUENCE AT ZONE 3. STRONG & WEAK HIGH/LOW 4. OTE 1. TRADE OVERVIEW DASHBOARD 시장 전체 상황을 더 쉽게 파악할 수 있도록 도와주는 대시보드입니다. 트레이딩 의사결정을 지원하는 가이드를 제공하며, 하나의 화면에서 시장을 분석하고 체계적으로 트레이딩을 계획할 수 있도록 도와줍니다. 멀티 타임프레임 시장 개요 (Multi-Timeframe Market Overview) 시장 방향과 가격 구조를 더욱 명확하게 파악 시장 상황을 빠르게 확인 체계적인 시장 분석 및 진입 계획을 위한 가이드 2. CO
Divergence Bomber
Ihor Otkydach
4.89 (94)
이 지표를 구매하신 분께는 다음과 같은 혜택이 무료로 제공됩니다: 각 거래를 자동으로 관리하고, 손절/익절 수준을 설정하며, 전략 규칙에 따라 거래를 종료하는 전용 도우미 툴 "Bomber Utility" 다양한 자산에 맞게 지표를 설정할 수 있는 셋업 파일(Set Files) "최소 위험", "균형 잡힌 위험", "관망 전략" 모드로 설정 가능한 Bomber Utility의 셋업 파일 이 전략을 빠르게 설치, 설정, 시작할 수 있도록 돕는 단계별 영상 매뉴얼 주의: 위의 모든 보너스를 받기 위해서는 MQL5 개인 메시지 시스템을 통해 판매자에게 연락해 주세요. 독창적인 커스텀 지표인 “Divergence Bomber(다이버전스 봄버)”를 소개합니다. 이 지표는 MACD 다이버전스(괴리) 전략을 기반으로 한 올인원(All-in-One) 거래 시스템입니다. 이 기술 지표의 주요 목적은 가격과 MACD 지표 간의 다이버전스를 감지하고, **향후 가격이 어느 방향으로 움직일지를 알려주
Power Candles MT5
Daniel Stein
4.58 (12)
Power Candles V3 - 자체 최적화 강도 지표 파워 캔들 V3는 적용된 모든 차트에서 통화 및 상품의 강세를 실행 가능한 거래 계획으로 전환합니다. 단순히 캔들에 색상을 입히는 대신, 백그라운드에서 실시간 자동 최적화를 수행하여 현재 보고 있는 종목에 대한 최적의 손절매, 익절 및 신호 임계값을 제공합니다. 한 번의 클릭으로 실시간 거래에 적용할 수 있으며, 진입점, 손절매 및 익절 선이 정확한 가격에 맞춰 차트에 표시되고, 방향과 함께 알림이 발령됩니다. 이 도구는 Stein Investments 에코시스템의 일부입니다. 18개 이상의 도구와 함께 당신의 1대1 AI 트레이딩 멘토 Max.  항상 대기 중, 모든 인디케이터를 깊이 있게 이해, 무언가를 차근차근 생각해보고 싶은 순간에 도움을 줍니다.  https://stein.investments 에서 만나보세요 매 종가 바마다 3,000회 이상의 트레이딩 시뮬레이션. 9가지 강도 상태. 2가지 전략을 병렬로 테스트.
통화 강도 마법사는 성공적인 거래를 위한 올인원 솔루션을 제공하는 매우 강력한 지표입니다. 표시기는 여러 시간 프레임의 모든 통화 데이터를 사용하여 이 또는 해당 외환 쌍의 힘을 계산합니다. 이 데이터는 특정 통화의 힘을 확인하는 데 사용할 수 있는 사용하기 쉬운 통화 지수 및 통화 전력선의 형태로 표시됩니다. 필요한 것은 거래하려는 차트에 표시기를 부착하는 것뿐입니다. 표시기는 거래하는 통화의 실제 강세를 보여줍니다. 지표는 또한 추세와 거래할 때 유리하게 사용할 수 있는 구매 및 판매 거래량 압력의 극한값을 보여줍니다. 지표는 또한 피보나치에 기반한 가능한 대상을 보여줍니다. 표시기는 PUSH 알림을 포함한 모든 유형의 알림을 제공합니다. 구매 후 연락주세요. 나는 당신과 거래 팁을 공유하고 당신에게 무료로 훌륭한 보너스 지표를 줄 것입니다! 나는 당신에게 행복하고 유익한 거래를 기원합니다!
Atomic Analyst MT5
Issam Kassas
4.51 (65)
Atomic Analyst — MetaTrader 5 구매 후 MQL5에서 저에게 메시지를 보내시면 Smart Universal Expert Advisor를 무료로 받으실 수 있으며, 온라인 강좌, PDF 매뉴얼 및 비공개 그룹 이용 권한도 함께 제공됩니다. Atomic Analyst는 가격 움직임 분석, 추세 방향, 진입·청산 신호, 손절 수준, 여러 익절 수준을 차트에 모아 보여줍니다. 신호를 확인하고 매매 상황을 이해하세요 Atomic Analyst는 분석 결과를 명확한 시각 정보로 정리합니다. • 잠재적인 진입 기회를 확인할 수 있는 매수·매도 화살표. • 거래 계획에 도움이 되는 손절 수준과 여러 익절 수준. • 시장 방향을 평가할 수 있는 추세, 강도, 모멘텀 수치. • 더 넓은 시장 맥락을 비교할 수 있는 여러 시간대 분석. • 변화하는 시장 상황을 따라갈 수 있는 색상별 캔들과 알림. 신호와 보조 분석을 함께 검토한 다음, 해당 매매 상황이 자신의 거래 규칙에
Unix Scalper
Issam Kassas
4 (4)
Unix Scalper — MetaTrader 5 구매 후 MQL5에서 저에게 메시지를 보내시면 Smart Universal Expert Advisor를 무료로 받으실 수 있으며, 온라인 강좌, PDF 매뉴얼 및 비공개 그룹 이용 권한도 함께 제공됩니다. 매매 기회를 찾고, 거래 계획을 확인하고, 실행 방법을 선택하세요. UNIX Scalper는 시장 분석, BUY/SELL/WAIT 판단, Entry, Stop Loss, TP1 및 TP2 가격 수준을 하나의 정돈된 패널에 제공합니다. 신호와 거래 계획을 한눈에 • 명확한 판단: BUY, SELL 또는 WAIT. • 구체적인 가격 수준: Entry, Stop Loss, TP1 및 TP2. • 다중 시간대 개요: 패널의 여러 시간대 신호를 비교하세요. • 판단을 돕는 분석: 추세, 모멘텀, 거래량, 변동성, 지지와 저항, 시장 품질. • 다양한 레이아웃: Minimized, Compact, Standard 또는 Full. 신호와
Astral Structure
Ottaviano De Cicco
Astral Structure 셋업을 평가하고 초기 계획을 확인하세요. 출시 특별가 - $99. 출시 행사 종료 후 $149. 시장 구조 셋업에는 여러 질문이 따릅니다. 더 넓은 시각에서도 일치하는지, 스톱 기준은 어디인지, 목표는 어떻게 정하는지 살펴봐야 합니다. Astral Structure는 시장 구조를 바탕으로 판단하는 재량 트레이더를 위해 이 질문들을 한 작업 공간에 모아 줍니다. 관련 셋업에 집중하세요. 최근의 적격 셋업과 방향, 조건 충족 여부를 함께 검토하세요. 시간대 간 일치를 확인하세요. 평가 중인 셋업을 놓치지 않고 선택한 시간대의 값을 비교하세요. 초기 계획을 연결해 두세요. 각 요소를 따로 조합하지 않고 해당 셋업에 연결된 스톱 및 목표 기준값을 검토하세요. Structure를 사용하면 최근 조건을 충족한 셋업을 일관된 방식으로 검토할 수 있습니다. 맥락과 초기 가격 계획을 한곳에서 함께 확인하세요. 맥락 속에서 셋업 읽기 최신 BUY 또는 SELL 셋업, 해
Tokyo mt5 Indicator
Vasiliy Strukov
5 (15)
Tokyo Indicator는 추세 방향, 잠재적 거래 신호 및 시장 상황을 명확하고 시각적으로 보여줍니다. 색상으로 구분된 계단식 추세선은 강세 구간(파란색)과 약세 구간(자홍색)을 명확히 구별해 줍니다. 추세가 전환될 때 나타나는 방향성 화살표는 잠재적인 매수 및 매도 기회를 강조하여 보여줍니다. 통합 대시보드는 현재 신호, 시장 성향(bias), 모멘텀, 변동성, 신호 품질 등의 정보를 한눈에 파악할 수 있도록 구성되어 있습니다. 이를 통해 트레이더는 별도의 패널을 오갈 필요 없이 가격 움직임(price action)과 지표의 데이터를 동시에 분석할 수 있습니다. 깔끔한 차트 화면과 간결한 시장 개요를 제공하는 Tokyo Indicator는 체계적인 추세 분석과 거래 결정을 지원합니다. 모든 시간대와 다양한 자산(특히 금)에서 활용할 수 있습니다. 추세 방향, 잠재적 거래 신호 및 시장 상황을 명확하고 시각적으로 보여줍니다. 색상으로 구분된 계단식 추세선은 강세 구간(파란색)
Dynamic Forex28 Navigator MT5
Bernhard Schweigert
5 (1)
다중 통화 강도 및 모멘텀 지표 MT5 Dynamic Forex28 Navigator는 오랫동안 사랑받아 온 인기 지표들의 진화형으로, 다섯 가지의 힘을 하나로 결합했습니다. Advanced Currency Strength28 Indicator (리뷰 700개) Advanced Currency IMPULSE with ALERT (리뷰 530개) Currency Strength EXOTICS GOLD Impulse with Alert CS28 Combo Signals (최근 보너스) 지표 네 개를 따로 구매해 차트에 겹쳐 놓을 필요가 없습니다. 28개 Forex 페어의 강도, 이를 이끄는 시장의 모멘텀, 그리고 두 가지 모두의 알림이 하나의 강력한 지표로 통합되어 한 창, 한 차트에서 확인할 수 있습니다. 위 프로그램들은 MQL5 Market에서 1,200개 이상의 리뷰를 받았으며 2016년부터 MT4 커뮤니티의 필수 지표로 자리잡았습니다. Dynamic Forex28 Navigato
Scalper Vault MT5
Oleg Rodin
5 (1)
Scalper Vault는 당일 매매(intraday trading)에서 일관된 성과를 내고자 하는 트레이더를 위해 설계된, 강력하고 모든 기능을 갖춘 트레이딩 시스템입니다. 이 고정밀 지표는 외환(Forex) 및 바이너리 옵션 트레이더 모두에게 기관급 분석을 제공하는 독립적인 종합 트레이딩 시스템 역할을 합니다. 구매 후 저에게 연락해 주시면, 트레이딩 팁과 함께 특별한 보너스를 제공해 드립니다! Scalper Vault는 추측에 의존하거나 복잡한 수동 분석을 할 필요를 없애주며, 사용하기 쉬운 트레이딩 기법을 통해 오직 매매 실행에만 집중할 수 있도록 돕습니다. 정확한 추세 추종 신호: 핵심 알고리즘이 시장 구조를 분석하여, 지배적인 시장 추세 방향과 일치하는 고확률 신호만을 제공함으로써 잘못된 진입을 획기적으로 줄여줍니다. 정밀한 고점 및 저점 탐지: 시장의 움직임이 소진되는 지점을 스캔하여 잠재적인 반전 구간을 식별합니다. 간(Gann) 이론 기반의 매수/매도 구간: 수학적
Nexus Order Block Workspace
Sergejs Rozkalns
5 (2)
The same chart, read in the same order, every day. Structure, the nearest zone, where you sit in the range and which way the trend points — on screen at once, always in the same form. BUYER BONUS — SMC Nexus Scanner Pro. A multi-symbol scanner built on this indicator's data: one panel shows the trend side, active order blocks and BOS / CHoCH for many symbols at once. It comes at no extra cost — after your purchase, message me on MQL5 and I will send it. Fifteen layers under one panel: market st
Smc Pro ToolKit
Talal N Z Aljarusha
5 (14)
SMC PRO TOOLKIT — SMART MONEY ANALYSIS & STRUCTURED TRADE PLANNING SMC Pro ToolKit is a professional Smart Money Concepts analysis workspace for MetaTrader 5. It combines market structure, multi-timeframe analysis, institutional price zones, setup evaluation, confirmation tools, volume context, alerts, and risk planning inside one organized chart environment. One workspace. Multiple layers of confirmation. One structured trading plan. OPEN COMPLETE USER GUIDE MULTI-CONDITION SETUP ENGINE At
제작자의 제품 더 보기
Perfect Day Scalper Pro Indicator
Emma-ekong Ben Eshiet
3.5 (2)
Perfect Day Scalper Pro Your Daily 5-Point Routine for a 5-Figure Income. Price: $150 USD (Stop Chasing, Start Cashing) ---   One Trade. One Target. One Victory Lap. Your Day is Done. (Forget the 1000+ pip dreams that turn into 100+ pip losses. Real wealth is built on consistency, not complexity. What if your entire trading day was over in 15 minutes, with a single, high-probability trade that hands you a clean, professional profit? Welcome to the Perfect Day Scalper.) ---   What is The
FREE
Advance Market Analysis Indicator
Emma-ekong Ben Eshiet
5 (2)
ADVANCED MARKET ANALYSIS INDICATOR        Overview of the Indicator This is not a simple indicator — it’s a multi-analysis predictive system. It combines: Volume Profile (POC, VAH, VAL) Fibonacci Extensions Pivot Levels (Daily, Weekly, 4H) Trend Determination (MA-based) Smart Money Concepts & Pattern Detection (basic placeholders for expansion) Prediction Engine (projects price forward for 1 hour) It gives you: Target Price Line (projection) Stop Loss Line (usually at Volume POC)
FREE
Level 3 Power Indicator
Emma-ekong Ben Eshiet
5 (9)
LEVEL 3 POWER INDICATOR   The Professional’s Timing Masterpiece Stop guessing market turns. Start seeing them before they happen. ---   Are You Missing Out on Big Moves? Entering trades just before the market reverses? Unsure whether a trend is truly over—or simply pausing? Struggling with confidence when holding trades? You’re not alone. Most traders wrestle with these exact challenges… until they discover the Level 3 Power Indicator. ---   The Game-Changing “Traffic Light” Syst
FREE
N/B: All our product purchase comes with our free ‘’DAILY   SCALPER EA’’ -   bit.ly/4qlFLNh Whatsapp Developer for yours after successful purchase THE PERFECT ENTRY INDICATOR  Enter Trades Like a Pro With the Perfect Entry Indicator! No More Guesswork. Just Precision. Double-ZigZag + Fractal Confirmation = Only the Strongest Buy & Sell Setups. Are you tired of false signals, late entries, and endless chart confusion? The Perfect Entry Indicator was built to give traders crystal-clear e
SEER Spike Detector
Emma-ekong Ben Eshiet
N/B: All our product purchase comes with our free ‘’DAILY   SCALPER EA’’ -   bit.ly/4qlFLNh Whatsapp Developer for yours after successful purchase   SEER SPIKE DETECTOR The Ultimate Market-Reversal & Spike Forecasting Tool for Crash & Boom Indices, Forex & Synthetic Markets Best on M1 and M5 Stoploss: 10 Candles Maximum.   What is SEER SPIKE DETECTOR? The SEER SPIKE DETECTOR is a next-generation market prediction indicator designed to detect and confirm spikes, reversals, and momentum sh
Smart SD Arrow indicator
Emma-ekong Ben Eshiet
SMART SD ARROW INDICATOR  Trade Smarter, Not Harder: The Smart SD Arrow Indicator That Paints Clear Buy & Sell Signals Right On Your Chart!  Finally, an All-in-One Supply & Demand Tool That Doesn’t Just Draw Zones—It Gives You Precise, Actionable Entry Arrows. Stop Analyzing, Start Executing. Dear Trader, Let's be honest. You've tried indicators that draw complicated zones all over your chart. They look smart, but when it's time to pull the trigger, you're left with the same old question:
FREE
ZPower BuySell Indicator
Emma-ekong Ben Eshiet
1 (1)
ZPOWER BUY & SELL INDICATOR   Trade Smarter. Trade Confidently. Trade Profitably. Are you tired of second-guessing your trades? Do you enter late and exit too early — leaving money on the table? It’s time to upgrade your strategy with the ZPOWER BUY & SELL INDICATOR, built with institutional-grade logic that helps you catch high-probability trade setups with precision.   Why ZPOWER is Different Unlike ordinary indicators that flood your charts with noise, ZPOWER is engineered with advanced
FREE
Eternal Spike Detector
Emma-ekong Ben Eshiet
N/B: All our product purchase comes with our free ‘’DAILY   SCALPER EA’’ -   bit.ly/4qlFLNh Whatsapp Developer for yours after successful purchase Eternal Spike Detector Pro - M5 Mastery System   HOW TO TRADE THIS SYSTEM   TRADING RULES For CRASH 500/900/1000: SELL SETUP: · Wait for RED DOWN ARROW to appear · Enter SELL at the close of the M5 candle where arrow appears · Stop Loss: 1.5x ATR above the entry high · Take Profit: 2-3x ATR below entry · Only trade maximum 7 signals per day
Daily Bias indicator
Emma-ekong Ben Eshiet
INTRODUCING the Powerful Daily Bias Indicator  The Daily Bias Indicator Stop Guessing. Start Trading with Confidence. Tired of staring at your charts and not knowing if today is a buy day or a sell day? The Daily Bias Indicator does the heavy lifting for you. It scans the market using 7 powerful tools (EMA trend, RSI, MACD, ADX, Volume, Pivot Points & Price Action). It tells you in plain language: “TODAY: BUY ONLY” “TODAY: SELL ONLY” Or “NO CLEAR BIAS” (so you don’t waste money
FREE
THE ADVANCE PRICE PREDICTOR - GURU EDITION   Tired of Guesswork? Meet the AI-Powered "Almighty Predictor" – Pinpoints High-Probability Targets Before the Move, With Surgical Precision     Stop chasing pips. Start attracting them. Our proprietary algorithm fuses Multi-Timeframe Analysis + Smart Money Concepts + Real-Time Confluence Scoring to give you a clear, calculated edge on every trade.   Are You Constantly Wondering…   "Is this the top, or will it keep going?"   "Where should I real
FREE
Omega One Spike Detector
Emma-ekong Ben Eshiet
N/B: All our product purchase comes with our free ‘’DAILY   SCALPER EA’’ -   bit.ly/4qlFLNh Whatsapp Developer for yours after successful purchase OMEGA ONE SPIKE DETECTOR: Catch Every Explosive Move /Spikes with Surgical Precision   "I Used To Watch Spikes Fly By - Now I Catch Them Consistently Using Institutional Order Levels"   WATCHING 500-POINT SPIKE and not profiting?   ENTERING TOO LATE after the big move already happened?   GETTING STOPPED OUT right before the explosion? What If
Price Predictor Pro
Emma-ekong Ben Eshiet
Price Predictor Pro Turn Market Patterns into Predictable Profits! Are you tired of guessing where the market will go next? With Price Predictor Pro , you’ll trade with confidence by spotting powerful chart patterns and receiving precise price projections —directly on your MT5 chart. What Price Predictor Pro Does: ️ Detects high-probability chart patterns like Double Tops, Double Bottoms, Head & Shoulders, Flags, Pennants, and more . ️ Instantly projects the next price target using adv
FREE
Introducing the Bollinger Flipper Indicator – Your Ultimate Trading Edge!   Are you tired of second-guessing your entries and exits? The Bollinger Flipper Indicator is here to flip the game in your favor.   Built with the power of Bollinger Bands + Level 3 Power System + ZigZag Fractals, this advanced tool is designed to spot high-probability buy & sell signals with precision. SPECIAL BONUS (VALID TILL JUNE 2026)- OUR DAILY SCALPER EA for BTCUSD and VIX75 •································
Unlock the Market's Hidden Blueprint with Advanced Pattern Recognizer Tired of staring at charts, struggling to spot high-probability trading opportunities? What if you had a professional analyst scanning the markets 24/7, drawing perfect trendlines, and calculating precise profit targets for you? Introducing Advanced Pattern Recognizer for MetaTrader 5 – Your Automated Technical Analysis Powerhouse. This isn't just another indicator. It's a sophisticated algorithmic engine designed to do the he
Sniper Eye Indicator
Emma-ekong Ben Eshiet
SNIPER SALES COPY Tired of Spraying and Praying? Get the Sniper's Edge with the Sniper Eye Indicator. From Trader to Tactician: Execute Trades with the Precision of a Market Sniper. The market is a battlefield. Most traders are like infantry—firing wildly, hoping a shot lands. They're plagued by noise, false signals, and emotional decisions that decimate their accounts. It's time to change your role. It's time to become a Sniper. Introducing the Sniper Eye Indicator for MetaTrader 5. This i
THE DAILY DECIDER BUYSELL PRO INDICATOR OVERVIEW Unlock the Market's Daily Secret: The Daily Decider BuySell Indicator is Here! Tired of analysis paralysis? Struggling with false signals and noisy markets? What if you could know the market's primary intention within the first few hours of the day and trade with unwavering confidence? Introducing the Daily Decider BuySell Indicator for MetaTrader 5. Pro Tip: Never Miss the first signal of the day This isn't just another indicator cluttering yo
N/B: All our product purchase comes with our free ‘’DAILY   SCALPER EA’’ -   bit.ly/4qlFLNh Whatsapp Developer for yours after successful purchase UNLEASH THE SPARTAN-ARROW SPIKE DETECTOR The Ultimate Boom & Crash Trading Weapon That Never Sleeps --- ️ THIS IS NOT JUST AN INDICATOR - IT'S YOUR PERSONAL 300 SPARTAN ARMY SPECIAL BONUS (VALID TILL JUNE 2026)- OUR DAILY SCALPER EA for BTCUSD and VIX75 •·································································•
N/B: All our product purchase comes with our free ‘’DAILY   SCALPER EA’’ -   bit.ly/4qlFLNh Whatsapp Developer for yours after successful purchase The Holy Grail MotherBar Indicator: Your Ultimate Path to Consistent Trading Profits   The Problem With Every Other Indicator You've Tried Let me guess - you've spent countless hours and hundreds (maybe thousands) of dollars on indicators that promise the world but deliver mediocre results. You've tried: · Lagging indicators that tell you what
N/B: All our product purchase comes with our free ‘’DAILY   SCALPER EA’’ -   bit.ly/4qlFLNh Whatsapp Developer for yours after successful purchase   DAY TRADER PLUS: The Institutional Order Flow System   Finally See Where Banks Place Their Orders - And Profit With Them   ARE YOU SICK OF THIS? "I entered the trade at what seemed like the perfect time... only to watch price reverse immediately and hit my stop loss." "I took profits too early, then watched the market run another 100 pips w
N/B: All our product purchase comes with our free ‘’DAILY   SCALPER EA’’ -   bit.ly/4qlFLNh Whatsapp Developer for yours after successful purchase HolyGrail Premium System: The Ultimate Supply & Demand Trading Solution   Finally Discover the "Unfair Advantage" That Professional Traders Have Been Using For Years "I went from inconsistent guessing to precision trading with 83% accuracy once I started combining multi-timeframe confirmation with institutional order flow zones" Note: After pur
N/B: All our product purchase comes with our free ‘’DAILY   SCALPER EA’’ -   bit.ly/4qlFLNh Whatsapp Developer for yours after successful purchase DayTrader Premium System Indicator: Complete Trading Mastery The DayTrader Premium System Indicator represents the culmination of institutional trading methodology made accessible to retail traders. By combining order block analysis, supply/demand zone identification, and multi-factor confirmation, it provides a comprehensive framework for consis
HolyGrail M   N/B: All our product purchase comes with our free ‘’DAILY   SCALPER EA’’ -   bit.ly/4qlFLNh Whatsapp Developer for yours after successful purchase m ost wanted Edition Overview   ATTENTION ALL TRADERS!  FINALLY UNVEILED: The "HolyGrail MostWanted" Indicator - Your All-in-One Institutional Trading Dashboard for MetaTrader 5 SPECIAL BONUS (VALID TILL JUNE 2026)- OUR DAILY SCALPER EA for BTCUSD and VIX75 •·································································•
N/B: All our product purchase comes with our free ‘’DAILY   SCALPER EA’’ -   bit.ly/4qlFLNh Whatsapp Developer for yours after successful purchase Premium Breakout Scanner Indicator: Your Institutional-Grade Breakout Trading System   DISCOVER HIGH-PROBABILITY BREAKOUTS BEFORE THEY HAPPEN THIS IS A FOUR-CANDLE BREAKOUT STRATEGY/SYSTEM WITH 70%+ ACCURACY . Tired of missing breakout moves? Entering too late? Getting stopped out by false breakouts? The Premium Breakout Scanner combines instit
Pattern 123 Pro Indicator
Emma-ekong Ben Eshiet
N/B: All our product purchase comes with our free ‘’DAILY   SCALPER EA’’ -   bit.ly/4qlFLNh Whatsapp Developer for yours after successful purchase   PATTERN 123 PRO - REVOLUTIONARY TRADING SIGNALS INDICATOR     WHY 98% OF TRADERS FAIL - AND HOW WE FIXED IT Traders lose money not because they can't read charts, but because they can't filter NOISE from REAL OPPORTUNITIES. They see patterns everywhere, but which ones actually work? Which signals are still valid by the time they spot them? WE
N/B: All our product purchase comes with our free ‘’DAILY   SCALPER EA’’ -   bit.ly/4qlFLNh Whatsapp Developer for yours after successful purchase UNLOCK THE 4-CANDLE SECRET: Trade Like a PRO with "Inside Bar Dominator"   ATTENTION ALL TRADERS! Are you tired of: · Losing trades from false breakouts? · Missing entries because you're stuck analyzing charts? · Complex indicators that give conflicting signals? · Struggling to find clear stop loss and take profit levels? What if I told you th
N/B: All our product purchase comes with our free ‘’DAILY   SCALPER EA’’ -   bit.ly/4qlFLNh Whatsapp Developer for yours after successful purchase PROFESSIONAL DOUBLE TOP/BOTTOM PATTERN SCANNER The Ultimate Reversal Trading System for Forex & Crypto Traders  TRANSFORM YOUR TRADING WITH INSTANT PATTERN RECOGNITION Are you tired of missing profitable reversal setups? Exhausted from staring at charts for hours, trying to spot double tops and bottoms? Frustrated with false breakouts and misse
N/B: All our product purchase comes with our free ‘’DAILY   SCALPER EA’’ -   bit.ly/4qlFLNh Whatsapp Developer for yours after successful purchase PIN BAR POWER REVERSAL SCANNER MT5   UNLOCK THE SECRET OF INSTITUTIONAL TRADING WITHOUT THE HEDGE FUND BUDGET What If I Told You There's a Way to Spot Reversals BEFORE They Happen? Professional traders know: Pin bars at key levels are where fortunes are made. The institutions use them. The smart money follows them. And now, YOU can trade them w
N/B: All our product purchase comes with our free ‘’DAILY   SCALPER EA’’ -   bit.ly/4qlFLNh Whatsapp Developer for yours after successful purchase REVERSAL ENTRY PRO INDICATOR The Smart Money's Secret Weapon for Pinpointing Extreme Reversal Zones INTRODUCTION: THE TRADER'S DILEMMA Every trader knows the frustration: You see a market reaching extremes, but when do you enter? How do you distinguish between a minor pullback and a major trend reversal? Where do you place your stop loss that'
GoldMaster Signal Trader
Emma-ekong Ben Eshiet
GOLD MASTER TRADER 3.0 Professional Institutional-Grade Gold Trading System --- UNLOCK THE PROFESSIONAL'S EDGE IN GOLD TRADING What if you could see the gold market through the eyes of institutional traders? What if you had a system that didn't just show you where price is, but where the big money is likely to move it next? Gold Master Trader 3.0 isn't another lagging indicator that shows you what already happened. It's a comprehensive institutional-grade trading system that reveals order f
N/B: All our product purchase comes with our free ‘’DAILY   SCALPER EA’’ -   bit.ly/4qlFLNh Whatsapp Developer for yours after successful purchase CONTRACTION + EXPANSION BOX SCANNER The SIMPLE Guide for Regular Traders   WHAT THIS INDICATOR DOES (IN PLAIN ENGLISH) Think of the market like a rubber band: 1. CONTRACTION = Rubber band being squeezed tight (price moves in a small range) 2. EXPANSION = Rubber band SNAPS and stretches out (price makes a big move) This indicator does ONE SI
필터:
리뷰 없음
리뷰 답변