Market session with fibonacci
- 지표
-
Batsukh Sumchin Khuyagbaatar
 since 2006 ---
 - 버전: 8.11
- 활성화: 10
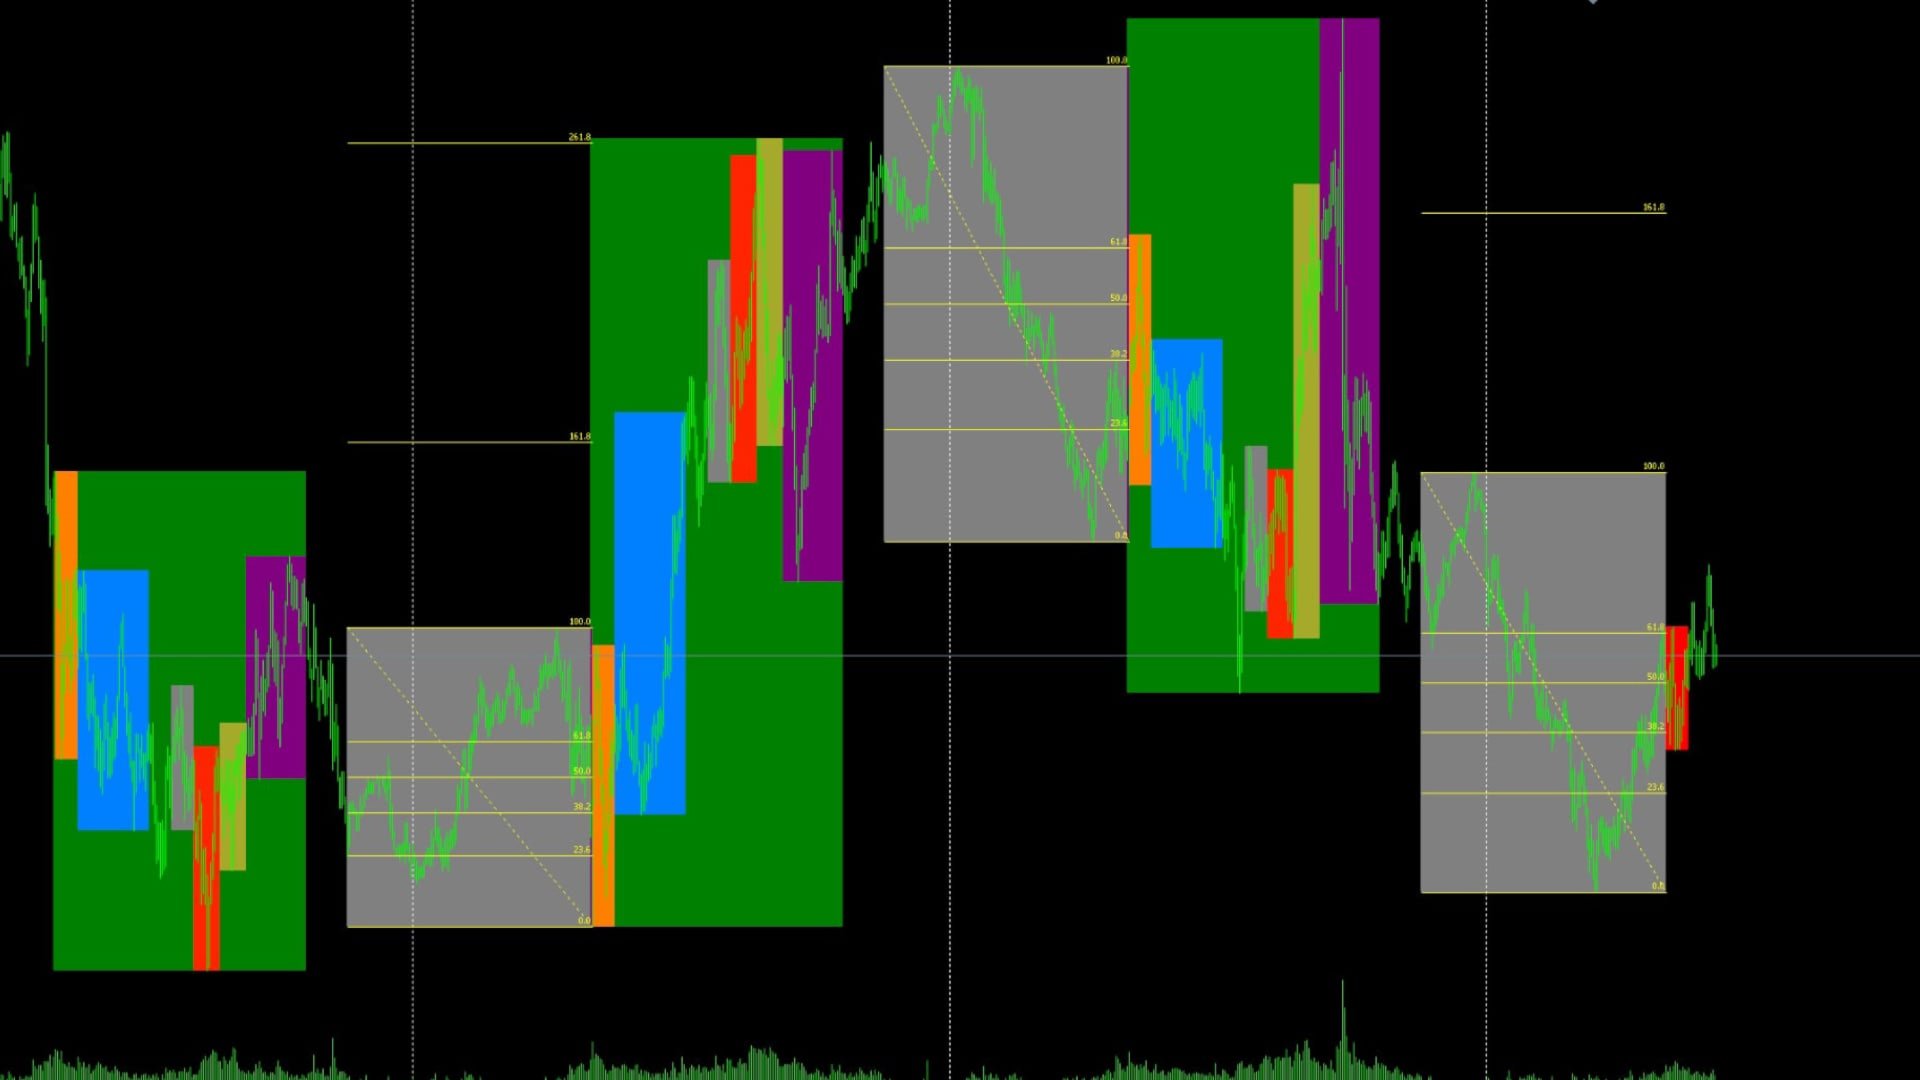
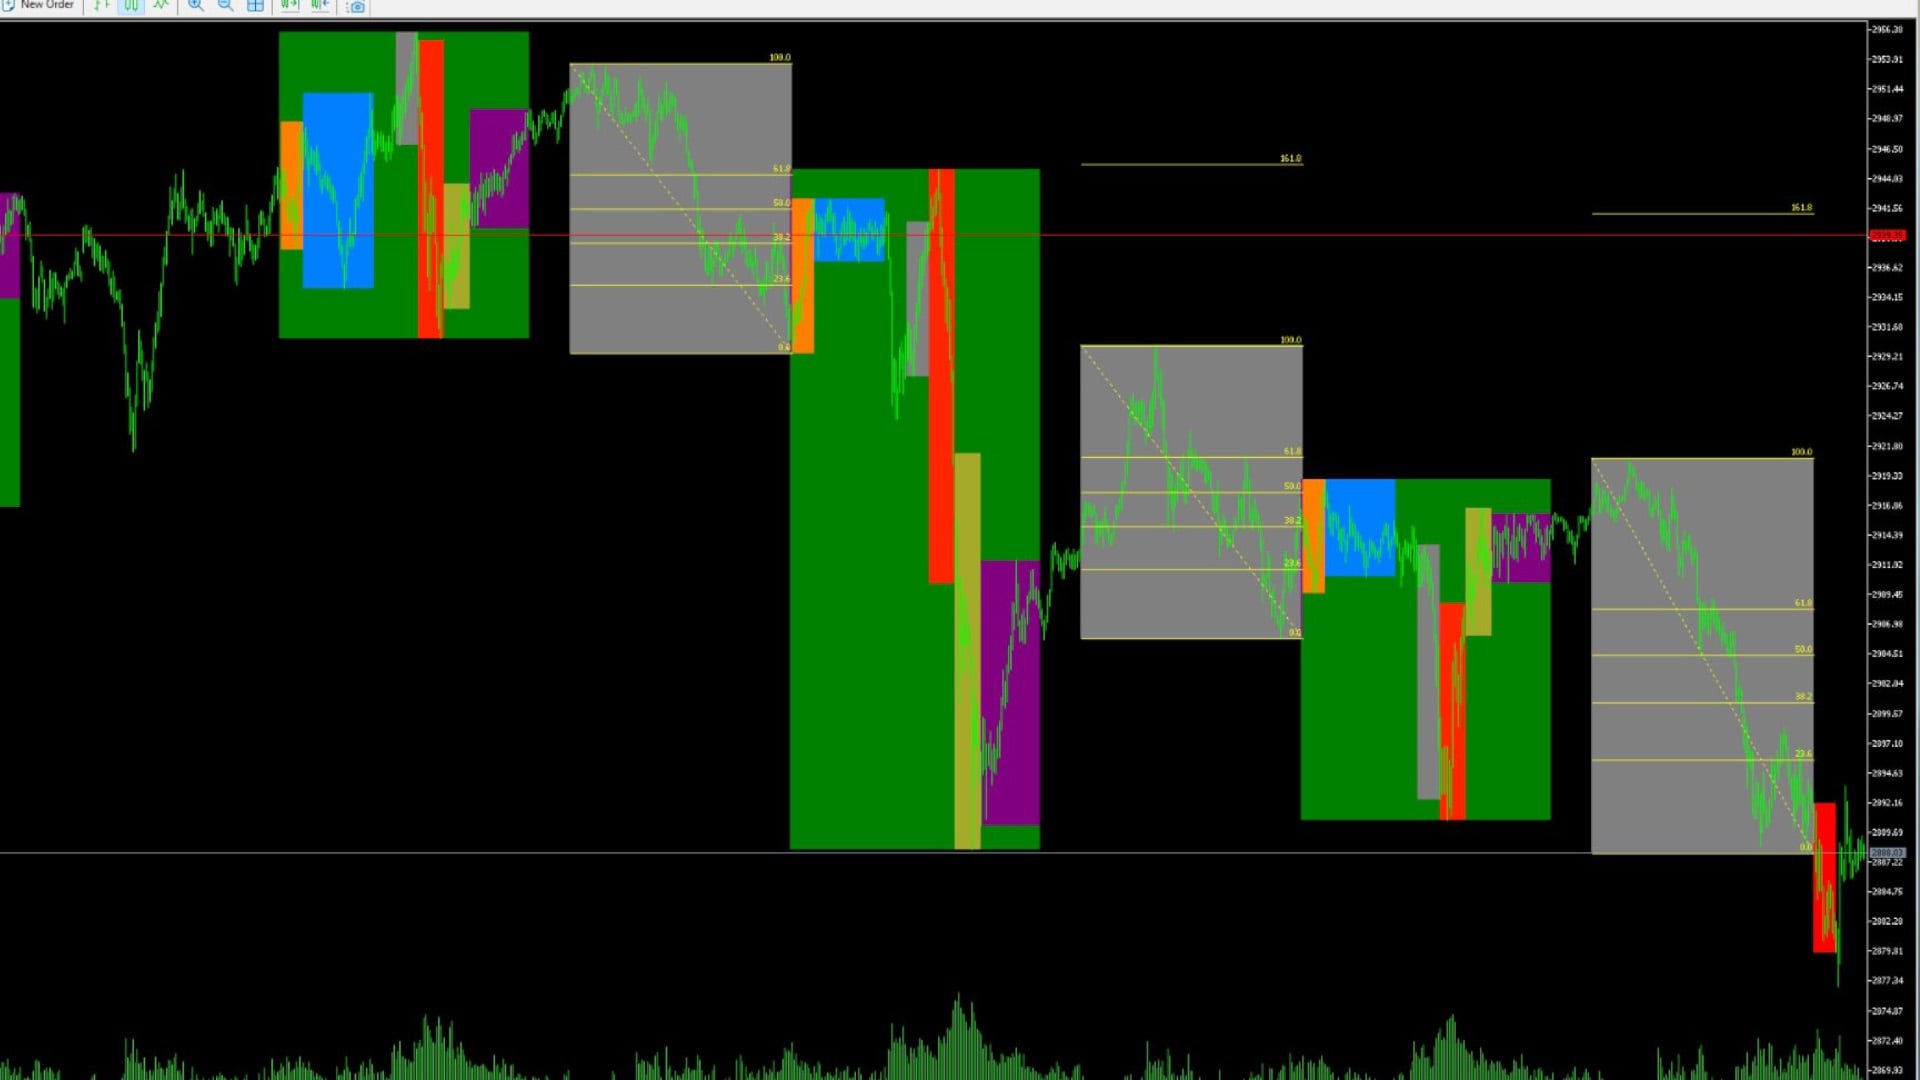
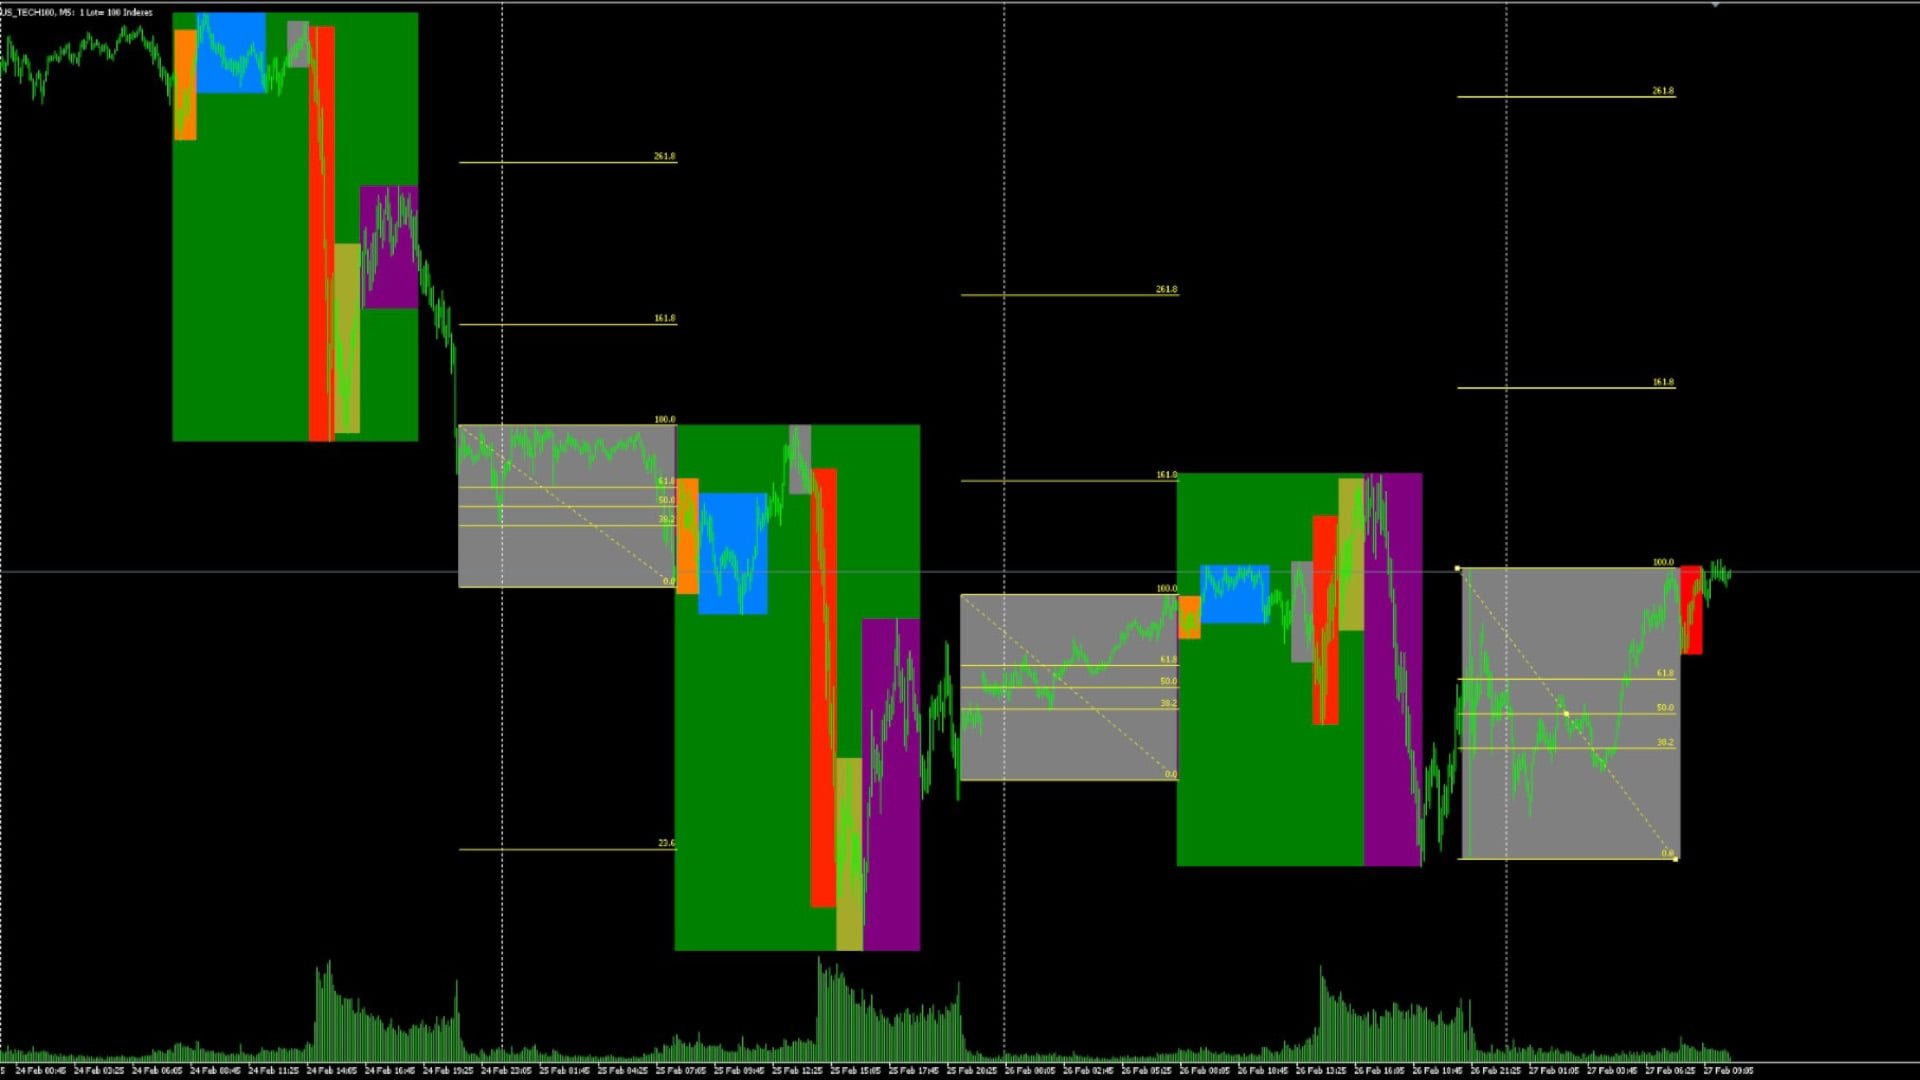
이 지표는 우리가 매일 사용하는 가장 일반적인 지표로, 가장 많이 사용하는 전략인 ICT와 SMC, 거래소 개장 및 폐장 시간에 발생하는 손절매 한도와 유동성 한도, 피보나치와 확대 및 축소를 통한 거래소 거래량, 보고 싶은 거래소 움직임을 선택하고 피보나치를 당기는 등 가장 일반적으로 보고 싶은 행동을 완전 자동으로 보여주는 지표입니다. 이 지표를 사용하여 모든 유형의 거래를 분석하는 법을 배우면 다시는 이 지표 없이 일할 수 없을 거라고 100% 확신합니다.
이 지표는 우리가 매일 사용하는 가장 일반적인 지표로, 가장 많이 사용하는 전략인 ICT와 SMC, 거래소 개장 및 폐장 시간에 발생하는 손절매 한도와 유동성 한도, 피보나치와 확대 및 축소를 통한 거래소 거래량, 보고 싶은 거래소 움직임을 선택하고 피보나치를 당기는 등 가장 일반적으로 보고 싶은 행동을 완전 자동으로 보여주는 지표입니다. 이 지표를 사용하여 모든 유형의 거래를 분석하는 법을 배우면 다시는 이 지표 없이 일할 수 없을 거라고 100% 확신합니다.