Vision Quant Atlas
- 지표
-
Sofien Kaabar
 Quant Atlas 📈 builds quantitative market intelligence tools for traders and market researchers.
🔹Our work focuses on algorithmic support and resistance levels, market structure analytics, conviction frameworks, path probability, and decision support indicators for MetaTrader 5. - 버전: 1.1
- 활성화: 5
Vision by Quant Atlas
Creator: https://www.quant-atlas.com/
Vision by Quant Atlas is a multi component reversal signal indicator designed to identify short term bullish and bearish exhaustion points across liquid markets. The model aggregates several independent technical evidence layers, including momentum behavior, mean reversion pressure, volatility based conditions, trend interaction, timing structure, and moving average related confirmation. The final output is converted into visual conviction signals directly on the chart.
The indicator is mostly designed for reversal analysis. Its purpose is to highlight areas where price may be stretched, structurally vulnerable, or approaching a potential change in direction. Vision is best used as a decision support layer alongside price action, market structure, candle behavior, support and resistance, liquidity zones, and broader trend context.
Signal philosophy
Vision does not treat every reversal condition equally. Each signal is classified by the amount and quality of evidence behind it.
A signal is generated only when the aggregated model score reaches a defined conviction zone. The stronger the agreement between internal components, the more important the signal classification becomes.
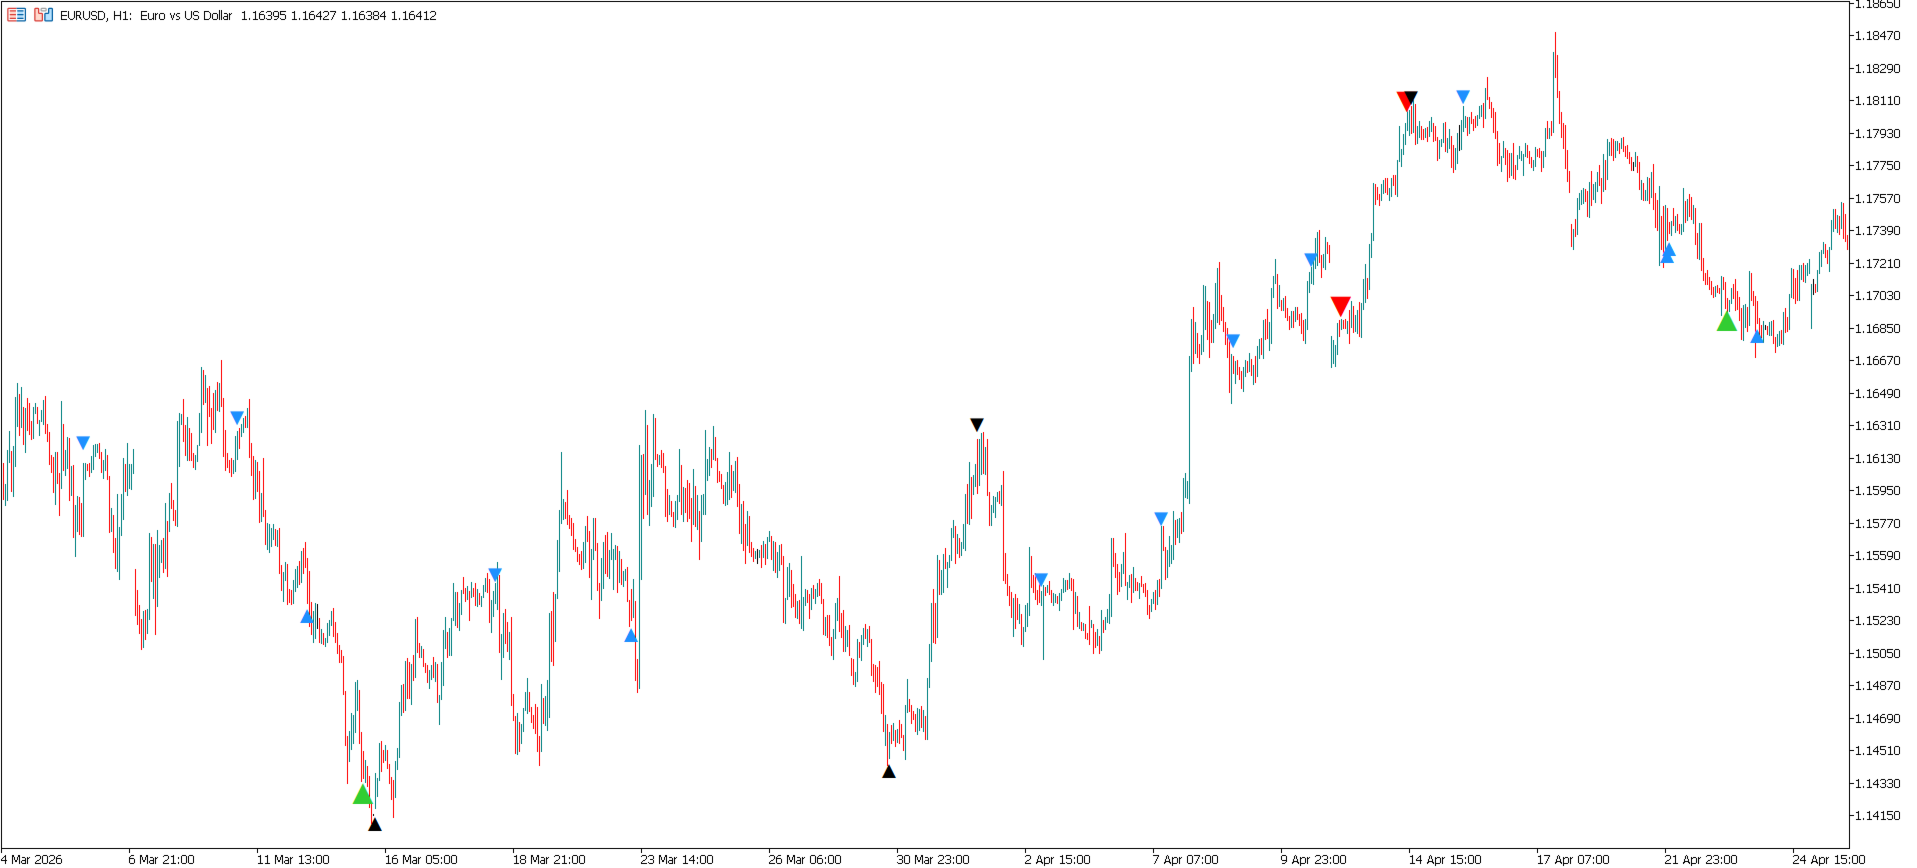
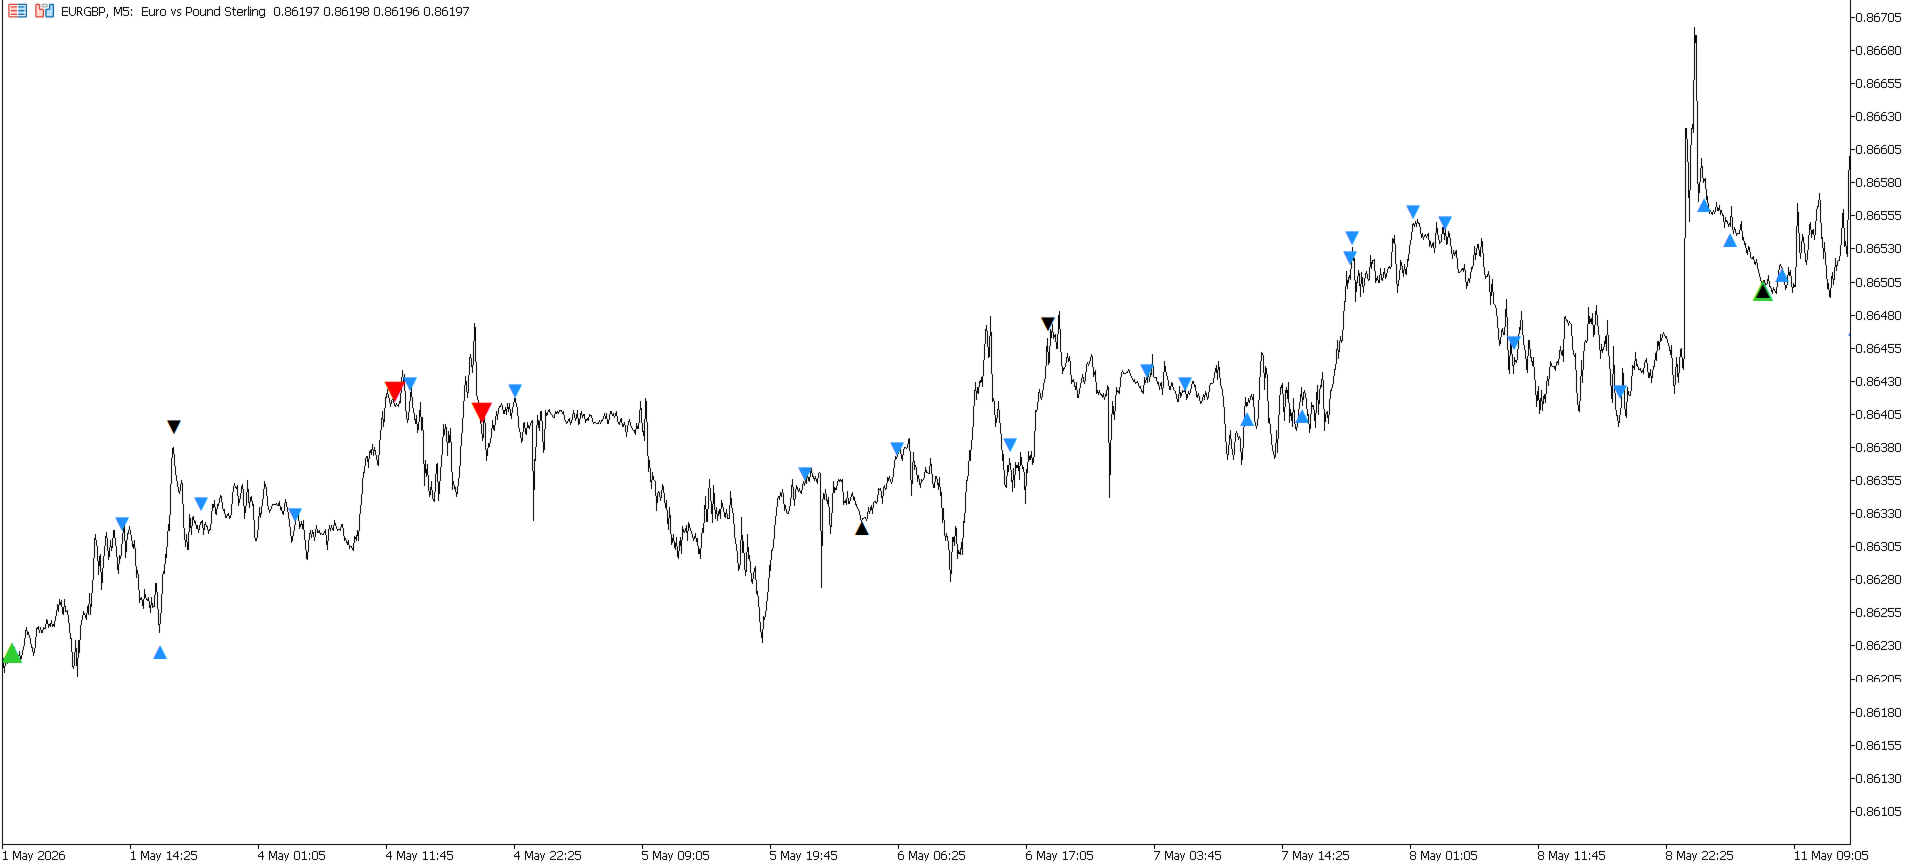
The indicator uses three practical conviction levels:
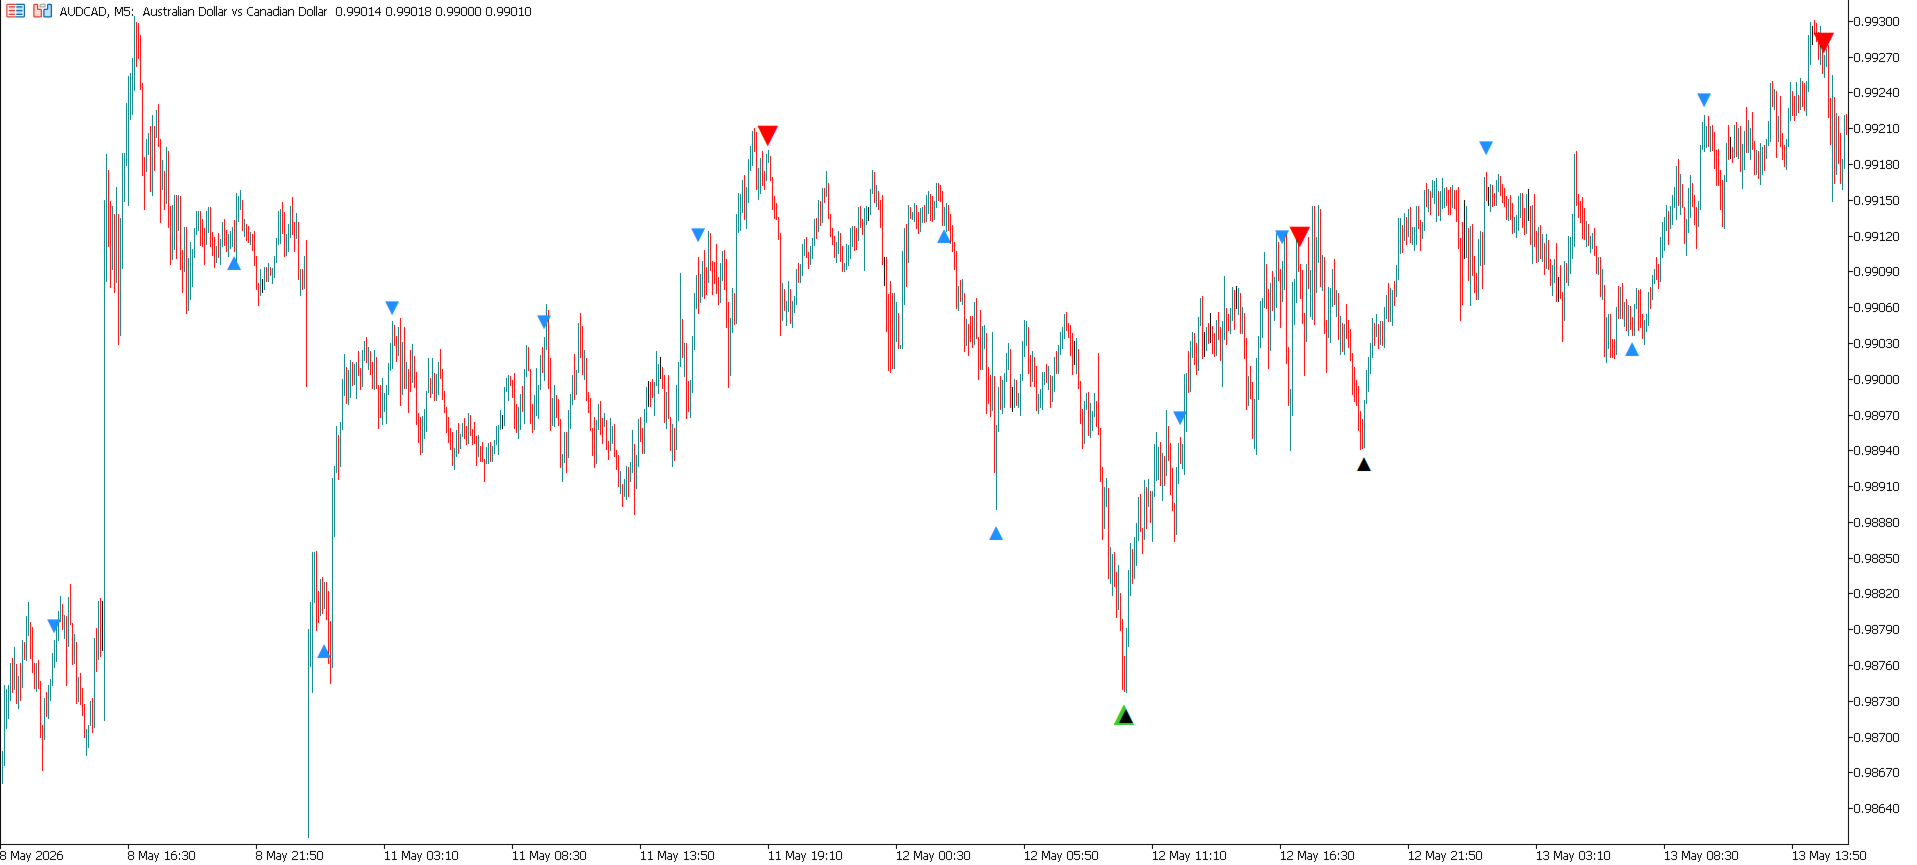
Blue triangles: moderate conviction
Blue triangles represent moderate reversal conviction.
These signals indicate that the model has detected a meaningful bullish or bearish reversal condition, but the evidence is not yet strong enough to classify it as a high conviction setup.
- A blue bullish triangle appears below price when the model detects a moderate bullish reversal bias.
- A blue bearish triangle appears above price when the model detects a moderate bearish reversal bias.
Blue signals are useful for early awareness. They are best used when confirmed by visible price action, such as rejection candles, failed continuation, local structure shifts, or reaction from a relevant zone.
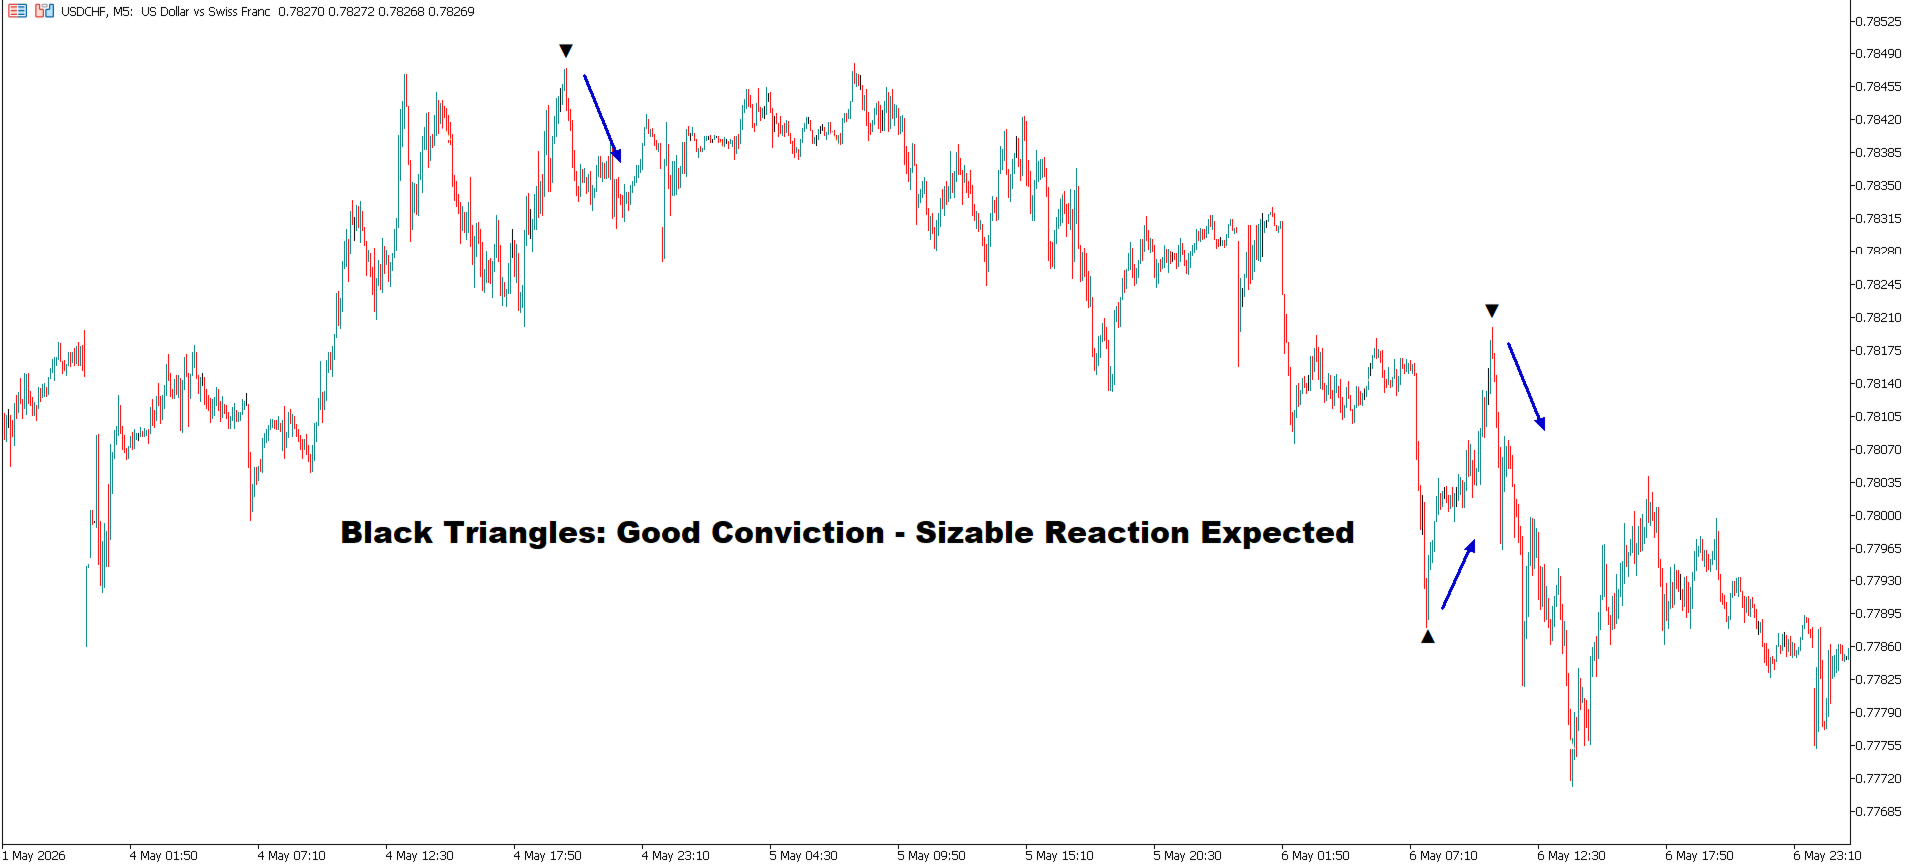
Black triangles: good conviction
Black triangles represent good conviction. A black triangle appears when a signal is supported by a higher number of aligned internal indicators.
- A black bullish triangle means the model has identified a bullish reversal condition with broader internal confirmation.
- A black bearish triangle means the model has identified a bearish reversal condition with broader internal confirmation.
These signals are generally more selective than blue signals. They show that the reversal condition is not coming from one isolated technical trigger, but from multiple areas of agreement inside the model.
For discretionary users, black triangles can be treated as higher quality reversal alerts, especially when they appear around clear support or resistance, after an extended move, or near a visible exhaustion candle.
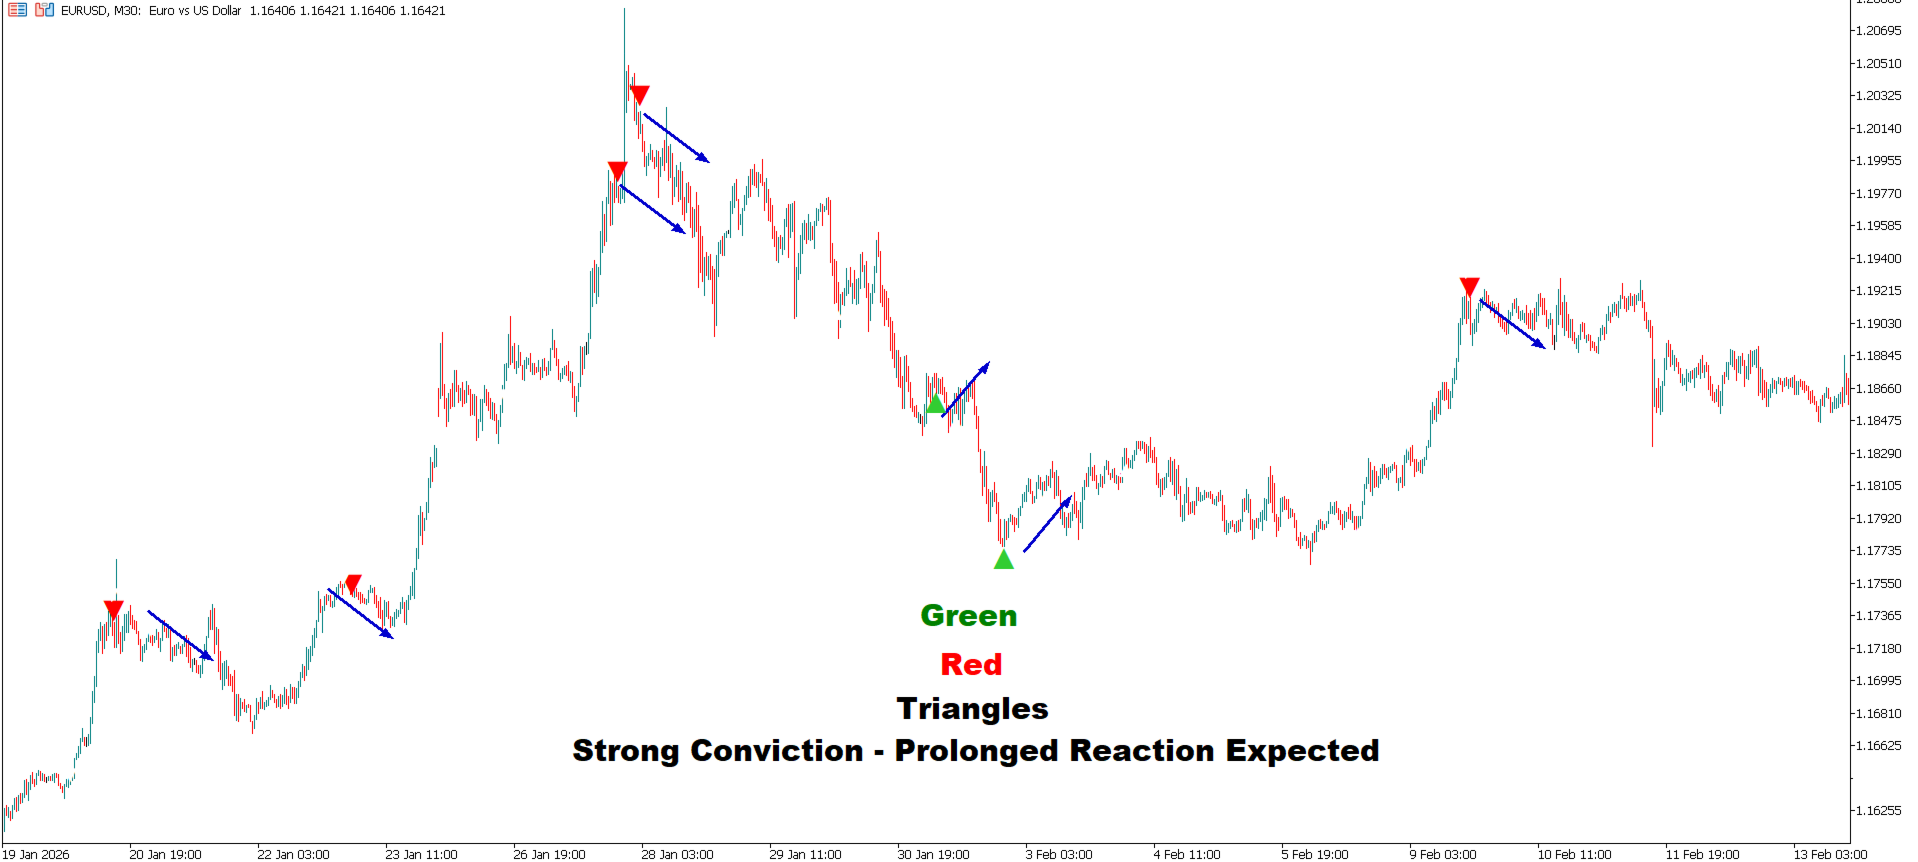
Green and red triangles: strong conviction
Green and red triangles represent strong conviction.
- A green triangle indicates a strong bullish reversal signal.
- A red triangle indicates a strong bearish reversal signal.
These signals are designed to capture higher intensity reversal conditions.
How to interpret the signals
Vision should be read as a reversal conviction map. The strongest use case is not taking every signal mechanically. The better use case is filtering signals through price action.
For example, a bullish signal is more relevant when it appears after a selloff, near support, with selling pressure slowing down, a rejection wick, a failed breakdown, or a shift in short term structure.
A bearish signal is more relevant when it appears after a rally, near resistance, with buying pressure fading, a rejection candle, a failed breakout, or a loss of upside continuation.
Intended market use
Vision is primarily built for short term trading and tactical market timing.
It is well suited for lower and intermediate time frames where reversal timing matters, such as intraday and swing trading contexts. The signal framework is especially useful when the trader wants a structured way to identify potential exhaustion zones without relying only on subjective chart reading.
The indicator can also be used on the daily time frame. On daily charts, the signals are less frequent but can be useful for identifying broader tactical reversal areas, especially when combined with market structure, trend regime, and macro or cross asset context.
Best practice
Vision works best when used as a confirmation tool rather than a standalone entry system.
The cleanest process is:
- Identify the broader market context.
- Watch for a Vision signal.
- Confirm the signal with price action.
- Define invalidation using the chart structure.
- Manage the trade with position sizing and risk control.