Auto Elliott Engine

Auto Elliott Engine

The Auto Elliott Engine is a tool designed for MetaTrader 4 that automates the identification, decomposition, and projection of price structures based on the Elliott Wave Theory.

Powered by a pattern-recognition engine, this indicator processes price action to identify market configurations, translating data into structured scenarios.

Key Features

  • Multi-Degree Recognition: Analyzes price action across multiple fractal levels. From higher degrees, such as Supercycle or Cycle, down to minor structures.

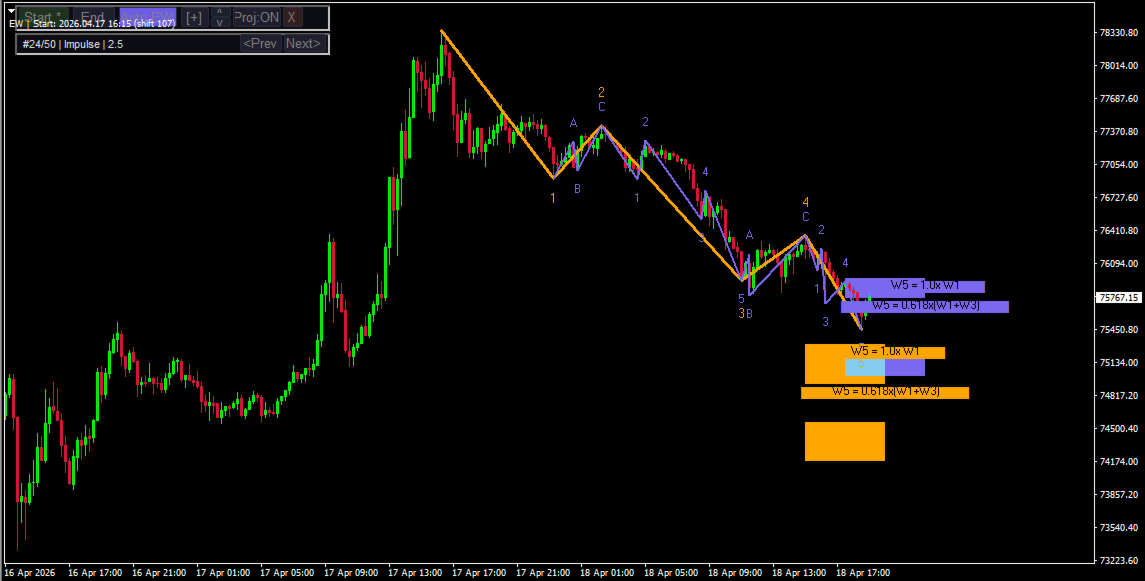
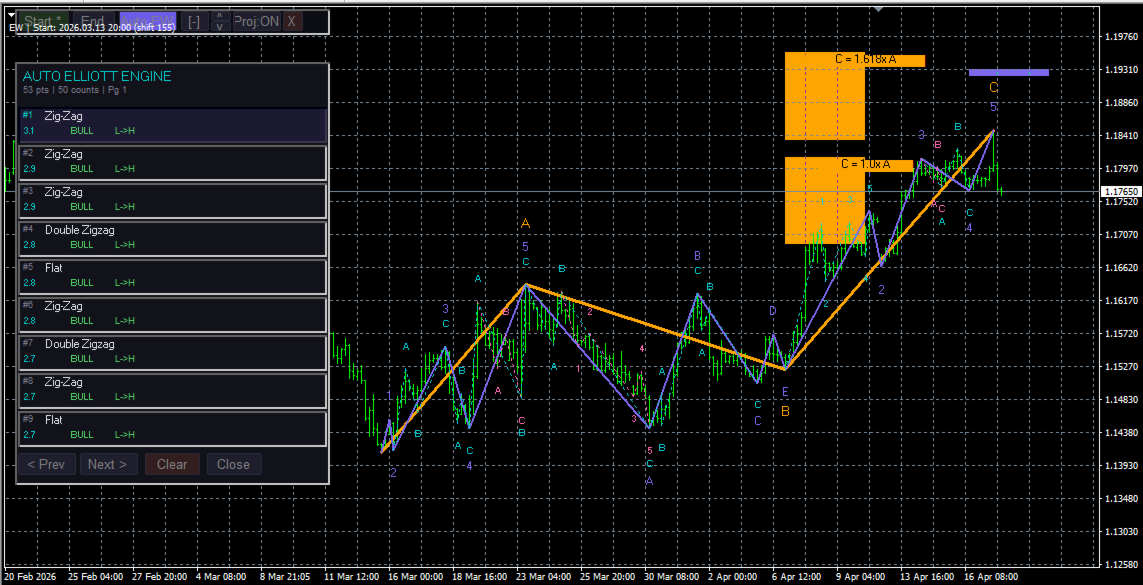
  • Pattern Decoder: Identifies impulsive formations (Standard Impulses, Contractive/Expanding Diagonals) and corrective patterns (Simple and Complex Zig-Zags, Regular/Expanded Flats, Triangles, and WXY/WXYXZ Combinations).

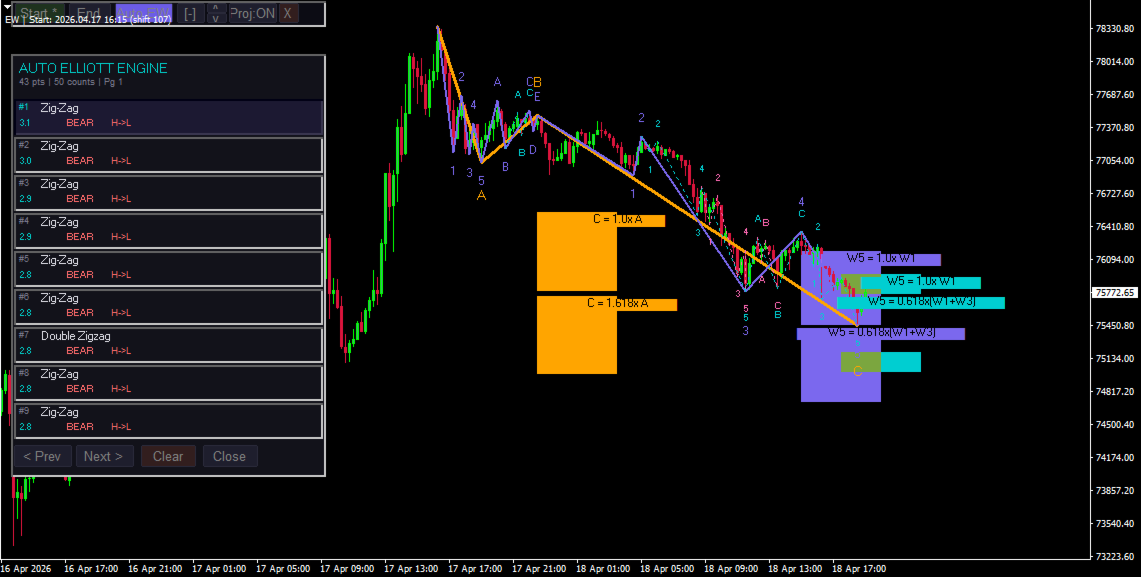
  • Fibonacci Projections: The system projects retracement and extension zones on the chart based on the active wave. The interface allows for toggling between visualizing key areas of the last wave or a mapping of all calculated ranges.

  • Scoring System: Each suggested count undergoes a qualification process. If a structure shows anomalies or exceeds the margins of classic Elliott behavior, such as excessive retracements or unusual proportions, the engine assigns penalties to prioritize others counts that adhere to classic wave theory.

  • Control Panel: Includes an interactive "Auto EW" panel to analyze, navigate, and review alternative count options within the main workspace.

Ideal For

Technical market analysts and price-action specialists who seek to assist their wave counting and automate the mapping of price expansions and contractions.

Important Note: This indicator does not take into account all Elliott Wave guidelines; for example, it does not include "The Right Look".

How to Use

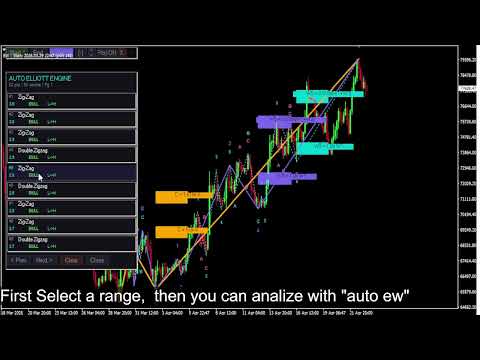
  • Start the Analysis: Click the "Start" button to select the starting point of the wave count. This should be an extreme point from which the count originates.

  • Historical Range: We recommend selecting a range of 100 to 200 historical bars. Calculating the wave structure is resource-intensive; while you can experiment with a larger historical range, please be aware that processing times will increase. If you require analysis over a larger historical range, we recommend switching to higher timeframes.

  • Run the Count: Click the "Auto EW" button to execute the count within your selected range.

  • Manage Projections: You can toggle the visual projections by clicking the "Proj: ON / Proj: OFF" button.

  • Navigation: Use the "[ + ]" and "[ - ]" buttons on the interface to expand or collapse the list of alternative wave counts.

By default, the indicator is not configured to perform a count automatically as soon as it is loaded onto the chart. It works best when the user selects the range they want the indicator to process and then clicks "Auto EW".


추천 제품
Work Stations
Maryna Shulzhenko
Forex Workstation   is a powerful and efficient Forex trading bot designed to use patterns, price hold levels, volatility analysis and market scaling. This bot offers unique capabilities for automated trading and optimization of strategies on various currency pairs. Let's look at the main functions and settings of Forex Workstation: Main functions: • Multicurrency: Forex Workstation supports a wide range of currency pairs, which allows you to diversify your portfolio and distribute risks. • Usin
ROC acceleration-deceleration is the manual system for medium-term scalping. Indicator based on custom ROC system which defines bullish/bearish market and especially  acceleration-deceleration of tendention in the market's main direction. Buy arrow is plotted during bearish market when current trend decelerates and sell  arrow is plotted during bullish market when current trend decelerates. Main Indicator's Features Signals are not repaint,non-late or disappear(exept cases when system recalculat
This is a simple and efficient indicator based on market logic. The indicator creates a range chosen by a trader. Trader selects only two parameters. The first one is the number of candles that define the frame. The second one is the number of candles needed for confirmation frame. The indicator shows all situations in history and works with the actual movement of the market. The indicator works on all timeframes . You are not limited by use of different timeframes, the indicator is able to adap
Oscillator helps determine the direction of the market Shows the direction of the price movement and is painted in the appropriate color. Allows you to conduct trend and counter trend trading It works on all timeframes, on any currency pairs, metals and cryptocurrency Can be used when working with binary options Distinctive features Does not redraw; Simple and clear settings; It works on all timeframes and on all symbols; Suitable for trading currencies, metals, options and cryptocurrency (Bitco
Linear Trend Predictor - 진입 지점과 방향성 지원선을 결합한 추세 지표입니다. 고가/저가 채널을 돌파하는 원칙에 따라 작동합니다. 지표 알고리즘은 시장 노이즈를 걸러내고 변동성과 시장 역학을 고려합니다. 표시기 기능  평활화 방법을 사용하여 시장 추세와 BUY 또는 SELL 주문을 시작하기 위한 진입 시점을 보여줍니다.  모든 기간의 차트를 분석하여 단기 및 장기 시장 움직임을 파악하는 데 적합합니다.  어떠한 시장과 시간대에도 적용할 수 있으며, 입력 매개변수를 통해 거래자는 자신에게 맞게 지표를 독립적으로 사용자 지정할 수 있습니다.  설정된 지표 신호는 사라지거나 다시 그려지지 않습니다. 이는 캔들 마감 시 결정됩니다.  여러 유형의 알림이 화살표와 결합되어 있습니다.  이 지표는 독립적인 거래 시스템으로 사용할 수도 있고, 다른 거래 시스템에 추가하는 용도로도 사용할 수 있습니다.  모든 수준의 경험을 가진 거래자가 사용할 수 있습니다. 주요 매
Global Trend
Vitalii Zakharuk
Global Trend Indicator, shows the signals for entry. Displays both entry points and the trend itself. Shows statistically calculated moments for entering the market with arrows. When using the indicator, the risk factor can be optimally distributed. Settings: Uses all one parameter for settings. Choosing a parameter, it is necessary to visually resemble it so that the appropriate graph has a projection of extremes. Parameters: Length - the number of bars for calculating the indicator. Use
Introduction to Fractal Pattern Scanner Fractal Indicator refers to the technical indicator that makes use of the fractal geometry found in the financial market. Fractal Pattern Scanner is the advanced Fractal Indicator that brings the latest trading technology after the extensive research and development work in the fractal geometry in the financial market. The most important feature in Fractal Pattern Scanner is the ability to measure the turning point probability as well as the trend probabi
Introduction In the fast-paced world of financial market trading, success often hinges on the ability to spot and leverage trends. Among the various strategies available, momentum trading stands out as a powerful tool for traders seeking to capitalize on market movements. In this article, we will delve into the concept of momentum, its significance in trading, and the numerous benefits it offers to traders. What is Momentum? Momentum in trading refers to the tendency of assets to continue moving
Gold Targets 4
Sergei Linskii
골드 타겟은 최고의 추세 지표입니다. 지표의 고유한 알고리즘은 기술 및 수학적 분석 요소를 고려하여 자산 가격의 움직임을 분석하고 가장 수익성이 높은 진입점을 결정하며 화살표 및 가격 수준(BUY Entry / SELL Entry) 형태로 신호를 발행합니다. 주문을 엽니다. 표시기는 또한 손절매 가격 수준과 이익 실현을 위한 5가지 가격 수준을 즉시 표시합니다. 주의: 표시기는 사용이 매우 쉽습니다. 한 번의 클릭으로 차트에 표시기를 설치하고 신호 및 가격 수준에 따라 거래하세요. 차트에서는 지표가 설치된 시간대에 관계없이 4개의 시간대(M30 H1 H4 D1)에서 추세 상태가 표시됩니다. 지표의 장점: 1. 표시기는 높은 정확도의 신호를 생성합니다. 2. 표시 신호는 다시 그려지지 않습니다. 가격이 각 라인을 넘으면 소리 알림(알림 및 메시지)이 장착됩니다. 3. 모든 브로커의 MetaTrader 4 거래 플랫폼에서 거래할 수 있습니다. 4. 모든 자산(통화, 금속, 암호화
Mongol Indicator2
Sumiyabazar Buyanjargal
It's a variation of mid of HH and LL since it compares the higher of HH or LL against a period and twice the number of bars back to avoid whipsaws. I used to display this against lines on a chart, but made a histogram out of it and it looks interesting. It looks good at gauging trend strength and general turns (see image below). The name of the indicator is BAM, which is an acronym for "Below and Above Mid". Ways to use it: 1. To see general trend on longer TFs (more than 30 bars back).
PTW NON REPAINT TRADING SYSTEM + HISTOGRAM Non-Repainting ,   Non-Redrawing   and   Non-Lagging  Trading System. Does the following: - Gives Accurate Entry and Exit Points - Scalping, Day and Swing Trading  - 95% Accuracy  - Targets, where to take profits. - Shows Trends, Support and resistance levels - Works on All Brokers - Works on All Currencies, CFDs and Stocks - It does not place trades for you, it only shows you what trades to place. - It works on All Timeframes - It is for Trend or ran
NEXT price Actions - Daily Pivots 1. Auto Mapping Projection Price Action XAUUSD to get the most accurate setup for each Entry Lines. 2. The tool used has been customized according to Swap Pivots setup. 3. The setup that results after Mapping is suitable for Intraday 4. This setup does not need a marking and depends on SNR & SND. 5. This setup only depends 100% on the tool used. 6. This setup is very suitable for getting an Entry in a shadow candle stick. 7. This setup will also follow th
Lefort
Maksim Pliskach
LEFORT is a multi-currency, fully automatic, high-frequency trading robot. The robot works with any instruments in MT4 on any timeframe. The algorithm of the expert Advisor is as follows Single-scalping trades will. Using the analytical signals module, the robot analyzes the market dynamics, and then makes single trades in the direction of the dominant trend with a profit of several pips. A series of open orders. The robot makes a series of trades on a pullback in the direction of the dominant t
Success comes from knowledge – this is true for most things in life and especially Forex trading. To become successful, a trader needs to learn technical analysis. Technical indicators are a big part of technical analysis. The problem is that, at first sight, names of technical indicators can sound unpleasantly complicated, for example, MACD, RSI or Stochastic. However, we recommend you not to judge a book by its cover. We will provide you with a fair and simple explanation of the most popular t
At the core of the VidyaPearsonFlow Robot lies the synthesis of two key principles : a daptive filtration of market noise and statistical analysis of correlations between major Forex pairs such as EURUSD, GBPUSD, and XAUUSD. This is not merely an algorithm—it is a system that embodies the harmony of mathematical rigor and the flexibility required to operate in the ever-changing market environment. The Essence of the Method: Adaptive Filtration: The system dynamically adjusts to changing market
High Low Predict
Thomas Bradley Butler
This indicator is designed to help you forecast the potential high and low prices for the current trading day, based on the high and low of the previous day. It does this by applying a customizable percentage increase or decrease to those levels. How It Works: The idea is simple: It looks at the previous day's high and low prices and then adjusts them by a percentage you choose. Here's what that means: Predicted High: This is calculated by taking the high price of the previous day and adding a p
Using multiple timeframes for analysis with Multi Timeframe Average Directional Index  can provide several significant benefits for traders: Comprehensive Market View: By applying Mtf ADX Standard across different timeframes, traders gain a broader perspective on market dynamics. This allows them to identify trends, patterns, and potential reversal points that might be more apparent or consistent across various scales. Enhanced Pattern Recognition: Multiple timeframes help in identifying repeati
FREE
SNR LEVEL INDICATOR Accurate Snr level indicator will only display Fresh Levels that are close to the Current Market Price. This indicator is very accurate in mapping Support & resistance levels. there is an alert feature when the price TOUCHES the SNR LEVEL, WHEN CLOSE CANDLE BREAK/REJECT SNR LEVEL. INDICATOR MARKING : - SUPPORT LEVEL = V SHAPE - RESISTANCE LEVEL = APEX LEVEL - GAP RESISTANCE & GAP SUPPORT = OPEN CLOSE CANDLE - SUPPORT BECAME RESISTANCE & RESISTANCE BECAME SUPPORT INDICATOR C
This indicator is meant for Harmonic Traders, it helps them in identifying the formed patterns by analyzing the market past data, looking for Harmonic Patterns. The Patterns that this indicator can detect are: AB=CD Butterfly Gartely Crab Bat The indicator shows the following: The completed pattern, with the critical zone highlighted in Gray box The suggested 3 take profit levels (in green) The Suggested Stop Loss level (in Red) The formed pattern ratios can be checked by hovering the mouse on t
High frequency arbitrage brushing orders! Attention! Attention! Attention!: Low cost and low point platforms are necessary for brushing orders. Please review first and then simulate trading. Do not directly conduct actual trading and test suitable trading varieties A set of arbitrage brushing strategies developed after years of research and development Suggested variety of gold
NO REPAINT ADVANCED CHART PATTERN INDICATOR By definition, a price ( chart)  pattern is a recognizable configuration of price movement that is identified using a series of  trendlines  and/or curves. When a price pattern signals a change in trend direction, it is known as a reversal pattern; a continuation pattern occurs when the trend continues in its existing direction following a brief pause. Advanced Chart Pattern Tracker is designed to find the MOST ACCURATE patterns. A special script is a
ToolBox 360 is the swiss knife of all indicators. It is full packed with useful tools to help you with your trading. It can be used to find best entry and exit points and help you to decide if you should open a trade or not. It shows market trends, candlestick formations outside / inside bars and you can sett time based allerts. Main features: Time based Fibonacci lines Choose a start and end time and the indicator shows you Fibonacci lines within the selected time range including range high a
Pivot levels Auto V1
Hafis Mohamed Yacine
What Is a Pivot Point? A pivot point is a technical analysis indicator, or calculations, used to determine the overall trend of the market over different time frames. The pivot point itself is simply the average of the intraday high and low, and the closing price from the previous trading day. On the subsequent day, trading above the pivot point is thought to indicate ongoing bullish sentiment, while trading below the pivot point indicates bearish sentimen How to Use Pivot Points The very ess
Fibo Linear Channel
Igor Semyonov
4 (1)
Colored indicator of the linear channel based on the Fibonacci sequence. It is used for making trading decisions and analyzing market sentiment. The channel boundaries represent strong support/resistance levels, as they are the Fibonacci proportion levels. Users can select the number of displayed lines of channel boundaries on the chart by means of the input parameters. Attaching multiple instances of the indicator to the chart with different calculation periods leads to displaying a system of c
Volumatic VIDyA MT4
Duc Hoan Nguyen
4.5 (4)
Special offer : ALL TOOLS , just $35 each! New tools   will be   $30   for the   first week   or the   first 3 purchases !  Trading Tools Channel on MQL5 : Join my MQL5 channel to update the latest news from me Volumatic VIDYA (Variable Index Dynamic Average) 는 트렌드를 추적하고 각 트렌드 단계에서 매수 및 매도 압력을 분석하기 위해 설계된 고급 지표입니다. 가변 지수 동적 평균(Variable Index Dynamic Average)을 핵심 동적 평활화 기술로 활용하여 이 도구는 주요 시장 구조 수준에서 가격 및 거래량 역학에 대한 중요한 통찰력을 제공합니다. MT5 버전 보기:  Volumatic VIDyA MT5 다른 제품 보기:    모든 제품 To use iCustom
이 지표는 실제 거래에 완벽한 자동 파동 분석 지표입니다! 사례... 참고:   웨이브 그레이딩에 서양식 이름을 사용하는 데 익숙하지 않습니다. Tang Lun(Tang Zhong Shuo Zen)의 명명 규칙의 영향으로 기본 웨이브를   펜   으로 명명하고 2차 웨이브 밴드를   세그먼트   로 명명했습니다. 동시에, 세그먼트에는 추세 방향이 있습니다.   주요 추세 세그먼트에는   이름이 지정되지만(이 이름 지정 방법은 향후 노트에서 사용됩니다. 먼저 말씀드리겠습니다.) 알고리즘은 굴곡 이론과 거의 관련이 없으므로 그렇게 해서는 안 됩니다. 이는 나의 시장 분석을   통해 요약된 끊임없이 변화하고 복잡한 운영 규칙을   반영합니다. 밴드는 더 이상 사람마다 다르지 않도록 표준화되고 정의되었습니다. 인위적인 간섭의 드로잉 방법은 시장 진입을 엄격하게 분석하는 데 핵심적인 역할을 합니다. 이 지표를 사용하는 것은 거래 인터페이스의 미학을 개선하고 원래의 K-line 거래를
간 스퀘어 지표는 W.D. 간이 쓴 "시장 예측을 위한 수학적 공식" 기사에 기반한 강력한 시장 분석 도구입니다. 이 도구는 수학적 개념과 간 이론을 사용하여 정확한 시장 분석을 수행합니다. 144, 90, 52의 제곱과 9의 제곱을 사용합니다. 또한 의 9의 제곱근 및 해당 제곱의 채널 및 스타 패턴과의 관련성을 통합합니다. 사용자 메뉴얼 및 적용: 이 지표를 사용하기 전에 사용자 메뉴얼을 읽고 질문이 있을 경우 문의하시기 바랍니다. 전체 메뉴얼은 웹사이트에서 제공됩니다. MT5의 전체 버전을 구매하거나 MT4의 무료 버전을 테스트할 수 있습니다. 두 버전 모두 링크에서 확인하실 수 있습니다. 주요 기능 및 기능: 간 스퀘어 지표는 정확한 결정을 위해 기하학적 개념과 간 이론을 활용하는 시장 분석을 위한 포괄적인 도구 집합을 제공합니다. 주요 기능은 다음과 같습니다. 9의 제곱 분석: 이 지표는 9의 제곱에 대한 수평 선, 스타 패턴, 그리드 및 간 팬을 그릴 수 있습니다. 간 이
MP Pivot Levels
Pierre Ksachikian
This indicator contains Pivot Levels of: Traditional Fibonacci Woodie Classic Demark Camarilla Calculation periods can be set to auto / Daily / Weekly / Monthly / Yearly. Number of Levels are editable. Options to hide level labels and price labels. Pivots Points are price levels chartists can use to determine intraday support and resistance levels. Pivot Points use the previous days Open, High, and Low to calculate a Pivot Point for the current day. Using this Pivot Point as the base, three resi
Smart Reversal Signal
Evgeny Belyaev
3 (2)
Smart Reversal Signal  is a professional indicator for the MetaTrader 4 platform; it has been developed by a group of professional traders. This indicator is designed for Forex and binary options trading. By purchasing this indicator, you will receive: Excellent indicator signals. Free product support. Regular updates. Various notification options: alert, push, emails. You can use it on any financial instrument (Forex, CFD, options) and timeframe. Indicator Parameters Perod - indicator calculat
Proinsta78
Mikhail Bilan
3.5 (4)
점은 강한 움직임 방향을 나타냅니다. 자동으로 작동하지 않으며 수동으로 거래를 열고 닫아야 합니다. 포인트에서 직접 이익을 확인하십시오. 스크린 샷에서 파악할 수 있다고 생각합니다. 150-200핍마다 닫습니다. 지표 구독은 예측으로 별도로 협상할 수 있습니다. 개인 메시지 또는 프로필에 표시된 연락처에 씁니다. 나는 외환 주식으로 만 거래하고 다른 것들도 허용됩니다. 이익이나 손실은 그것을 어떻게 사용하느냐에 달려 있습니다. 일단 임대로 시작하세요. 표시기는 신호만 제공하고 추세의 강도를 보여주기 때문에 테스터에 대한 보고서는 없습니다. 2번째 파란색 원이 출현한 후 노란색 2개 이후에 매수 또는 매도 주문을 열 수 있습니다. 변경되었습니다!!! 2021년 7월 23일 좋은 오후입니다 친구들! 이제 구매자의 요청에 따라 구매 또는 판매 조건이 충족되면 표시기가 경고 및 푸시 알림을 보냅니다. MQL 애플리케이션이 설치되어 있으면 푸시 알림이 전화로 옵니다. 애플리케이션에 M
이 제품의 구매자들이 또한 구매함
Dynamic Scalper System
Vitalyi Belyh
5 (1)
" Dynamic Scalper System " 지표는 추세 파동 내에서 스캘핑 방식으로 거래하도록 설계되었습니다. 주요 통화쌍 및 금에서 테스트되었으며, 다른 거래 상품과의 호환성이 가능합니다. 추가적인 가격 변동 지원을 통해 추세에 따라 단기 포지션 진입 신호를 제공합니다. 지표의 원리 큰 화살표는 추세 방향을 결정합니다. 작은 화살표 형태의 스캘핑 신호를 생성하는 알고리즘은 추세 파동 내에서 작동합니다. 빨간색 화살표는 상승 방향을, 파란색 화살표는 하락 방향을 나타냅니다. 민감한 가격 변동선은 추세 방향으로 그려지며, 작은 화살표의 신호와 함께 작용합니다. 신호는 다음과 같이 작동합니다. 적절한 시점에 선이 나타나면 진입 신호가 형성되고, 선이 있는 동안 미결제 포지션을 유지하며, 완료되면 거래를 종료합니다. 권장되는 작업 시간대는 M1~H4입니다. 화살표는 현재 캔들에 형성되며, 다음 캔들이 이미 시작되었더라도 이전 캔들의 화살표는 다시 그려지지 않습니다. 입력 매개
KuKl
IGOR KIRIANEN
The indicator is built on a non-standard Zig Zag, it draws accumulations after which if the price leaves this zone and a test of this zone occurs, then a sound signal is given and an arrow appears - after the test candle closes.The indicator does not redraw its signals, it is very easy to use, there are only three settings 1- this is the zig zag parameter 2- this is the minimum price exit from the zone 3- this is the maximum price exit from the zone. The lower the parameter for Zig Zag, the more
Breakout Arrows Mt4
Michael Oko Oboh
Trend Breakout Arrows Indicator The Trend Breakout Arrows Indicator is a momentum-based signal tool designed to identify potential bullish and bearish breakout opportunities. It displays clear arrow signals directly on the price chart, helping traders quickly recognize possible trend changes and continuation setups. Up Arrow (Buy Signal) A magenta up arrow appears below a candle when bullish momentum begins to strengthen. This signal indicates that buying pressure may be overtaking selling press
Precautions for subscribing to indicator This indicator only supports the computer version of MT4 Does not support MT5, mobile phones, tablets The indicator only shows the day's entry arrow The previous history arrow will not be displayed (Live broadcast is for demonstration) The indicator is a trading aid Is not a EA automatic trading No copy trading function The indicator only indicates the entry position No exit (target profit)  The entry stop loss point is set at 30-50 PIPS Or the front hi
Super Signal – Skyblade Edition 전문가용 노리페인트 / 노래그 트렌드 신호 시스템, 뛰어난 승률 제공 | MT4 / MT5용 1분, 5분, 15분과 같은 낮은 타임프레임에서 가장 좋은 성능을 보입니다. 핵심 기능: Super Signal – Skyblade Edition은 추세 매매를 위해 설계된 스마트 신호 시스템입니다. 이 시스템은 다중 필터 로직을 활용하여, 명확한 방향성과 실질적인 모멘텀이 수반된 고품질 추세만을 감지합니다. 이 시스템은 고점 또는 저점을 예측하지 않으며 , 다음 세 가지 조건이 모두 충족될 때만 신호를 발생시킵니다: 명확한 추세 방향 강화되는 모멘텀 건전한 변동성 구조 또한, 시장 세션 기반의 유동성 분석을 통해 신호의 신뢰성과 타이밍을 더욱 향상시킵니다. 신호 특성: 모든 화살표 신호는 100% 리페인트 없음 / 지연 없음 신호가 한 번 발생하면 고정되며, 깜빡이거나 사라지지 않음 차트 상의 시각적 화살표, 정보 패널, 팝업 알
El indicador "MR BEAST ALERTAS DE LIQUIDEZ" es una herramienta avanzada diseñada para proporcionar señales y alertas sobre la liquidez del mercado basándose en una serie de indicadores técnicos y análisis de tendencias. Ideal para traders que buscan oportunidades de trading en función de la dinámica de precios y los niveles de volatilidad, este indicador ofrece una visualización clara y detallada en la ventana del gráfico de MetaTrader. Características Principales: Canal ATR Adaptativo: Calcula
Meravith
Ivan Stefanov
5 (3)
마켓 메이커를 위한 도구. Meravith는 다음과 같은 기능을 제공합니다: 모든 타임프레임을 분석하고 현재 유효한 추세를 표시합니다. 강세와 약세 거래량이 동일한 유동성 구간(거래량 균형 구간)을 강조 표시합니다. 서로 다른 타임프레임의 모든 유동성 레벨을 차트에 직접 표시합니다. 텍스트 기반 시장 분석을 생성하여 참고용으로 제공합니다. 현재 추세를 기반으로 목표가, 지지선 및 손절가를 계산합니다. 거래의 위험 대비 보상 비율(Risk/Reward)을 계산합니다. 계좌 잔고에 따라 포지션 크기를 산출하고 잠재 수익을 추정합니다. 시장에 중대한 변화가 발생할 경우 경고도 제공합니다. 지표의 주요 라인: 강세/약세 거래량 소진 라인 — 목표가로 사용됩니다. 시장 추세를 나타내는 라인. 시장이 강세인지 약세인지에 따라 색상이 변경되며 추세 지지선 역할을 합니다. 색상은 주로 시장 심리를 보여줍니다. 거래량 균형선(Eq). Eq(Volume Equilibrium) 라인은 시스템의 핵심입니
Gold Channel XAUUSD
Paulo Rocha
5 (4)
Gold Channel is a volatility-based indicator, developed with a specific timing algorithm for the XAUUSD pair, which consists of finding possible corrections in the market. This indicator shows two outer lines, an inner line (retracement line) and an arrow sign, where the theory of the channel is to help identify overbought and oversold conditions in the market. The market price will generally fall between the boundaries of the channel. If prices touch or move outside the channel it is a tradi
CountSig
Yin Zhou Luo
一款信号统计指标(MT4)——实现基于当前图表周期下的单线MA转向和双线MA金叉/死叉统计 . 转向定义:前一K向下或走平,当前K向上,视为转向向上;反之,转向向下。 金死叉定义:前一K快线在慢线下方,当前K快线在慢线上方,为金叉;反之,死叉。 参数及使用说明: 1、可指定统计K线数。 2、可指定4个不同的日内时间段,格式如"03:00-07:59",4个时间段可交叉任意输入。 3、可配置ABC三个浮盈区间段点值。如:分界区间统计小点值设为500,即当某转向信 号出现后到下一反向信号止浮盈<=此点值,计入A区间; 若大于此点值<大分界点值时,计入B区间;若大于“大分界点值”计入C区间。 4、最大/最小浮盈统计。显示所有统计区间内的最大浮盈点值和最小浮盈点值(亏损点值)。 5、输出完整信号,按信号出现顺序排列,如“ACCBCA”之类。 6、综合预测。使用概率、周期、趋势、马尔可夫链等综合概算输出预测该信号出现的归类概率值。 7、加载指定MA线。在当前图表自动载入相应设置的MA线。 8、自适应列宽。以完整显示统计信号数。 9、用法:点击相应统计按钮即输出相应的统计表格.
GEM Signal MT4
Shengzu Zhong
GEM Signal Pro GEM Signal Pro는 MetaTrader 4용 추세추종형 지표로, 차트에서 더 명확한 신호, 더 구조적인 트레이드 설정, 그리고 더 실용적인 리스크 관리를 원하는 트레이더를 위해 설계되었습니다. 단순한 화살표만 표시하는 것이 아니라, GEM Signal Pro는 전체 트레이드 아이디어를 더 깔끔하고 읽기 쉬운 방식으로 보여줍니다. 조건이 확인되면 진입가, 손절가, 목표가를 차트에 표시하여 트레이더가 설정을 더 효율적으로 검토할 수 있도록 도와줍니다. 작동 방식 이 지표는 먼저 내부 로직에 따라 유효한 초기 신호를 식별합니다. 확인 조건이 충족되면, GEM Signal Pro는 차트에 전체 설정을 표시합니다. 이를 통해 트레이더는 거래 구조를 더 명확하게 보고, 수동 분석 작업을 줄일 수 있습니다. 차트에 표시되는 거래 레벨 확인된 신호에 대해, GEM Signal Pro는 다음을 표시할 수 있습니다. 진입가 손절가 목표가 1 목표가 2 목표가 3 손
Trend Signal Advanced System - 은 단기 및 중기 거래를 위한 추세 추종 진입 신호를 제공하는 트레이딩 시스템입니다. 신호 화살표는 현재 캔들스틱에 표시되며, 차트 상단과 하단에서 신호를 생성합니다. 추세는 모든 거래 상품의 변동성에 맞춰 유연하고 사용자 정의 가능한 매개변수를 사용하는 "표준 편차" 지표를 기반으로 합니다. 이 트레이딩 시스템에는 목표 수 익(Take Profit) 및 손절매(Stop Loss) 레벨 플래너가 포함되어 있어 적절한 거래 결과 레벨을 선택하고 결과를 백테스팅할 수 있습니다. 잠재적 거래 신호 궤적선 신호 화살표에서 청산 지점, 손절매 및 목표 수익 레벨까지의 신호 카운터는 캔들스틱의 시가를 기준으로 계산됩니다. M1부터 H4까지 다양한 시간 프레임에서 작동하며 스캘핑 및 데이 트레이딩에 적합합니다. 신호 화살표, "매수" 및 "매도" 알림을 사용할 수 있습니다. 대부분의 신호는 다시 그려지지 않지만, 경우에 따라 현재 캔들스틱
PairMaster Buy Sell Arrow Indicator for MT4 Trade Reversals Like a Pro — Catch Every Swing Point with Precision The PairMaster Buy Sell Arrow Indicator is a powerful MetaTrader 4 tool built to identify high-probability swing trading opportunities . Designed for traders who value accuracy, clarity, and simplicity, PairMaster detects key market turning points and plots intuitive buy and sell arrows directly on your chart. Key Features Accurate Swing Point Detection – Automatically identifies ma
The Nihilist 5.0 Indicator includes Forexalien and Nihilist Easy Trend trading strategies and systems. It is composed of an MTF Dashboard where you can analyze the different input possibilities of each strategy at a glance. It has an alert system with different types of configurable filters. You can also configure which TF you want to be notified on your Metatrader 4 platform and Mobile application The indicator has the option to view how could be a TP and SL by using ATR or fixed points, even w
Binary Booster
Yaroslav Varankin
5 (1)
Binary Options Trading Indicator: A Reliable Tool for Your Trades This indicator is specifically designed for binary options trading and has proven its high quality, reliability, and adequate accuracy, depending on the dynamics of the chart. Key Points: Signal Interpretation: When a blue cross signal appears, it indicates a potential entry into a trade, though it is considered a weak signal on its own. However, if the blue cross is accompanied by an arrow, it is considered a more reliable buy s
Rtc ML Ai Predictor MT4
Muhammad Faisal Sagala
Rtc ML Ai | Predictor CORE MACHINE LEARNING ENGINE Adaptive ML Market Predictor – Multi-Bar Trend & Candle Forecast What This Indicator Does This indicator is a  real-time market prediction engine  designed to analyze price behavior and estimate  future market tendencies . Unlike conventional indicators, this system  does not rely on static parameters or historical curve-fitting , but adapts its internal state dynamically during live market operation. Instead of using static rules, the indic
Quantum Regime Indicator
Gideon Asiamah Yeboah
Product Name:   Quantum Regime Indicator Short Description:   A multi-engine structural regime and volatility filter. Description: Quantum Regime Indicator (QRI) is a sophisticated technical analysis algorithm designed to identify market structure shifts and volatility regimes. Unlike standard indicators that rely on immediate price action, QRI utilizes a hierarchical logic architecture to filter market noise and identify statistical extremes. The indicator is built on the philosophy of "Market
SYSTEM INTRODUCTION:   The Binary Options Channels System Is Specifically Designed For Binary Options Trading. Unlike Other Systems And Indicators That Were Adopted From Other Trading Environments For Binary Options. Little Wonder Why Many Of Such Systems Fail To Make Money . Many End Up Loosing Money For Their Users.  A Very Important Fact That Must Be Noted Is The Fact That Application Of Martingale Is not Required. Thus Making It Safer For Traders Usage And Profitability. A Trader Can Use Fi
Fxland Price Reversal Zones (MT4) FXLAND Smart Reversal Indicator is a professional technical analysis tool designed to help traders identify potential price reversal zones and key market turning points with clarity and precision. The best reversal indicator and price return by choosing only one ceiling or floor in each time frame A masterpiece of combining mathematics and Gann, fractal matrix, Fibonacci, movement angle and time. Completely intelligent Key Features Detects potential pr
OrderFlow Absorption – MT4용 전문 델타 & 흡수 신호 인디케이터 OrderFlow Absorption으로 진정한 오더플로우 분석의 힘을 경험하세요. MetaTrader 4를 위한 궁극의 델타 히스토그램 및 흡수 신호 인디케이터입니다. 가격 움직임의 이면에서 실제로 무슨 일이 일어나는지 알고 싶은 트레이더를 위해 설계된 이 도구는, 시장을 움직이는 숨겨진 매수/매도 압력과 흡수 이벤트를 드러냅니다. 주요 기능 델타 히스토그램 시각화:   매수와 매도 압력을 색상별 히스토그램으로 즉시 확인할 수 있습니다. 흡수 신호 감지:   고급 로직으로 강세 및 약세 흡수 이벤트를 식별하여 반전 신호를 미리 알려줍니다. 차트 마커:   흡수 신호가 차트에 직접 표시되어 시각적으로 쉽게 확인할 수 있습니다. 팝업 알림:   새로운 흡수 신호가 발생하면 실시간으로 알림을 받을 수 있습니다. 사용자 지정 임계값:   약한 신호는 필터링하고, 확률이 높은 기회에 집중할 수 있습니다.
Quantum Momentum Guard (QMG) Advanced Breakout & Momentum Indicator for MetaTrader 4 Quantum Momentum Guard (QMG) is a next-generation MetaTrader 4 trading indicator designed to identify high-probability breakout opportunities using a powerful combination of advanced momentum analysis and high-level mathematical calculations . Unlike ordinary indicators that generate signals based on a single condition, QMG confirms every breakout with momentum strength and mathematical validation , ensuring
The Hurricane Indicator
Paul Nicholas Clevett
5 (1)
Currently switched to the 4 hour chart - but use other time frames for confirmation. :-)  I change my main time frame based on the market movement at the time. The Hurricane Forex Indicator is a multi time frame indicator that includes such things as Trade Notifications, Trade Calculator, Momentum Indicator, risk reward and much more. We have a free Trade room for our users as well. Please check out the video for full details of how this indicator works as it has over 15 years worth of developme
VTrende Pro mt4
Andrii Diachenko
3 (2)
VTrende Pro MT4 - MTF indicator for trend trading with a display panel for MT5 *** Videos can be translated into any language using subtitles (video language - Russian) Although the signals of the VTrende Pro indicator can be used as signals of a full-fledged trading system, it is recommended to use them in conjunction with the Bill Williams TS. VTrende Pro  MT4 is an extended version of the VTrende indicator. Difference between Pro version and VTrende: - Time zones - Signal V - signal 1-2 wave
Naked Forex Kangaroo Tail Pro Indicator Kangaroo Tail Pro Indicator is a pattern recognition indicator for Forex, Stocks, Indices, Futures, Commodities and Cryptos. The Kangaroo Tail is a multi-bar pattern. The Kangaroo Tail pattern is very effective and is very simple to trade. The strategy that comes with the Kangaroo Tail is based on price action. The indicator does what it was designed for: displaying Kangaroo Tail patterns.   Don't expect to follow the up and down arrows and make money
[Trend Line Pro 3]  Trend Line Pro 3 is a discretionary analysis indicator that visualizes swing structure based on Dow Theory / ZigZag concepts and organizes key lines (support/resistance and trendlines) as well as potential break/structure-change points (BreakEdge) directly on the chart. * This product is NOT an EA. It does not place trades or send orders. It helps you organize market structure with the same rules and align your decision criteria more consistently.
Pair Trading Station MT4
Young Ho Seo
3.67 (3)
How to use Pair Trading Station Pair Trading Station is recommended for H1 time frame and you can use it for any currency pairs. To generate buy and sell signal, follow few steps below to apply Pair Trading Station to your MetaTrader terminal. When you load Pair Trading Station on your chart, Pair Trading station will assess available historical data in your MetaTrader platforms for each currency pair. On your chart, the amount of historical data available will be displayed for each currency pai
FFx Engulfing Setup Alerter gives trade suggestions with Entry, Target 1, Target 2 and StopLoss. Below are the different options available: Entry suggestion - pips to be added over the break for the entry 3 different options to calculate the SL - by pips, by ATR multiplier or at the pattern High/Low 3 different options to calculate the 2 TPs - by pips, by ATR multiplier or at Risk/Reward Offset the dashboard - any place on the chart Remove the suggestion once the price reached the SL line Lines
FFx InsideBar Setup Alerter gives trade suggestions with Entry, Target 1, Target 2 and StopLoss. Below are the different options available: Entry suggestion - pips to be added over the break for the entry Minimum candle size - to avoid too close buy/sell entry suggestions 3 different options to calculate the SL - by pips, by ATR multiplier or at the pattern High/Low 3 different options to calculate the 2 TPs - by pips, by ATR multiplier or at Risk/Reward Offset the dashboard - any place on the c
FFx OutsideBar Setup Alerter gives trade suggestions with Entry, Target 1, Target 2 and StopLoss. Below are the different options available: Entry suggestion - pips to be added over the break for the entry. 3 different options to calculate the SL - by pips, by ATR multiplier or at the pattern High/Low. 3 different options to calculate the 2 TPs - by pips, by ATR multiplier or at Risk/Reward. Offset the dashboard - any place on the chart. Remove the suggestion once the price reached the SL line.
FFx PinBar Setup Alerter gives trade suggestions with Entry, Target 1, Target 2 and StopLoss. Below are the different options available: Entry suggestion - pips to be added over the break for the entry Minimum candle size - to avoid too small candles 3 different options to calculate the SL - by pips, by ATR multiplier or at the pattern High/Low 3 different options to calculate the 2 TPs - by pips, by ATR multiplier or at Risk/Reward Offset the dashboard - any place on the chart Remove the sugges
Lineverse Trendlines
Arkady Segal
5 (1)
Automatic, live & interactive picture of all trendlines. Assign push, email and sound alerts to the lines of your choice and be informed about price rollback, breakout, rollback after breakout, number of rollbacks, line expiration by double breakout. Correct, drag or delete the lines and interactively tune the line system. https://youtu.be/EJUo9pYiHFA . Chart examples https: //www.mql5.com/en/users/efficientforex Price Interaction Events All events are effective immediately and only after one
제작자의 제품 더 보기
The Liquidation Zones Heatmap is a custom technical indicator designed for the MetaTrader 4 (MT4) platform. It calculates and visualizes estimated liquidation zones based on price action and internal algorithms, displaying them as a dynamic heatmap on the chart. These zones are known by several names, sometimes referred to as liquidity pools, liquidity levels, leverage levels, liquidation heatmap levels, leverage heatmap zones, or leverage heatmap levels. These zones represent potential areas of
The Smart Liquidation Clusters  is a custom technical indicator designed for the MetaTrader 4 (MT4) platform. It calculates and visualizes   estimated liquidation zones   based on price action and internal algorithms, displaying them as a dynamic heatmap on the chart. These zones are known by several names, sometimes referred to as liquidity pools, liquidity levels, leverage levels, liquidation heatmap levels, leverage heatmap zones, or leverage heatmap levels. These zones represent   potential
Auto Elliott Engine The Auto Elliott Engine   is a tool designed for MetaTrader 5 that automates the identification, decomposition, and projection of price structures based on the Elliott Wave Theory. Powered by a pattern-recognition engine, this indicator processes price action to identify market configurations, translating data into structured scenarios. Key Features Multi-Degree Recognition:   Analyzes price action across multiple fractal levels. From higher degrees, such as Supercycle or Cyc
The   Smart Liquidation Clusters    is a custom technical indicator designed for the MetaTrader 5 (MT5) platform. It calculates and visualizes   estimated liquidation zones   based on price action and internal algorithms, displaying them as a dynamic heatmap on the chart. These zones are known by several names, sometimes referred to as liquidity pools, liquidity levels, leverage levels, liquidation heatmap levels, leverage heatmap zones, or leverage heatmap levels. These zones represent   potent
SMC Framework Pro
Enrique Gauto Sand
SMC Framework Pro is a technical analysis indicator developed for the MetaTrader 5 platform. It integrates multiple tools commonly associated with Smart Money Concepts (SMC) into a single environment, focusing on the visualization of price action, market structure, and selected price patterns. The indicator processes historical and incoming price data to identify structural points, price imbalances, and recurring formations. Its purpose is to assist in chart analysis by organizing this informati
SMC Pattern Detector
Enrique Gauto Sand
SMC Pattern Detector  is a technical analysis tool based on  Smart Money Concepts (SMC) . This indicator automates the identification of market structure, supply/demand zones, and SMC patterns. Built on a  No-Repaint  architecture, all signals are confirmed on closed bars. We believe in 100% transparency. Don't just rely on screenshots; watch how the indicator reacts to real-time market conditions. Check out our recorded live streams to see the scalping setups and signals as they happen. Watch t
필터:
리뷰 없음
리뷰 답변