E2C Lines

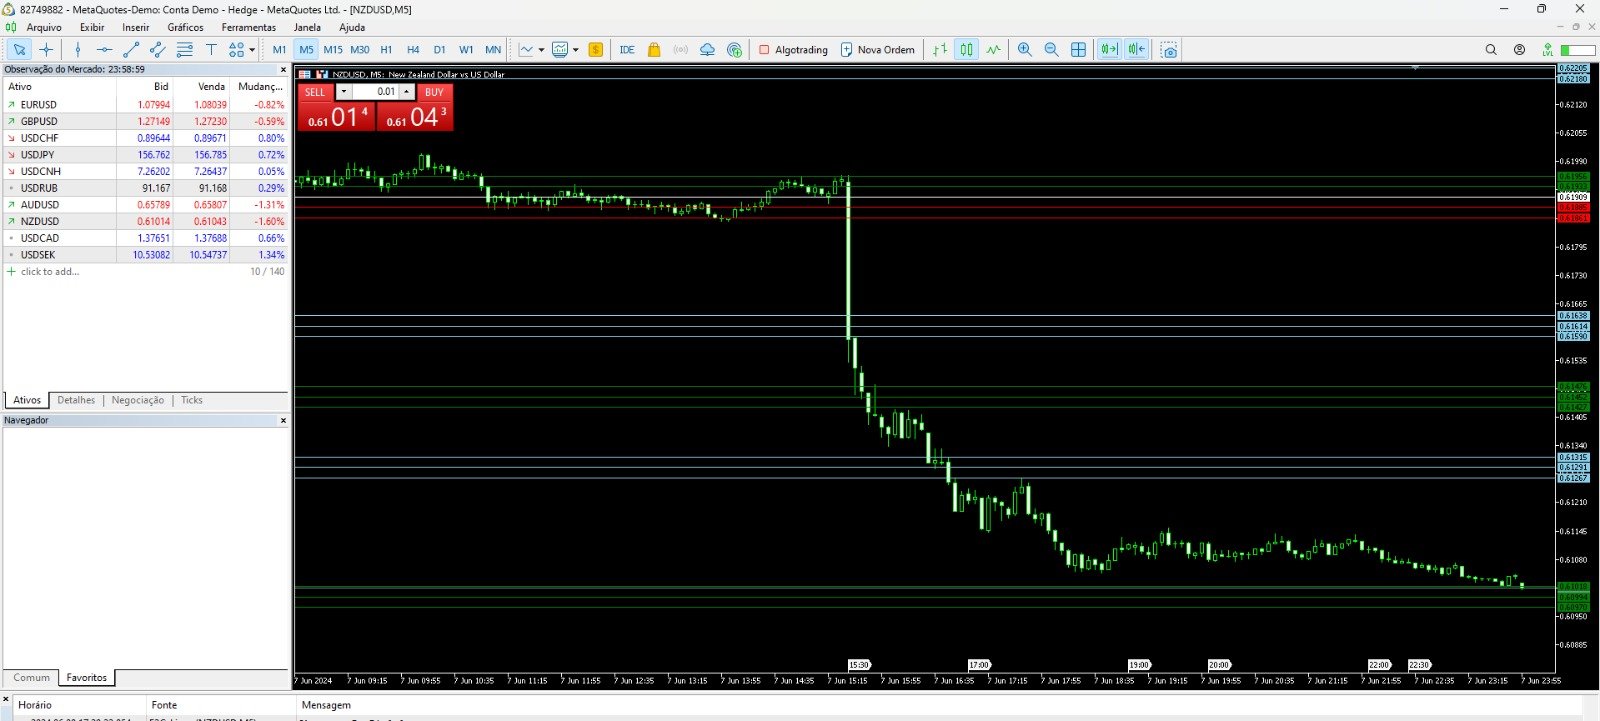
Descubra o poder do nosso indicador de alta precisão, projetado para identificar as regiões de alvo e exaustão de qualquer ativo. Testado e validado por mais de 3 anos nos mercados de mini dólar e mini índice, ele oferece confiabilidade e eficácia incomparáveis. Transforme sua estratégia de trading e alcance novos patamares de sucesso com nossa ferramenta inovadora.
추천 제품
Session Momentum Dashboard – 미래형 트레이딩 분석 아시아/런던/뉴욕 3대 세션을 분석하고, Kill Zone 감지, 아시아 레인지 돌파, 모멘텀 점수를 실시간으로 제공하는 전문 트레이딩 대시보드. Session Momentum Dashboard ICT / Smart Money 트레이더를 위한 올인원 시장 세션 모니터링 도구. 주요 기능: 3대 주요 세션 분석 아시아, 런던, 뉴욕 세션의 실시간 상태 표시. Kill Zone 감지 런던 Kill Zone (07:00–09:00) 뉴욕 Kill Zone (12:00–14:00) 자동 알림 지원. 아시아 레인지 브레이크아웃 아시아 레인지 그래픽 표시 상방/하방 돌파 감지 모멘텀 스코어링 세션별 RSI 기반 진행 바 거래량 분석 거래량 대비 평균 비율 분류: LOW / NORMAL / HIGH 트레이딩 신호 다음 요소가 결합될 때 강력한 신호 생성: Kill Zone + Breakout + Momentum 런던/뉴욕
Previous Candle Levels MT5
Wachinou Lionnel Pyrrhus Sovi Guidi
1 (1)
Previous Candle Levels MT5 shows the previous candle levels, it shows the previous candle Open High Low Close levels (OHLC Levels) in different time frame. It's designed to help the trader to analyse the market and pay attention to the previous candle levels in different time frame.  We all know that the OHLC Levels in Monthly, Weekly and Daily are really strong and must of the time, the price strongly reacts at those levels. In the technical analysis, the user can use them as a support and res
FREE
Gabus Niveles
Gabriel Antonio Diaz Quevedo
Niveles G: Institutional Levels & Volume Profile Map The Edge of Professional Trading Niveles G is not just another indicator; it is a comprehensive mapping tool that automates the identification of high-relevance institutional zones. Professional traders and algorithms don't react to random prices—they react to specific liquidity anchors. Niveles G plots these anchors automatically, keeping your chart clean and your strategy focused. Why These Levels Are Crucial? In trading, these levels repres
"Blow It Up!" – The Trading Indicator That Questions Your Life Choices Tired of boring indicators? Meet your new market companion that delivers:   "YOLO BUY!" arrows   when you should probably panic   Explosive rectangle confetti   (because why not?)   200+ soul-crushing quotes   like   "Your stop loss is imaginary"   and   "This isn’t trading, it’s donating to whales"   Random alerts that roast your strategy This Indicator is like Therapy   – Because daytrading shouldn’t feel
Aussenstab Markttechnik
Alexander Josef Zeidler
This indicator shows external bars ("Aussenstäbe") in the chart in candle form. The colors of the candles can be set individually. Also different colors for bearish and bullish bars are possible. In addition, the color of the wicks or outlines is also adjustable. Outside bars are mentioned e.g. by Michael Voigt in the book "Das große Buch der Markttechnik". All other candles are inner bars.
MetaTrade Hub   is an easy-to-use and customizable tool. This product is presented in an attractive   graphical interface  that allows you to send adjustable signals in two ways ( Manual or Automatic ) from   Metatrader5   to the   Telegram channel or Discord channel.   In this case, your account becomes a   Signal Provider.  You can also share N ews reports with others. All   message formats   -   language   -   emojis   can be adjusted and personalized. You can   Enable   or   Disable   certai
ToolBox 360 is the swiss knife of all indicators. It is full packed with useful tools to help you with your trading. It can be used to find best entry and exit points and help you to decide if you should open a trade or not. It shows market trends, candlestick formations outside / inside bars and you can sett time based allerts. Main features: Time based Fibonacci lines Choose a start and end time and the indicator shows you Fibonacci lines within the selected time range including range high a
Trend Vision
Abderrahmane Benali
Important Reminder: If you find this tool helpful ,   please support the work by leaving a comment or rating . Avoid using it without showing support. Your feedback motivates further development! Trend Vision -   SuperTrend PRO   Take your trading to the next level with a powerful upgrade to one of the market’s most trusted trend-following indicators! SuperTrend PRO has been optimized to deliver precise signals based on the strength of the ATR, with smart alerts sent instantly to your phone wh
Overview : The Advanced News Trading Panel is a versatile tool designed for traders who rely on news-based trading strategies. This Expert Advisor (EA) provides an intuitive graphical interface that allows users to quickly set up pending orders and manage risk with ease. With the ability to automatically place Buy/Sell Stop orders based on your pre-set stop order distance from the bid/ask price, stop-loss and take-profit levels, the EA allows for precision trading during high-volatility news eve
StopAndTake
Oleksandr Kashyrnyi
5 (1)
제품 이름: StopAndTake — 간단하고 빠르며 정확한 SL/TP 관리 스크립트 제품 설명: StopAndTake 는 자신의 포지션을 관리하는 데 있어 속도, 정확성 및 신뢰성을 중시하는 트레이더를 위해 설계된 가볍고 직관적인 스크립트입니다. 이 도구를 사용하면 선택한 차트의 모든 포지션에 대해 **스톱로스(SL)**와 테이크프로핏(TP) 수준을 즉시 업데이트할 수 있습니다. 사용법은 매우 간단합니다. 장점과 혜택: 간단한 사용법: 초보자도 쉽게 이해할 수 있는 최소한의 인터페이스. 초고속 실행: 모든 작업이 몇 초 내에 완료됩니다. 정확성: SL/TP 수준을 마지막 소수점까지 정확하게 설정. 편리함: 스크립트를 차트에 드래그하기만 하면 나머지는 자동으로 처리됩니다. 안정성: 변경 전 모든 데이터를 검증하여 오류나 원치 않는 동작을 방지합니다. 주요 기능: 자동 SL/TP 조정: 현재 심볼의 모든 포지션에 대해 수준을 즉시 업데이트. 다양한 거래 유형 지원: BUY 및 SEL
FREE
Bid Price Timer Indicator — 정밀한 타이밍과 스마트한 가격 추적! Bid Price Timer Indicator 는 시간, 정확도, 명확성 을 중요시하는 트레이더를 위해 설계된 강력한 도구입니다. 주요 기능: 고정 타이머 표시 – 타이머는 항상 차트의 오른쪽 에 표시되며, X_Offset 으로 위치를 조정할 수 있습니다. 실시간 가격 추적 – 타이머는 매수 호가 (Bid 가격) 에 따라 위아래로 부드럽게 이동 합니다. 자동 위치 조정 – 가격이 변경되면 타이머가 자동으로 새로운 가격 수준에 맞게 이동 합니다. 선택 가능한 수평선 표시 – 정확한 Bid 가격 수준 을 시각적으로 보여줍니다. ️ 1초 단위 실시간 업데이트 – 타이머는 매초 갱신되며 , 다음 캔들까지의 카운트다운 을 실시간으로 보여줍니다. 트레이더들이 좋아하는 이유: 정확한 캔들 마감 타이밍 을 예측할 수 있습니다 차트를 깔끔하고 현대적이며 직관적 으로
Pan PrizMA CD Phase
Aleksey Panfilov
The Expert Advisor and the video are attached in the Discussion tab . The robot applies only one order and strictly follows the signals to evaluate the indicator efficiency. Pan PrizMA CD Phase is an option based on the Pan PrizMA indicator. Details (in Russian). Averaging by a quadric-quartic polynomial increases the smoothness of lines, adds momentum and rhythm. Extrapolation by the sinusoid function near a constant allows adjusting the delay or lead of signals. The value of the phase - wave s
Visual Trend Flux Analyzer Indicator
AL MOOSAWI ABDULLAH JAFFER BAQER
Visual Trend Flux Analyzer: Your Ultimate Guide to Market Momentum Unlock a clearer, more intuitive way to view market trends and momentum with the Visual Trend Flux Analyzer. This powerful indicator for MetaTrader 5 is designed to cut through market noise and provide you with a clean, visual representation of trend strength and potential reversals. Stop guessing the market's direction and start making informed decisions based on a sophisticated, multi-layered analysis. For just $30, you can eq
PREngulfing
Slobodan Manovski
PR EA - Engulfing Pattern Trading System Automated Engulfing Pattern Detection with MA Confirmation The PR EA is a Meta Trader 5 expert advisor that identifies and trades bullish/bearish engulfing candlestick patterns when confirmed by a moving average filter. Designed for swing trading on 30-minute charts with compatibility for M15 and H1 time frames. Key Features: Pattern Recognition - Detects valid bullish/bearish engulfing candle formations Trend Confirmation - 238-period SMA filter
Supply and Demand Monster
Tsog Erdene Borjigon Enkhkhudulmur
Supply and demand zones are at the heart of   supply and demand trading . These zones are areas that show  liquidity at a specific price.  The supply zone is also called the distribution zone, while the demand zone is called the accumulation zone.   Our indicator automatically draw supply and demand zones in Metatrader 5. It give opportunity to understand trading zone and avoiding risk.
Ultimate Trade and Alert Assistant Demonstration Video;  https://youtu.be/JEsU5Qic_bo?si=-feUD0Zr3qdPjomg Elevate Your Trading with Precision and Control Introducing the Ultimate Trade and Alert Assistant by Feedosky, a powerful and versatile Expert Advisor (EA) for MetaTrader 5 (MT5) designed to empower traders with precise price alerts, seamless trade execution, and intelligent position management. Whether you are a seasoned trader or just starting out, this EA combines cutting-edge automation
Gann Box MT5
Frederic Jacques Collomb
Gann Box 지표는 트레이더가 시장의 핵심 수준을 식별하고 활용할 수 있도록 설계된 강력하고 다재다능한 도구입니다. 이 지표는 차트에 직사각형을 그릴 수 있게 해주며, 자동으로 전략적 수준인 0, 0.25, 0.50, 0.75, 1 로 여러 영역으로 나뉩니다. 가격이 이 중 하나의 수준에 도달하면 경고가 활성화되어 거래 결정을 내리는 데 귀중한 도움을 제공합니다. 그리신 영역에 대한 시장의 변화를 즉시 알 수 있습니다. 영역을 그리려면 간단한 직사각형을 그리고 이름을 GannBox 로 바꾸기만 하면 됩니다. 이 지표는 지지 및 저항 , 공급 및 수요 개념을 사용하는 트레이더, ICT 기술을 사용하는 트레이더, 또는 공정 가치 갭 (FVG) 전문가 등 모든 유형의 트레이더를 위해 설계되었습니다. 일일 거래자, 스윙 거래자 또는 포지션 거래자이든, Gann Box 는 시장의 움직임을 더 잘 이해하고 예측하는 데 도움을 주어 반응성과 성과를 향상시킵니다. MT4 버전 Gann Box
Automated Report Generator for the Spanish Treasury. Modelo 720. This utility allows you to generate a panel report with the information necessary to fill out the Spanish tax form 720 form. You just have to load this utility on any graph and timeframe, once the report and panel have been generated, the EA will close automatically. This includes: Current account balance in the reference currency Calculated balance as of December 31, 20XX in the reference currency Total movements between Octob
Seasonal Pattern Trader
Dominik Patrick Doser
Disclaimer : Keep in mind that seasonal patterns are not always reliable. Therefore, thoughtful risk management is crucial to minimize losses.  Seasonal patterns in the financial world are like a well-guarded secret that successful investors use to their advantage. These patterns are recurring price movements that occur during specific periods or around special events. Additionally, there are also intraday patterns that repeat. For example, Uncle Ted from Forex Family suggests examining previou
MultiWay EA
PAVEL UDOVICHENKO
4.89 (19)
MultiWay EA는 강력한 평균회귀 전략에 기반한 스마트하고 효율적인 자동 매매 시스템입니다. 아홉 개의 상관된 (심지어 일부는 일반적으로 “추세형”) 통화쌍 — AUDNZD, NZDCAD, AUDCAD, USDCAD, EURUSD, GBPUSD, EURCAD, EURGBP, GBPCAD — 에 분산 투자함으로써, 강한 방향성 충격 이후 가격이 평균으로 되돌아오는 움직임을 포착합니다. 구매 후 전체 설치 지침을 받으려면 개인 메시지를 보내주세요. 실시간 신호:  여기를 클릭하세요 현재 가격 —   다음 10명의 구매자에게 단 $1937. MultiWay EA는 단순함, 안정성, 명확한 논리를 중요시하는 트레이더에게 완벽합니다 — 복잡한 설정은 필요 없지만, 매우 유연한 자금 관리 및 리스크 제어 옵션을 제공합니다. 이 EA는 진정한 “설정 후 잊기” 철학을 따릅니다. 사용자의 개입이 거의 필요 없으며, 수년간 안정적으로 작동할 수 있어 장기 전략에 이상적입니다. M
Quant Panel
Kevin Craig E Gittins
Quant Panel Pro The Ultimate Multi-EA Performance Dashboard for Quantitative Traders Stop juggling multiple charts or external tools to monitor your algorithmic strategies! Quant Panel Pro delivers institutional-grade portfolio monitoring in one sleek, professional interface. Key Features Quantitative Analytics at Your Fingertips Real-time P&L aggregation   across all Expert Advisors Statistical win rate analysis   with trade frequency metrics Advanced drawdown tracking   (realized & unrealized
FibonacciGrid
Gerson Callanaupa
Fibonacci Grid EA   representa la evolución definitiva en sistemas de trading semi automatizado. Combina la precisión matemática de los   niveles Fibonacci   con una gestión de riesgo inteligente que hace que las operaciones sean casi infalibles.   CARACTERÍSTICAS PRINCIPALES ESTRATEGIA BASADA EN FIBONACCI PROBADA Utiliza los   niveles dorados   de Fibonacci (0.236, 0.382, 0.618, 0.786) Reconoce automáticamente   los puntos swing highs y lows Coloca órdenes pendientes en   múltiples nivele
Super Suavizador Inteligente
Cesar Juan Flores Navarro
El Super Suavizador Inteligente es la culminación de la evolución de los suavizadores en funcion del precio, funciona en todos los pares de divisas, es fácil de usar, y puedes usarlo varias veces en un mismo par, afin de darte una idea de hacia donde va el precio, muy util para ver la tendencia a largo plazo. El SSI trata siempre de formar ondas de subidas y bajadas a fin de poder mostrar el máximo y/o mínimo de la tendencia del precio.
Break Retest
Ongkysetiawan
BREAK RETEST NON-REPAINT. WORKS BEST AT M15 AND ABOVE.  Benefits Fewer false breakouts . Combining close confirmation + retest + previous-close filter greatly reduces noise vs. raw high/low breaks. Tighter execution plans . The drawn level line gives an objective spot for entries, stop placement (just beyond the level), and partial-take-profit structure. Non-repainting confidence . Signals are placed on current bar. Flexible across markets . Works on FX, indices, metals, crypto; scalping on M15
GEN SignalBunker
Gede Egi Narditya
INDICATOR: GEN SignalBunker Developer: gedeegi General Description GEN SignalBunker is an indicator designed to identify strong trading signals after the market has gone through a period of consolidation (sideways). This indicator automatically detects "ranging" market conditions using two selectable methods: the ADX method or the Volatility method. Once a ranging condition is detected, the indicator waits for a breakout signal from its dynamic channel. When a breakout occurs, it generates a cl
Pendiente de Precio
Cesar Juan Flores Navarro
Indicador en base a la pendiente de la linea de precio, dibuja una línea de color cuando sube a base de los precios que previamente has sido procesados o linealizados, y cuando baja la pendiente la linea linealizada toma otro color. En este caso se a considerado 6 lineas de diferentes procesos desde pendientes largas hacia las cortas, observándose que cuando coincidan las pendientes se produce un máximo o mínimo, lo que a simple vista nos permitirá hacer una COMPRA O VENTA.
News Trading Stopper
Fabriel Henrique Dosta Silva
Proteção contra volatilidade durante eventos de notícias Movimentos bruscos de mercado são comuns durante a divulgação de notícias econômicas. Esses eventos impactam significativamente as operações de negociação, volatilidade inesperada e podem resultar em perdas. O Impacto das Notícias no Mercado 1. Volatilidade inesperada: notícias econômicas podem causar flutuações graves de preços, potencialmente levando a perdas. 2. Imprevisibilidade: A incerteza em torno do impacto das notícias pode in
Trend Strength Visualizer
Alexander Denisovich Jegorov
Trend Strength Visualizer A Simple Tool for Trend Analysis This indicator helps you quickly assess the strength of market trends using fast and slow moving averages. It’s designed to give you a clear visual representation of the trend, so you can make better trading decisions. ~Displays: Green Line : Strong uptrend (potential buying opportunities). Red Line : Strong downtrend (potential selling opportunities). ~Values That Can Be Changed: Fast MA period. Slow MA period. Line color for uptrend an
BTMM Continuation Sessions + Re-Entry Indicator (MT5) is a chart visualization tool designed to make continuation trading clearer and faster. It draws session boxes (Asian, London, New York)  and marks continuation entry + re-entry  opportunities during active sessions.  Works on Forex pairs and XAUUSD (depending on broker symbols). This is an indicator (not an EA). It does not place trades automatically. Key Features Session Boxes Asian, London, New York boxes Custom colors, opacity,
FREE
이 제품의 구매자들이 또한 구매함
ARIPoint
Temirlan Kdyrkhan
ARIPoint is a powerful trading companion designed to generate high-probability entry signals with dynamic TP/SL/DP levels based on volatility. Built-in performance tracking shows win/loss stats, PP1/PP2 hits, and success rates all updated live. Key Features: Buy/Sell signals with adaptive volatility bands Real-time TP/SL/DP levels based on ATR Built-in MA Filter with optional ATR/StdDev volatility Performance stats panel (Success, Profit/Loss, PP1/PP2) Alerts via popup, sound, push, or email Cu
Azimuth Pro
Ottaviano De Cicco
5 (4)
LAUNCH PROMO Azimuth Pro price is initially set at 299$ for the first 100 buyers. Final price will be 499$ . THE DIFFERENCE BETWEEN RETAIL AND INSTITUTIONAL ENTRIES ISN'T THE INDICATOR — IT'S THE LOCATION. Most traders enter at arbitrary price levels, chasing momentum or reacting to lagging signals. Institutions wait for price to reach structured levels where supply and demand actually shift. Azimuth Pro maps these levels automatically: swing-anchored VWAP, multi-timeframe structure lines, an
Pointer Trend Switch — precision trend reversal indicator Pointer Trend Switch is a high-precision arrow indicator designed to detect key moments of trend reversal based on asymmetric price behavior within a selected range of bars. It identifies localized price impulses by analyzing how far price deviates from the opening level, helping traders find accurate entry points before a trend visibly shifts. This indicator is ideal for scalping, intraday strategies, and swing trading, and performs equa
Transaction Speed MT5
Ivan Stefanov
5 (3)
이 지표는 시장에서 관심이 나타나는 영역 을 강조 표시한 후, 주문이 누적되는 영역 을 보여줍니다. 이는 **대규모 오더북(호가창)**처럼 작동합니다. 이것은 거대한 자금 을 위한 인디케이터입니다. 성능은 탁월하며, 시장에서 어떤 관심이 있든 반드시 포착할 수 있습니다 . (이것은 완전히 새로 작성되고 자동화된 버전 입니다 – 이제 수동 분석은 필요하지 않습니다.) **거래 속도(Transaction Speed)**는 새로운 개념의 인디케이터로, 시장에 대규모 주문이 언제, 어디에 쌓이는지를 보여주며 , 그 이점을 분석합니다. 매우 초기 단계에서 트렌드 전환 을 감지할 수 있습니다. FX 시장에서 흔히 사용하는 "거래량(volume)"은 오해입니다. 실제로는 시간당 가격 변화량 이므로, 올바른 용어는 거래 속도 입니다. 우리가 어떻게 사고하고, 행동하며, 분석하느냐 가 가장 중요합니다. 분석 패러다임의 전환 은 필수적입니다. 이 인디케이터는 외환 시장에서의 볼륨 개념을 논리적으로
TrendMaestro5
Stefano Frisetti
note: this indicator is for METATRADER4, if you want the version for METATRADER5 this is the link:  https://www.mql5.com/it/market/product/108106 TRENDMAESTRO ver 2.5 TRENDMAESTRO recognizes a new TREND from the start, he never makes mistakes. The certainty of identifying a new TREND is priceless. DESCRIPTION TRENDMAESTRO identifies a new TREND in the bud, this indicator examines the volatility, volumes and momentum to identify the moment in which there is an explosion of one or more of these da
" Dynamic Scalper System MT5 " 지표는 추세 파동 내에서 스캘핑 방식으로 거래하도록 설계되었습니다. 주요 통화쌍 및 금에서 테스트되었으며, 다른 거래 상품과의 호환성이 가능합니다. 추가적인 가격 변동 지원을 통해 추세에 따라 단기 포지션 진입 신호를 제공합니다. 지표의 원리 큰 화살표는 추세 방향을 결정합니다. 작은 화살표 형태의 스캘핑 신호를 생성하는 알고리즘은 추세 파동 내에서 작동합니다. 빨간색 화살표는 상승 방향을, 파란색 화살표는 하락 방향을 나타냅니다. 민감한 가격 변동선은 추세 방향으로 그려지며, 작은 화살표의 신호와 함께 작용합니다. 신호는 다음과 같이 작동합니다. 적절한 시점에 선이 나타나면 진입 신호가 형성되고, 선이 있는 동안 미결제 포지션을 유지하며, 완료되면 거래를 종료합니다. 권장되는 작업 시간대는 M1~H4입니다. 화살표는 현재 캔들에 형성되며, 다음 캔들이 이미 시작되었더라도 이전 캔들의 화살표는 다시 그려지지 않습니다. 입
UZFX {SSS} 스캘핑 스마트 시그널 MT5는 빠르게 움직이는 시장에서 정확한 실시간 신호를 요구하는 스캘퍼, 데이 트레이더, 스윙 트레이더를 위해 설계된 리페인팅 없는 고성능 트레이딩 지표입니다. (UZFX-LABS)에서 개발한 이 지표는 가격 행동 분석, 추세 확인, 스마트 필터링을 결합하여 모든 통화 쌍과 시간대에서 높은 확률의 매수 및 매도 신호를 생성합니다. 주요 기능 스마트 신호 감지 – 강력한 추세 반전 및 지속 패턴을 정밀하게 식별합니다. 다중 시간대 스캘핑 – 모든 시간대에서 완벽하게 작동합니다. 사용자 지정 알림 – 모든 신호에 대해 팝업, 이메일 및 모바일 알림을 받습니다(구성 가능). 명확한 시각적 화살표 – 차트에서 쉽게 식별할 수 있는 파란색(매수) 및 빨간색(매도) 화살표. 신호 강도 조정 – 단기, 중기, 장기 거래에 맞춰 신호 강도 조절 가능. 사용자 친화적 인터페이스 – 재그리기나 지연 없는 깔끔한 차트 표시. 작동 원리 UZFX SSS 지표는
ARICoins
Temirlan Kdyrkhan
ARICoin is a powerful trading companion designed to generate high-probability entry signals with dynamic TP/SL/DP levels based on volatility. Built-in performance tracking shows win/loss stats, PP1/PP2 hits, and success rates all updated live. Key Features: Buy/Sell signals with adaptive volatility bands Real-time TP/SL/DP levels based on ATR Built-in MA Filter with optional ATR/StdDev volatility Performance stats panel (Success, Profit/Loss, PP1/PP2) Alerts via popup, sound, push, or email Cust
ARIScalping
Temirlan Kdyrkhan
ARIScalp is a powerful trading companion designed to generate high-probability entry signals with dynamic TP/SL/DP levels based on volatility. Built-in performance tracking shows win/loss stats, PP1/PP2 hits, and success rates all updated live. Key Features: Buy/Sell signals with adaptive volatility bands Real-time TP/SL/DP levels based on ATR Built-in MA Filter with optional ATR/StdDev volatility Performance stats panel (Success, Profit/Loss, PP1/PP2) Alerts via popup, sound, push, or email Cus
AriX
Temirlan Kdyrkhan
AriX Indicator for MT5 A powerful trend-following and signal-evaluation tool AriX is a custom MT5 indicator that combines Moving Averages and ATR-based risk/reward logic to generate clear buy/sell signals. It visualizes dynamic SL/TP levels, evaluates past trade outcomes, and displays win/loss statistics in a clean on-chart panel. Key features include: Buy/Sell signals based on MA crossovers ATR-based SL/TP1/TP2/TP3 levels with visual lines and labels Signal outcome tracking with real-time stat
Weis Wave with Alert MT5
Trade The Volume Waves Single Member P.C.
4.94 (17)
Rental/Lifetime Package Options and Privileges  Rent Monthly Six Months   Yearly/Lifetime Weis Wave with Speed with Alert+Speed Index x x x Manual  x x x Quick Set up Video x x x Blog x x x Lifetime Updates x x x Setup and Training Material x x Discord Access Channel "The SI traders"          x Rectangle Break Alert Tool      x How to trade with it:    http://www.tradethevolumewaves.com   ** If you purchase please contact me to setup your  : Training Room and  complete manual access.  Wei
Jita Indicator Pro MT5 | All Timeframes Professional Trend Agreement System – Premium Edition ($500) What Is Jita Indicator Pro? Jita Indicator Pro is a structured trend-confirmation system designed for serious traders who value precision, alignment, and controlled signal behavior. It combines: Advanced band-based trend direction logic ATR-driven structural trigger engine Dual-confirmation agreement system Locked history update design This indicator prints signals only when multiple conditions
Scalping Winning Signals Pro SWS
Muhammad Usman Siddique
5 (1)
UZFX SWS {스캘핑 승리 신호} 프로 v1.0은 빠르게 움직이는 시장에서 정확한 진입 신호를 찾는 스캘퍼, 데이 트레이더, 스윙 트레이더를 위해 Usman Zabir(UZFX LABS)가 특별히 개발한 강력하고 재도색되지 않는 지표입니다. 지연이나 잘못된 재도색 없이 신뢰할 수 있는 실시간 신호를 요구하는 트레이더에게 이상적입니다. 추천* 최적 시간대: 30분 이상. {1시간}이 가장 선호하며, 결과는 놀라울 정도입니다...! 주요 기능: 최근 및 과거 신호를 명확한 시각적 화살표로 표시(오래된 신호는 점으로 표시 옵션 포함). 자동 계산 및 그리기 기능: 진입선, 손절선(최근 스윙 저점/고점 기준), 다중 이익실현선(RRR 1:1, 2:1, 3.5:1 – 완전 커스터마이징 가능). 최신 신호 세부사항, 진입가, 손절선, 이익실현선을 표시하는 차트 내 정보 패널. 종합 알림: 팝업, 소리, 푸시 알림, 이메일. 차트 커스터마이징 옵션(색상, 배경, 캔들 스타일). 안전한
AlgoEAs Trend Dashboard V1 Indicator for MT5 Introduction: This is a Dashboard Indicator based on 7 built in Multi Timeframe indicators. This strategy gives Buy/Sell Ideas based on 9 trend states. Easy to view gas guage to view current trend. Has as optional Alerts to enable with 9 messages. Run on M15 chart, with M15, H1, and H4 indicator time frames. Great tool! Features: Non-Repainting Dashboard For Desktop MT5 Only, Works On Any Mt5 Pair Great for Intraday and Swing Trading Easy view gas
Big Player Range
Thalles Nascimento De Carvalho
5 (3)
BigPlayerRange – MT5 최고의 지표 BigPlayerRange 는 MetaTrader 5에서 미니 인덱스와 미니 달러를 위한 최고의 지표 로 평가받고 있습니다. 이 도구는 주요 기관 투자자들의 전략적 영역을 강조하여 높은 정확도의 기관 기술 분석을 제공합니다. BigPlayerRange 사용법: 이 지표는 매수 구간(녹색선)과 매도 구간(빨간선)을 표시합니다. 가격이 이 구간 밖에서 마감되면 추세 움직임이 예상됩니다. 녹색선 위에서 마감: 강한 매수세와 상승 추세 가능성. 빨간선 아래에서 마감: 매도 압력과 하락 가능성. 범위 내에서 마감: 횡보 시장, 돌파 신호 대기. 주요 혜택: 기관 투자자 영역 매핑: 주요 투자자들의 활동 구간을 식별합니다. 자동 목표 지점 산출: 거래 종료에 적합한 목표 지점을 제공합니다. 풀백 분석: 리스크 관리를 위한 가격 반등 가능성 평가. 활용 방법: BigPlayerRange와 함께 Imba
IVISTscalp5
Vadym Zhukovskyi
5 (6)
당신에게 소개하는 iVISTscalp5 지표는 독특하면서도 거래 작업에서 효과적입니다. 이 지표는 시간 데이터를 기반으로 하며 금융 시장의 많은 경험과 깊은 분석의 결과입니다. iVISTscalp5 지표는 수동 거래에 뛰어난 도구입니다. 편리성, 간단함 및 시각화 - 모든 복잡성은 숨겨져 있습니다. 우리는 iVISTscalp5 지표의 설정과 사용을 최대한 단순화했습니다. 이 지표는 MT5 터미널에서 가지고 있는 모든 금융 상품에 적합합니다. 시간 기준으로 작동하는 시간은 4am에서 8pm (UTC+3)입니다. iVISTscalp5 지표 메뉴 (스크린샷 1 참조): History - 표시할 주간 수 계산 dT_min - 시간 설정 간격 선택 (분) TFline - 수평 볼륨 생성 (타임프레임) BARSline - 수평 볼륨 생성 (바 수) TFtrend1 - 매일 채널 생성 (타임프레임) BARStrend1 - 매일 채널 생성 (바 수) TFtrend2 - 주간 채널 생성 (타임프레임
Silver Trade
Metin Erkamoglu
MATADOR SILVER – XAGUSD MT5 M5 Timeframe Scalp Signals MATADOR SILVER is a professional signal and decision-support indicator developed specifically for XAGUSD (Silver) scalping on the M5 timeframe , designed for real market conditions and disciplined execution. This indicator does NOT open, manage, or close trades automatically . It provides structured BUY & SELL signals , intelligent filtering, and alerts, allowing traders to execute trades using their own strategy and risk management rules .
LTL Long Trend Locator
Muhammad Usman Siddique
LTL 장기 추세 탐지기 v2.0 - 전문 추세 거래 지표 LTL 장기 추세 탐지기는 강력하고 지속적인 추세를 식별하여 트레이더가 시장에 진입하고 퇴출할 최적의 시점을 찾는 데 도움을 줍니다. 추세가 시작되고 끝나는 시점에 명확한 신호를 제공하여 올바른 방향으로 적시에 거래할 수 있도록 지원합니다. 강력한 시장 추세를 발견하고 명확한 진입점, 손절매 수준, 목표수익 수준을 통해 거래를 배치할 정확한 위치를 보여줍니다. 주요 기능: 명확한 매수/매도 신호: 시장이 상승 또는 하락할 준비가 되었을 때 화살표 표시 거래 라인 표시: 차트에 모든 수준이 명확히 표시된 완전한 거래 설정을 그립니다 추세 구역: 차트를 강세(녹색) 또는 약세(분홍색) 기간으로 색상 구분 통계 표시: 각 추세가 지속된 바 수와 포인트 수 표시 정보 패널: 현재 추세 상태 및 마지막 신호 시간 표시 알림 시스템: 새로운 신호 발생 시 팝업, 이메일 또는 소리 알림 수신 신호당 한 번만 알림(성가신 반복
Rtc ML Ai Predictor
Muhammad Faisal Sagala
Rtc ML Ai | Predictor CORE MACHINE LEARNING ENGINE Adaptive ML Market Predictor – Multi-Bar Trend & Candle Forecast What This Indicator Does This indicator is a  real-time market prediction engine  designed to analyze price behavior and estimate  future market tendencies . Unlike conventional indicators, this system  does not rely on static parameters or historical curve-fitting , but adapts its internal state dynamically during live market operation. Instead of using static rules, the indic
Hunter Spike
Jaime Humberto Gomez Arias
Hunter Spike This indicator consists of two regression channels calibrated with the current movement of the synthetic index algorithm, for any Deriv or Weltrade broker. Each channel has a signal, a target that alerts us when the price touches them, indicating buys on booms or gains and sells on crashes or pains. -configuration for booms or gains: Channel zone 1 (30) Channel zone 2 (0) -configuration for crashes or pains: Channel zone 1 (100) Channel zone 2 (70) Zones freely configurable by
무료 AUX 지표, EA 지원 및 전체 가이드를 얻으시려면 방문하세요 – https://www.mql5.com/en/blogs/post/763955 트렌드를 포착하세요. 패턴을 읽으세요. 진입 시점을 타이밍하세요. 30초 이내의 3단계! 분석 없이도 쉽게 거래하세요 — 당신의 스마트 어시스턴트가 워크플로우를 단순화해 드립니다. 더 이상 차트 과부하 없음. 스마트 바이어스 감지로 자신감 있게 거래하세요. 모든 통화, 암호화폐, 주식, 금속, 지수 및 모든 시간대와 호환됩니다. 그냥 클릭하고 실행하세요 — 정말 간단합니다. 속도와 명확성을 원하는 바쁜 트레이더에게 이상적입니다. TPTSyncX는 추세, 패턴, 그리고 캔들스틱 트리거 분석을 하나로 통합하여 깨끗하고 지능적인 시각 시스템으로 동기화하는 강력한 올인원 MetaTrader 5 인디케이터입니다. 명확성, 정밀성, 속도를 원하는 트레이더를 위해 설계되었으며, 가격 행동, 구조적 패턴 및 시장 타이밍 도구의 조합을 통해 높은 확
Recommended TimeFrame >= H1. 100% Non Repainted at any moment.  Use it carefully, only with Trend Direction. Trading Usage: 2 Variants: as Range System or as BreakOut System (Both Only With Trend Direction)::: (Always use StopLoss for minimise Risk); [1] as Range System: (Recommended) in UP TREND:  - BUY in Blue Line , then if price goes down by 50 points (on H1) open Second BUY.   Close in any Profit you wish: TrailingStop(45 points) or Close when Price touches upper Gold Line. in DOWN TREND
Kadenspikekiller
Netsai Mundawata
This is an advanced indicator used with success rate.Unlock the secrets of trading Boom and Crash spikes with our powerful MT5 indicator! This spike detection tool provides accurate buy and sell signals, trade alerts, and High success rate entries. Perfect for scalping, day trading, and swing trading. Get the best Boom and Crash strategy with our Deriv Boom and Crash spike indicator. Indicator does not redraw or repaint. Recommendation · Use a Virtual Private Server (VPS) for 24/7 alerts on mob
Max Ribbon Mt5
Stefano Frisetti
WARNING: This indicator is distributed EXCLUSIVELY on MQL5.com MT4 version:   https://www.mql5.com/it/market/product/160363 MT5 version:   https://www.mql5.com/it/market/product/160410 ============================================================================================= MAX RIBBON ver 1.00 The indicator that shows you the TREND clearly and unambiguously! ============================================================================================= DESCRIPTION MAX RIBBON is an advanced tre
Syntetic Mean Reversion
Danny Giovanni Romero Lozano
Synthetic Mean Reversion Synthetic Mean Reversion is a technical indicator designed to analyze price momentum and its distance from a dynamic equilibrium. It operates in a separate subwindow, providing a normalized view of market extensions and potential exhaustion zones based on price volatility. The indicator measures the gap between the current price and its mean, transforming market data into a visual scale from 0 to 100. This calculation helps identify periods where the price has moved sig
+++++++++++++++++++++++++++++++++++++++++++++++++++++++++++++++++++++++++++++++++++++++++++++++++ +++ Link to EURUSD Only Free Version -->  https://www.mql5.com/en/market/product/156904?source=Unknown +++++++++++++++++++++++++++++++++++++++++++++++++++++++++++++++++++++++++++++++++++++++++++++++++ Hallo Trader, This is a traditional GANN & FIBONACCI strategy based on detection of an impulsive move in the opposite direction. This is called a Breakout. At the moment of Breakout, the indicator draw
Historical Similarity Matcher Indicator (HI.SI.MA) Overview The Historical Similarity Matcher is a technical analysis indicator for MetaTrader 5. It scans historical price data to find segments that show statistical similarity to a user-selected reference period on the chart. When matches are found, the indicator displays the historical patterns and draws projections of pot
##   ONLY GOLD ##   Тiльки Золото ## **Mercaria Professional Trading Zones - Complete Guide** ## **Mercaria Professional Trading Zones - Повний посібник** ### **How Mercaria Zones Work / Як працюють зони Mercaria** **English:** Mercaria Zones is an advanced trading indicator that identifies high-probability support and resistance areas using ZigZag extremes combined with mathematical zone calculations. The indicator works on multiple timeframes simultaneously, providing a comprehensive view
Rabby
Jannie Barwise
RABBY: The "Momentum Dislocation" Indicator for Nasdaq M1  (Nas100, US100) Nasdaq M1 (Nas100, US100) Stop Getting Trapped by M1 Noise. The Ultimate Nasdaq Scalping Tool.  Start Trading the Dislocation. The first indicator that visualizes "Price Detachment" for high-precision entries. You don't need another arrow. You need to see the   Structure   of the move. If you trade Nasdaq on the 1-minute timeframe, you know the feeling: An indicator prints a "Buy" signal. You enter. Two minutes late
Meravith MT5
Ivan Stefanov
마켓 메이커를 위한 도구. Meravith는 다음과 같은 기능을 제공합니다: 모든 타임프레임을 분석하고 현재 유효한 추세를 표시합니다. 강세와 약세 거래량이 동일한 유동성 구간(거래량 균형 구간)을 강조 표시합니다. 서로 다른 타임프레임의 모든 유동성 레벨을 차트에 직접 표시합니다. 텍스트 기반 시장 분석을 생성하여 참고용으로 제공합니다. 현재 추세를 기반으로 목표가, 지지선 및 손절가를 계산합니다. 거래의 위험 대비 보상 비율(Risk/Reward)을 계산합니다. 계좌 잔고에 따라 포지션 크기를 산출하고 잠재 수익을 추정합니다. 시장에 중대한 변화가 발생할 경우 경고도 제공합니다. 지표의 주요 라인: 강세/약세 거래량 소진 라인 — 목표가로 사용됩니다. 시장 추세를 나타내는 라인. 시장이 강세인지 약세인지에 따라 색상이 변경되며 추세 지지선 역할을 합니다. 색상은 주로 시장 심리를 보여줍니다. 거래량 균형선(Eq). Eq(Volume Equilibrium) 라인은 시스템의 핵심입니
필터:
리뷰 없음
리뷰 답변