NAS100 Compression Cross
- Experts
- 버전: 1.0
- 활성화: 5

A systematic trend-following Expert Advisor for NAS100 and US_TECH100 CFD. Entries are triggered by MACD histogram zero-line crossovers on the H1 timeframe. Three structural filters determine whether each signal is taken.
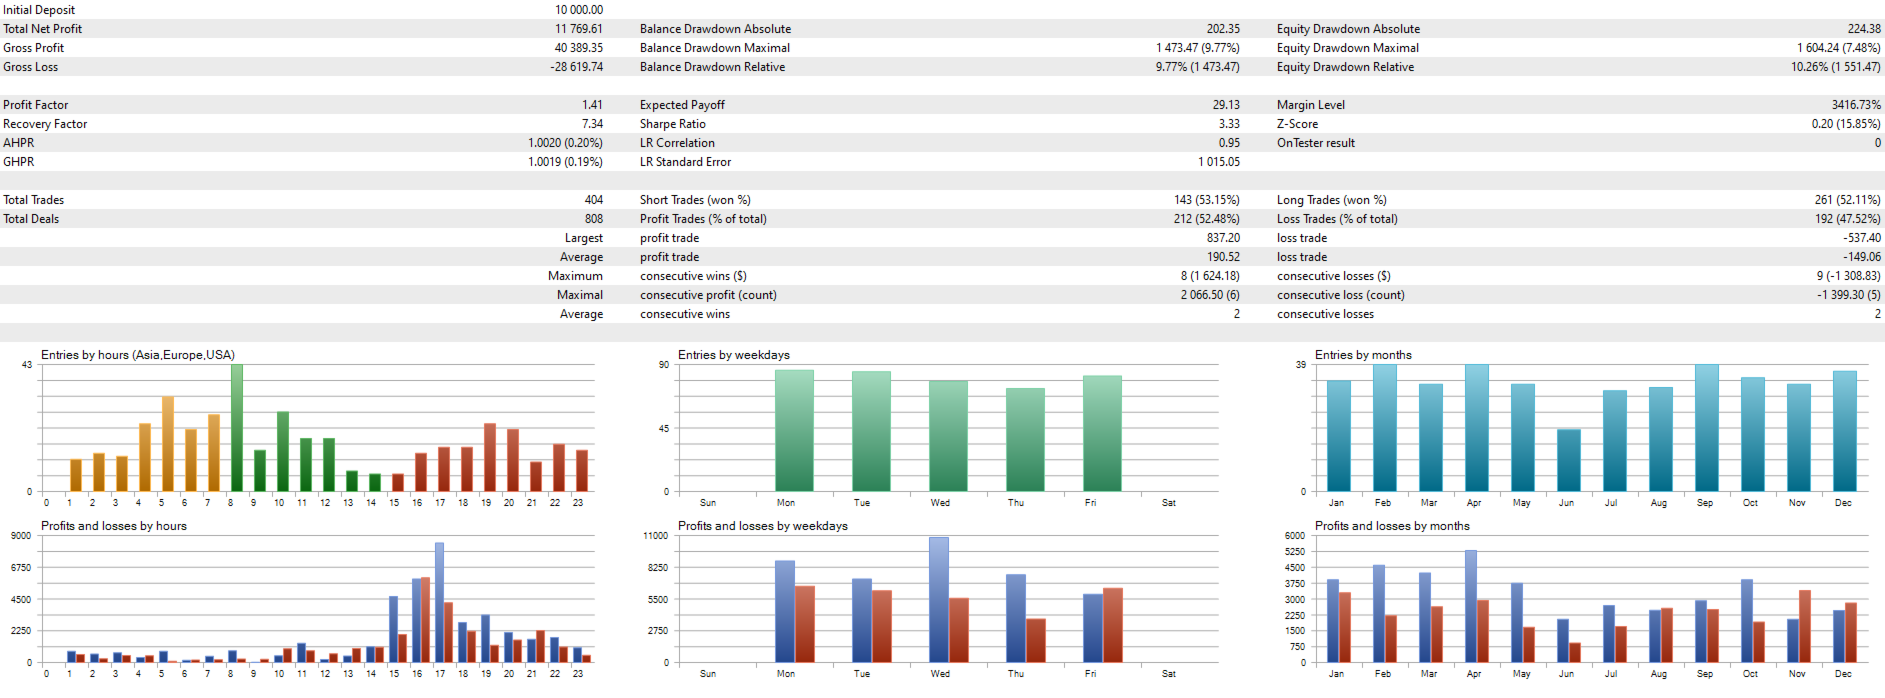
All results presented in this listing are simulated. Past performance is not indicative of future results. Figures represent walk-forward optimisation out-of-sample periods on historical data, not real money trading.
How It Works
The MACD crossover is the signal. The three filters decide whether it is worth taking.
Regime Filter blocks trades when ADX and ATR classify the market as range-bound. Range is the only regime where MACD crossovers carry negative expectancy on NAS100 H1. Trend, normal and volatile conditions all pass. This finding is documented in the companion article listed below.
Volatility Compression Filter (long entries). Requires Bollinger Band contraction across two independent lookback periods before a long is taken. Identifies price entering compression after expansion, the condition where breakout entries tend to perform.
Momentum Confirmation Filter (short entries). Requires ATR to have peaked and turned lower, confirming that volatility expansion is fading before a short is taken.
Long and short entries use different filters because they behave differently on NAS100. Both sides are independently profitable in the validated results.
Validation
All figures below are out-of-sample from Walk-Forward Optimisation. No in-sample performance is reported. All results are simulated on historical data.
| Data | NAS100 H1, 2020 to 2026 |
| Out-of-Sample Windows | 60 independent periods |
| In-Sample / Out-of-Sample Split | 307 days / 62 days |
| Total Out-of-Sample Trades | 422 |
| Profit Factor | 1.51 |
| Sharpe Ratio | 1.45 |
| Return to Drawdown Ratio | 12.01 |
| Maximum Drawdown | 7.71% |
| Win Rate | 54.5% |
| Average Trade | $33.94 |
| Maximum Stagnation | 212 days |
Simulated out-of-sample results by calendar year:
| Year | Out-of-Sample Simulated Profit |
|---|---|
| 2020 | $673 |
| 2021 | $1,734 |
| 2022 | $2,052 |
| 2023 | $2,725 |
| 2024 | $693 |
| 2025 | $5,223 |
| 2026 | $1,224 (January to May, including a period of significant macroeconomic volatility in April) |
Cross-validation passed on the S&P 500 equivalent instrument. Parameter stability confirmed via Sequential Optimisation with a stable plateau found for all three external parameters.
What It Does Not Do
No martingale. No grid. No averaging. No news filter. No session restriction. The strategy runs 24 hours and is accessible to traders in all time zones. Every trade is protected by a stop loss and a take profit level.
Recommended Setup
| Instrument | NAS100 or US_TECH100 CFD |
| Timeframe | H1 |
| Minimum deposit | $1,000 at 0.01 lot |
| Broker | Low-spread broker with direct market access |
| Virtual Private Server | Recommended for 24-hour operation |
Parameters
Identification
| Parameter | Default | Description |
|---|---|---|
| CustomComment | N100CC | Comment attached to every order. Change this if running alongside other Expert Advisors to distinguish trades in the account history. |
| MagicNumber | 654321 | Unique identifier for this Expert Advisor's orders. Change this if running multiple Expert Advisors on the same account. |
Volatility Filter (long entries)
| Parameter | Default | Range | Description |
|---|---|---|---|
| BB_Compression_Period | 50 | 20 to 60 | Primary Bollinger Band lookback for compression detection. Longer values detect slower compression cycles. Validated via Sequential Optimisation with a stable plateau confirmed across the full range. |
| BB_Confirmation_Period | 5 | 3 to 10 | Secondary Bollinger Band lookback for compression confirmation. This value must be shorter than BB_Compression_Period. |
Momentum Filter (short entries)
| Parameter | Default | Range | Description |
|---|---|---|---|
| ATR_Momentum_Period | 20 | 20 to 50 | ATR lookback for momentum direction on short entries. Confirmed via Sequential Optimisation with a stable plateau across the full tested range. |
Money Management — ATR Risk-Based Sizing
| Parameter | Default | Description |
|---|---|---|
| UseMoneyManagement | false | Enable dynamic position sizing based on account equity and ATR stop distance. Set to true for percentage-based risk sizing. When enabled, lot size is calculated so that the ATR-based stop distance risks exactly mmRiskPercent of account equity per trade. |
| mmRiskPercent | 0.25 | Percentage of account equity risked per trade when money management is enabled. At 1.0 on a $10,000 account the Expert Advisor risks $100 per trade. |
| mmATRPeriod | 14 | ATR period used to calculate the stop distance for position sizing. Used only for lot calculation, not for the strategy stop loss itself. |
| mmATRMultiplier | 2.5 | ATR multiplier applied to calculate the sizing stop distance. Separate from the strategy stop loss. Used only for lot calculation. |
| mmDecimals | 2 | Lot size decimal places. Set to 1 for brokers with a minimum 0.1 lot step. |
| mmLotsIfNoMM | 1.0 | Fixed lot size when UseMoneyManagement is false. Reduce to 0.01 on small accounts or during initial live testing. |
| mmMaxLots | 5.0 | Maximum lot size regardless of money management calculation. The Expert Advisor will never open a position larger than this value. |
Exit Options
| Parameter | Default | Description |
|---|---|---|
| ExitAtEndOfDay | false | Force-close all positions at the time set in EODExitTime. Not recommended. The strategy is designed to hold trades to stop loss, take profit or timeout. Enabling this setting will change the validated performance profile. |
| EODExitTime | 23:55 | Time to close positions if ExitAtEndOfDay is enabled. |
| ExitOnFriday | false | Force-close all positions at the time set in FridayExitTime. The strategy holds positions over the weekend by design and was validated on that basis. |
| FridayExitTime | 21:00 | Time to close positions on Friday if ExitOnFriday is enabled. |
Time Range
| Parameter | Default | Description |
|---|---|---|
| LimitTimeRange | false | Restrict signal generation to a defined time window. The strategy is designed and validated to run 24 hours. Enabling this setting will reduce trade count and deviate from the validated configuration. |
| SignalTimeRangeFrom | 14:00 | Start of signal window if LimitTimeRange is enabled. |
| SignalTimeRangeTo | 20:00 | End of signal window if LimitTimeRange is enabled. |
| ExitAtEndOfRange | false | Close all positions when the signal window ends if LimitTimeRange is enabled. |
Display
| Parameter | Default | Description |
|---|---|---|
| InpsqDisplayInfoPanel | true | Show the on-chart information panel displaying open profit and loss, account balance and trade statistics. Set to false when running on a server without a chart display. |
Fixed Parameters
MACD settings (Fast 12, Slow 26, Signal 9), regime detection thresholds and stop loss and take profit coefficients are all fixed at validated values. These are not exposed in the parameter panel. They were established through empirical research and Walk-Forward Optimisation. Adjusting them is not possible and is not recommended.
Research Foundation
This Expert Advisor builds on a published MQL5 community article: Three MACD Filters on US_TECH100, Five Years of Broker Data. The article identified session-time filtering as the dominant performance driver on raw MACD crossovers on NAS100 H1. This Expert Advisor advances that finding by replacing the session constraint with structural regime and volatility filters, achieving comparable robustness without clock dependency and making the strategy available to traders in all time zones.
Before You Buy
Please read this description and examine the screenshots before purchasing. Contact me before buying if you have questions about compatibility with your broker or account type. If you find live results materially different from the validated historical figures, please contact me before leaving a review.