Adx Pulse

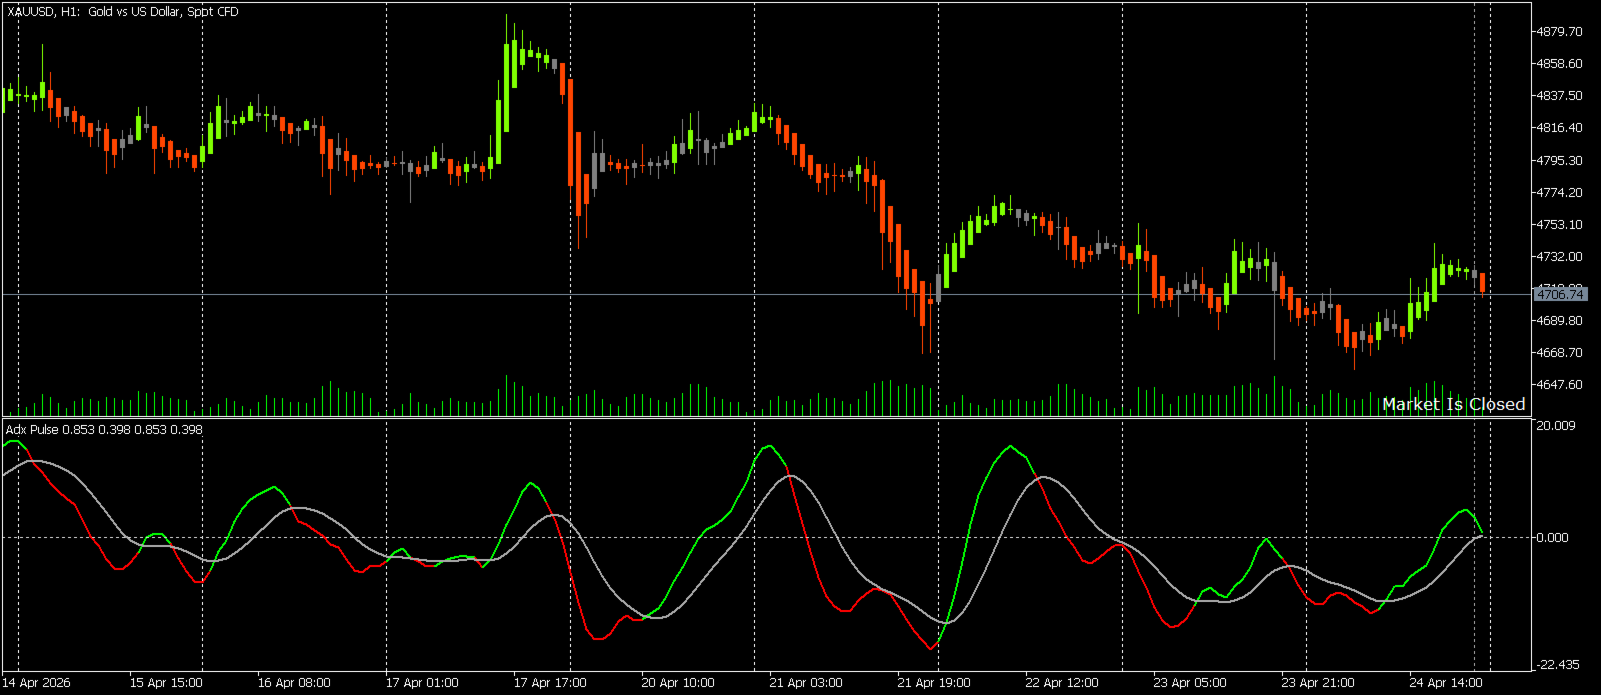
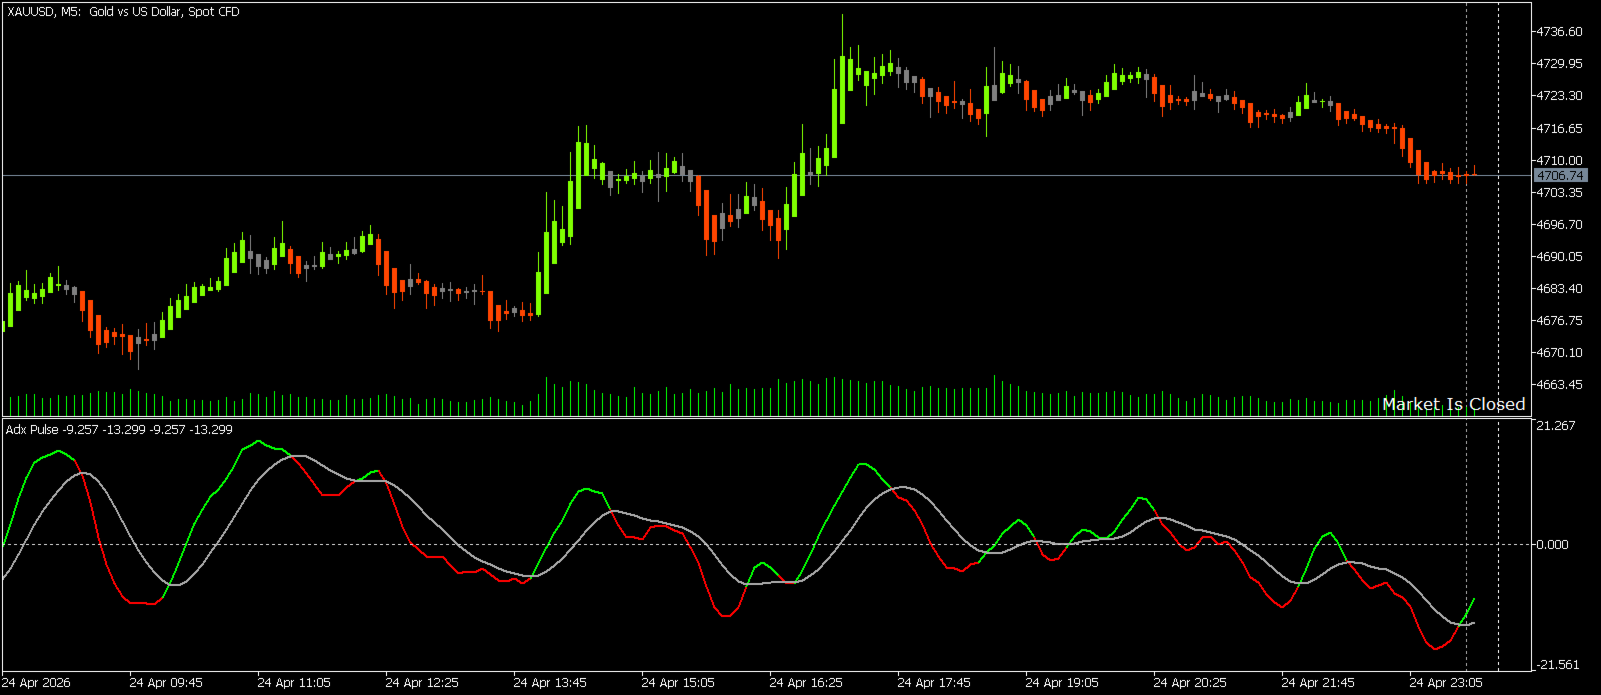
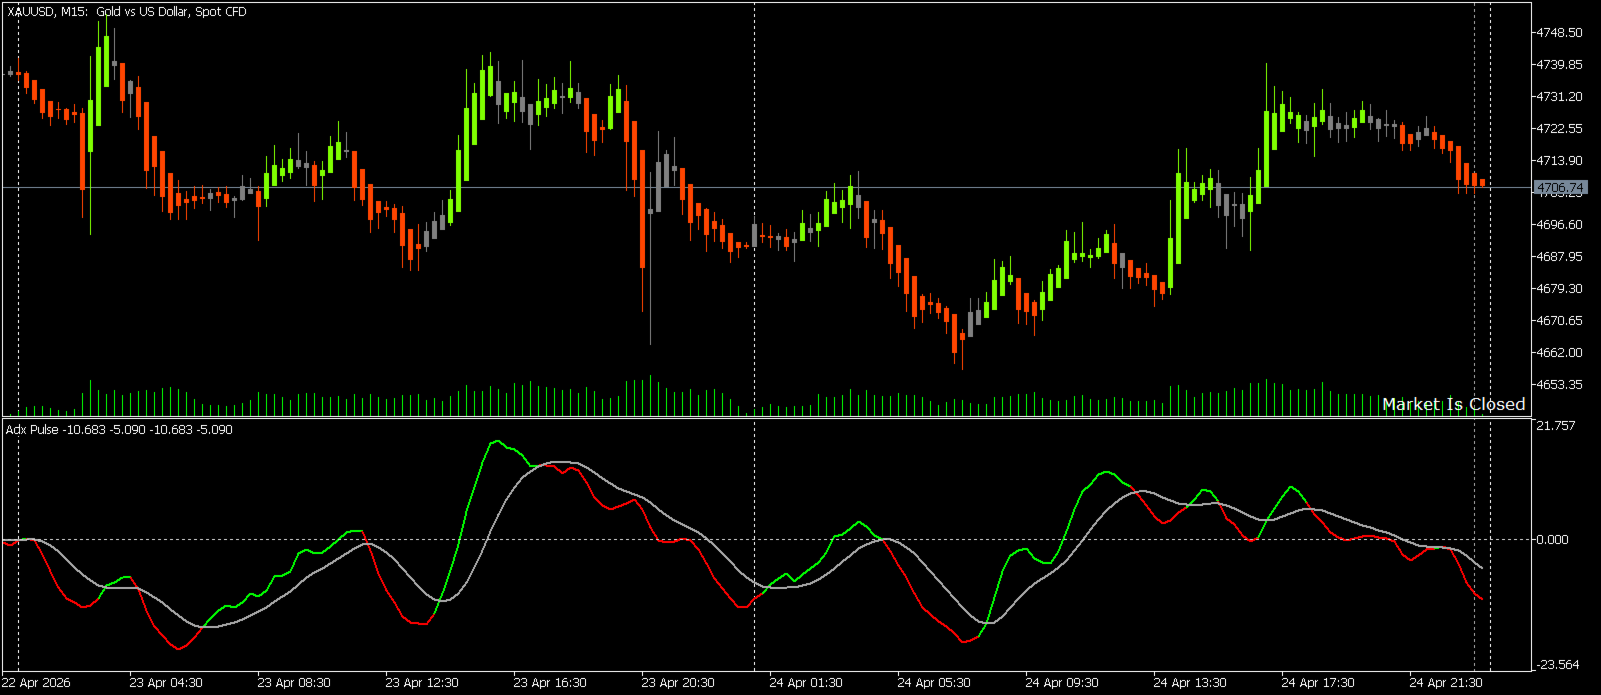
Adx Pulse is a momentum and trend-strength indicator built on the core logic of the ADX, but enhanced to give clearer, faster signals. Instead of displaying standard ADX values, it measures the difference between +DI and -DI, then smooths it to create a responsive “pulse” line (Main). A secondary Signal line (LWMA-based) is added to confirm momentum shifts. The indicator also uses color changes to highlight bullish (green) and bearish (red) conditions, making trend direction easy to read at a glance. It works well across timeframes and can be applied to any instrument, with optional multi-timeframe analysis for broader context.

How to use:
Look for crossovers between the Main and Signal lines. When the Main crosses above the Signal, it indicates growing bullish momentum (buy bias). When it crosses below, it signals bearish momentum (sell bias). The zero level acts as a trend filter—values above zero favor buys, below zero favor sells. Strong trends occur when both lines move away from zero with clear separation. Avoid trading during flat, overlapping lines, as this signals low momentum. Combine with structure, support/resistance, or higher timeframe bias for best results.


추천 제품
RED ZONE Monitor Loss-Cut & Break-Even Risk Monitor for Averaging Traders (MT5) RED ZONE Monitor is a risk management indicator for traders who use averaging, scaling-in, or multiple open positions . It visually displays: The loss-cut (liquidation) risk zone The break-even price Based on current open positions, lots, and margin conditions This indicator does not provide entry signals. It does not promise profits. It shows where your account actually fails if price moves against you. What RED ZO
개요 Candle Timer Countdown Pro는 현재 캔들의 마감까지 남은 시간을 부드럽고 정확하게 카운트다운으로 표시하며, 원형 진행 아크를 통해 남은 시간을 직관적으로 보여줍니다. 서버 시간 보간(Server Time Interpolation) 기술을 사용하여 틱이 없는 구간에서도 멈춤 없이 부드럽게 작동합니다. M1부터 MN까지 모든 타임프레임을 지원합니다. 스캘핑(1분 차트)부터 스윙 트레이딩(H4 이상)까지, 캔들 마감 시간을 정확히 파악하면 진입 타이밍을 개선하고 성급한 결정을 방지할 수 있습니다. 주요 특징 틱 간 멈춤 없는 정확한 카운트다운 원형 진행 표시 (Ring 또는 Filled Pie) 6가지 표시 위치 선택 가능 3가지 색상 모드 (Manual / Candle Outline / Candle Body) 마감 직전 하이라이트 기능 연결 상태 감지 (Active / Inactive / Disconnected) 새 캔들 알림 (팝업, 이메일, 푸시) 모든 타임
Smart Fair Value Gap Pro
Joao Luiz Savioli Filho
Unlock the power of Smart Money Concepts (SMC) with the cleanest FVG indicator on the market. Smart FVG Pro is not just another gap detector. It is designed for professional traders who need to filter out noise and focus on high-probability reversal zones. Unlike standard indicators that clutter your chart with every minor gap, Smart FVG Pro uses advanced filtering logic (Trend + Volatility) and a unique "Smart Mitigation" system to automatically remove invalidated zones, keeping your chart clea
Pixel Minimalist Screener – 더 스마트하게 트레이딩하세요 명확함은 곧 힘입니다. 빠르게 움직이는 시장 속에서 깔끔하고 집중된 작업 환경은 승부를 가를 수 있습니다. Pixel Minimalist Screener 는 정확성, 단순함, 그리고 실질적인 정보를 한눈에 제공하는 트레이더를 위한 도구입니다. 핵심 기능 멀티 타임프레임 지원 최대 3개의 맞춤 타임프레임 을 한 화면에서 모니터링하세요. 스캘핑부터 스윙, 장기 트레이딩까지 — 시장의 전반적인 흐름을 빠르게 파악할 수 있습니다. 7가지 핵심 기술 지표 포함 불필요한 시각적 요소 없이도 충분한 정보 제공: RSI (상대 강도 지수) MACD ADX 스토캐스틱 오실레이터 패러볼릭 SAR 이동 평균선 모멘텀 모든 지표는 깔끔하게 시각화되어 빠른 판단을 도와줍니다. 실시간 대시보드 선택한 타임프레임에서 지표 상태를 실시간으로 확인할 수 있습니다. 상승(Bullish), 하락(Bearish), 중립(
RSI Currency Strength Meter is a powerful and elegant multi-currency indicator that measures the real-time relative strength of the 8 major currencies using RSI logic. By calculating the smoothed performance of each currency across its major pairs and applying the RSI formula, it delivers clean and responsive strength lines that make it easy to spot which currencies are truly strong or weak at any moment. This indicator is particularly useful for visualizing currency correlations and divergence
Price Magnet — Price Density and Attraction Levels Indicator Price Magnet is a professional analytical tool designed to identify key support and resistance levels based on statistical Price Density. The indicator analyzes a specified historical period and detects price levels where the market spent the most time. These zones act as “magnets,” attracting price action or forming a structural base for potential reversals. Unlike traditional Volume Profile tools, Price Magnet focuses on price-time d
Adaptive Momentum Oscillator (AMO) – Next-Gen Momentum Indicator Overview The Adaptive Momentum Oscillator (AMO) is a powerful technical analysis tool that dynamically adjusts its sensitivity to market conditions by incorporating adaptive lookback periods, noise filtering, and normalization techniques . Traditional momentum indicators use fixed lookback periods, which can lead to inefficiencies in trending and ranging markets. The AMO overcomes this limitation by adapting its calculation based o
FREE
Moving Average Dashboard
Mike Pascal Plavonil
The Moving Average Dashboard indicator allows you to see the relationship between a fast and a slow moving average. This indicator is working on multiple symbols and up to 21 timeframes. It's allows you to configure the fast and slow moving averages to whatever period, method or price is appropriate The Moving Average Dashboard saves you time as you can use the indicator to scan multiple currency pairs or other symbols in just one window. Installation Download the Indicator in your MT5 termi
Basic information. To perform its work, the indicator takes data on volumes from a lower timeframe, builds Market Profiles for a higher timeframe and a histogram for the current timeframe. The indicator starts in several stages. In this case, messages like: "Build Source & Target TF. Step: …" are output to the log. The process can be accelerated by changing the input parameter Milliseconds between steps - the initialization speed. The final value of this parameter is always individual and is set
Trend Follower LukaHo
Lukasz Mariusz Holla
TrendFollower (The Swiss Army Knife for Trends) Forget standard indicators. Discover TrendFollower – 5 strategies in one! Tired of indicators that show a buy signal when the market is long past its peak? Your moving averages are so laggy that they show last Tuesday's trend? Let's get this straightened out. I present to you TrendFollower – a powerful, modular framework (Institution-Grade) that analyzes market structure from five different perspectives. Whether you're a patient sw
표시기는 현재 시세를 작성하여 과거 시세와 비교할 수 있으며 이를 바탕으로 가격 변동을 예측합니다. 표시기에는 원하는 날짜로 빠르게 이동할 수 있는 텍스트 필드가 있습니다. 옵션: 기호 - 표시기가 표시할 기호 선택. SymbolPeriod - 지표가 데이터를 가져올 기간 선택. IndicatorColor - 표시기 색상. HorisontalShift - 지시자가 그린 따옴표를 지정된 막대 수만큼 이동합니다. Inverse - true는 인용 부호를 반대로, false - 원래 보기를 반전합니다. ChartVerticalShiftStep - 차트를 수직으로 이동합니다(키보드의 위/아래 화살표). 다음은 날짜를 입력할 수 있는 텍스트 필드의 설정으로, '엔터'를 누르면 즉시 이동할 수 있습니다.
Ichimoku Kinko Hyo is a purpose-built trend trading charting system that has been successfully used in nearly every tradable market. It is unique in many ways, but its primary strength is its use of multiple data points to give the trader a deeper, more comprehensive view into price action. This deeper view, and the fact that Ichimoku is a very visual system, enables the trader to quickly discern and filter "at a glance" the low-probability trading setups from those of higher probability. This i
Prime Flow
Simon Draxler
DRX PRIME FLOW 는 시장 구조와 변동성 변화를 차트에서 직접 시각화하도록 설계된 자동 적응형 시장 분석 시스템입니다. 가이드 및 매뉴얼: 여기를 클릭하세요 수동 보정 대신, 이 시스템은 백그라운드에서 현재 자산의 변동성에 적응하는 동적 알고리즘을 사용합니다. 골드, 암호화폐, 통화 및 지수에서 파라미터 튜닝 없이 원활하게 작동합니다. 핵심 기능 자동 적응형 존(Zones): 지표는 시장 변동성에 따라 확장 및 수축하는 동적 밴드를 표시합니다. 내부 존: 시장이 균형 상태입니다. 외부 존: 시장이 과매수/과매도 상태 – 반전 또는 풀백(Pullback) 가능성. 스마트 배경 시각화: 차트 배경색을 사용하여 시장 단계를 알립니다. 색상 A (예: 녹색): 가격이 하단 극단에 도달 (잠재적 매수 구간). 색상 B (예: 적색): 가격이 상단 극단에 도달 (잠재적 매도 구간). 중립: 가격이 정상 범위 내에 있습니다. 대시보드 패널: 중앙 HUD 패널이 현재 추세 방향과 흐름 상
MT5 Drawdown Tracker – Track Your EA’s Performance with Precision! Take your trading analysis to the next level with our MT5 indicator designed to monitor, record, and report the drawdown of any Expert Advisor. Whether you’re fine-tuning your strategies or optimizing risk management, this tool gives you the insights you need. Key Features: Effortless Tracking: Automatically monitors the drawdown levels of your EAs with precision. Comprehensive Data Storage: Accurately logs each drawdown event,
Lunar Phase Suite
Antonello Belgrano
Lunar Phase Suite – Moon Cycles & Moon Phases for MetaTrader 5 Lunar Phase Suite brings astronomy and astrology into MetaTrader 5 through a detailed visual panel and a dedicated sub-window. The current moon phase, illumination percentage and moon cycle age are updated every minute. All 8 moon phases are displayed with individual mini-moons, with the active phase highlighted automatically. ILLUM — Illumination curve with New Moon, Full Moon and Quarter markers plotted on the sub-window. DECL — No
Side Zone
Dayanand Pandey
SideZone: Trend Intensity Oscillator – Filter the Noise, Ride the Trend Overview SideZone is a specialized oscillator engineered to solve a common trader's dilemma: distinguishing between a true trend and a ranging market. By clearly visualizing trend direction and sideways consolidation, SideZone helps you stay on the right side of the move while avoiding the whipsaw of low-volatility environments. Its core function is to provide a clear, color-coded visual representation of market sentiment
Gecko EA MT5
Profalgo Limited
5 (1)
NEW PROMO: Only a few copies copies available at 349$ Next price: 449$ Make sure to check out our " Ultimate EA combo package " in our   promo blog ! Gecko runs a simple, yet very effective, proven strategy.  It looks for important recent support and resistance levels and will trade the breakouts.  This is a "real" trading system, which means it will use a SL to protect the account.  It also means it will not use any dangerous techniques like martingale, grid or averaging down. The EA shows its
Gold Venamax MT5
Sergei Linskii
3.5 (2)
Gold Venamax - 이것은 최고의 주식 기술 지표입니다. 지표 알고리즘은 자산의 가격 변동을 분석하고 변동성과 잠재적 진입 영역을 반영합니다. 표시기 기능: 이것은 편안하고 수익성 있는 거래를 위한 매직과 두 개의 추세 화살표 블록을 갖춘 슈퍼 지표입니다. 블록 전환을 위한 빨간색 버튼이 차트에 표시됩니다. 매직은 표시기 설정에서 설정되므로 서로 다른 블록을 표시하는 두 개의 차트에 표시기를 설치할 수 있습니다. Gold Venamax는 서로 다른 화살표 버퍼(GV 및 SD)를 사용하여 두 개의 차트에 배치할 수 있습니다. 이렇게 하려면 설정에서 다른 Magic을 선택해야 합니다. 예를 들어 하나는 Magic = 999이고 다른 하나는 Magic = 666입니다. 다음으로 차트의 빨간색 버튼으로 화살표 버퍼를 선택할 수 있습니다. 지표 설정의 각 화살표 버퍼(GV 및 SD)에는 편안하고 수익성 있는 거래를 위한 별도의 화살표 필터가 있습니다(UseFiltrGV = true;
Plucking Machine Plucking Machine   is a trend indicator designed specifically for gold and can also be used on any financial instrument. The indicator does not redraw and does not lag. Recommended time frame H1. The current setting is applicable for all time periods. It shows the current direction of the market based on price movements. Corresponding products of indicators: https://www.mql5.com/zh/market/product/61388?source=Site+Market+Product+Page#description The brother Indicator :  http
Antabod Multiplier
Rev Anthony Olusegun Aboderin
Antabod Multiplier , the ultimate trading indicator designed to simplify your decision-making process and maximize your trading potential. Built with a robust combination of moving averages and stochastic oscillators, this tool provides clear, actionable signals for both buy and sell opportunities. The Antabod Multiplier stands out with its dynamic trend detection and precision filtering, giving you real-time visual signals to catch trend reversals and optimal entry/exit points with ease. Whethe
Every indicator has its advantages and disadvantages. Trending ones show good signals during a trend, but lag during a flat. Flat ones thrive in the flat, but die off as soon as a trend comes. All this would not be a problem, if it was easy to predict when a flat changes to a trend and when a trend changes to a flat, but in practice it is an extremely serious task. What if you develop such an algorithm, which could eliminate an indicator's flaws and enhance its strengths? What if such an algorit
VSA target
Evgenii Bazhenov
VSA 목표 지표를 식별한 전문적인 구매자 또는 전문 판매자에 차트를 사용하 VSA(볼륨 확산 분석)시스템을 구축 트렌드 지원 영역에 상대적인 이러한 막대기(촛대),뿐만 아니라 대상으로 수준입니다.  특징: 1. 에서 이 표시기는,당신이 선택할 수 있습니다 이 모드에서는 전문 구매자 또는 전문 판매자 결정될 것이고,모두 전문적인 참여자에 결정됩니다. 2. 기호에 임의의 시간대를 설정하여 지원 영역과 목표 수준을 결정할 수 있습니다. 거래할 때,큰 기간은 설정을 결정하는 지역 및 목표 수준이고,자체 트랜잭션 수행할 수 있습에 작은 기간에 대한 더 정확한 항목으로 트랜잭션이 있습니다.  3. 에 표시 설정을 선택할 수 있습니다 틱는 경우 볼륨 틱 볼륨을 사용하고,실제 볼륨을 경우 실제 볼륨을 사용합니다. 4. 대형 판매자 또는 구매자를 결정할 때 볼륨 크기와이 볼륨의 검색 기간을 수동으로 선택할 수 있습니다. 5. 전문가를 만드는 데 사용될 수있다. 설명: 녹색 점선은 구매자의 지원
Visual Dolphin Indicator
AL MOOSAWI ABDULLAH JAFFER BAQER
Visual Dolphin Indicator Unlock the rhythm of the market with the Visual Dolphin Indicator, your ultimate tool for identifying and capitalizing on market trends with clarity and confidence. Designed for both novice and experienced traders, this indicator eliminates the noise and guesswork, providing crystal-clear buy and sell signals directly on your chart. The Logic Behind the Waves The core of the Visual Dolphin Indicator is a sophisticated yet intuitive dual-wave system based on moving avera
MultiSession Volume Profile is a professional volume profile indicator for MetaTrader 5 that builds separate POC, VAH, VAL and volume histograms for multiple custom trading sessions on the same chart. It helps you see where volume truly concentrated in each part of the day (RTH, Globex, Asia, London, etc.), so you can identify key intraday levels, ranges, and magnets that many standard tools miss. ​ Main advantages Multi-session profiles Build up to 5 fully independent sessions with custom times
개요 멀티 레벨 ATR 및 이동 평균 밴드 지표는 거래자들이 시장 트렌드, 지지 및 저항 수준, 변동성을 명확히 식별할 수 있도록 도와주는 강력한 도구입니다. 이 지표는 여러 이동 평균을 ATR(평균 진폭 범위) 배수와 결합하여 가격 움직임 주위에 시각적으로 구별되는 밴드를 생성합니다. 이를 통해 거래자는 잠재적인 반전 지점, 트렌드 상태 및 시장 통합 영역을 식별할 수 있습니다. 기능 다중 밴드 표시: 가격의 최고, 중간, 최저 이동 평균 및 ATR 계산에서 파생된 6개의 동적 밴드를 색상으로 구분하여 트렌드를 쉽게 식별할 수 있도록 합니다 (빨간색, 주황색, 노란색, 녹색, 파란색, 보라색). ATR 변동성 밴드: ATR 배수를 사용하여 변동성에 따라 밴드를 조정하고, 잠재적인 가격 반전 또는 지속을 명확히 시각화합니다. 조정 가능한 매개변수: 다양한 시장 조건 및 거래 전략에 맞게 ATR 배수와 이동 평균 기간을 완전히 조정할 수 있습니다. 트렌드 식별의 명확성: 밴드는 변동성
FREE
CosmiCLab FIBO
Kirils Subins
CosmiCLab SMC FIBO CosmiCLab SMC FIBO is a professional trading indicator designed for traders who use Smart Money Concepts (SMC), market structure analysis and Fibonacci retracement levels. The indicator automatically detects market swings and builds Fibonacci levels based on the latest impulse movement. It also identifies market structure changes such as BOS (Break of Structure) and CHOCH (Change of Character), helping traders understand the current market direction. CosmiCLab SMC FIBO also pr
Trade Helper
Pavel Gotkevitch
The Trade Helper indicator is a modification of the Trade Assistant indicator (by Andriy Moraru). The Trade Helper multitimeframe indicator is a good assistant for traders, useful as a filter in most trading strategies. This indicator combines the tactics of Elder's Triple Screen in a single chart, which lies in entering a trade when the same trend is present on three adjacent timeframes. The indicator operation is based on the principle of determining the trend on the three selected timeframes
Buyer Seller Balance Analyzer 는 여러 타임프레임에서 매수자와 매도자의 힘을 종합적으로 보여줍니다. 주요 구성 요소: Buyer/Seller Balance 표 매수자와 매도자의 비율 표시 M1부터 MN1까지 모든 타임프레임 포함 색상 구분 (녹색 = 매수자, 빨강 = 매도자) 핵심 지표: Buyers (%) – 매수자 비율 Sellers (%) – 매도자 비율 ️ Balance – 매수자와 매도자의 차이 Strength – 추세 강도 (STRONG/MEDIUM/WEAK) Volume – 거래량 표시 (HIGH/normal) 추가 기능: 이동평균선 (8, 21, 50, 100, 200) 현재 가격을 표시하는 수평선 높은 거래량 강조 표시 신호 해석: 강한 추세: Balance 가 크게 양수 (진한 녹색) → 강한 상승 추세 Balance 가 크게 음수 (진한 빨강) →
Bober Real MT5
Arnold Bobrinskii
4.76 (17)
Bober Real MT5 is a fully automatic Forex trading Expert Advisor. This robot was made in 2014 year and did a lot of profitbale trades during this period. So far over 7000% growth on my personal account. There was many updates but 2019 update is the best one. The robot can run on any instrument, but the results are better with EURGBP, GBPUSD, on the M5 timeframe. Robot doesn't show good results in tester or live account if you run incorrect sets. Set files for Live accounts availible only for cu
Premium level Pro
Dmitriy Kashevich
Premium level is a unique indicator with more than 80% accuracy of correct predictions! This indicator has been tested for more than two months by the best Trading Specialists! The author's indicator you will not find anywhere else! From the screenshots you can see for yourself the accuracy of this tool! 1 is great for trading binary options with an expiration time of 1 candle. 2 works on all currency pairs, stocks, commodities, cryptocurrencies Instructions: As soon as the red arrow app
이 제품의 구매자들이 또한 구매함
SuperScalp Pro
Van Minh Nguyen
4.59 (22)
SuperScalp Pro – 고급 멀티 필터 스캘핑 지표 시스템 SuperScalp Pro는 클래식 Supertrend와 여러 지능형 확인 필터를 결합한 고급 스캘핑 지표로, 거래 기회를 식별하는 데 도움을 줍니다. M1부터 H4까지 다양한 시간대에서 효율적으로 작동하며, XAUUSD, BTCUSD 및 주요 Forex 통화쌍에 최적화되어 있습니다. 이 지표는 명확한 매수 및 매도 신호를 제공하며, ATR 기반으로 진입가, 손절가, 익절가를 자동 계산하여 보다 효과적인 리스크 관리를 지원합니다. Fibonacci Take Profit 기능은 중요한 가격 구간에서 더 빠르게 포지션을 청산할 수 있도록 하며, 해당 수준 도달 시 알림을 전송합니다. 기본 설정은 Fibonacci Take Profit이 활성화된 상태로 최적화되어 있으며, 보다 안정적이고 일관된 거래 경험에 중점을 둡니다. 차트에 적용하는 것만으로 즉시 사용할 수 있습니다. 고급 사용자를 위해 모든 파라미터는 자유롭게 사용
Entry In The Zone and SMC Multi Timeframe is a real-time 2-in-1 market analysis tool that combines market structure analysis and a No Repaint BUY / SELL signal system into a single indicator, built on Smart Money Concepts (SMC) — a widely adopted framework used by professional traders to understand market structure. This indicator helps you see the market more clearly, make decisions based on structure rather than guesswork, and focus on high-probability zones where price is more likely to react
Divergence Bomber
Ihor Otkydach
4.9 (87)
이 지표를 구매하신 분께는 다음과 같은 혜택이 무료로 제공됩니다: 각 거래를 자동으로 관리하고, 손절/익절 수준을 설정하며, 전략 규칙에 따라 거래를 종료하는 전용 도우미 툴 "Bomber Utility" 다양한 자산에 맞게 지표를 설정할 수 있는 셋업 파일(Set Files) "최소 위험", "균형 잡힌 위험", "관망 전략" 모드로 설정 가능한 Bomber Utility의 셋업 파일 이 전략을 빠르게 설치, 설정, 시작할 수 있도록 돕는 단계별 영상 매뉴얼 주의: 위의 모든 보너스를 받기 위해서는 MQL5 개인 메시지 시스템을 통해 판매자에게 연락해 주세요. 독창적인 커스텀 지표인 “Divergence Bomber(다이버전스 봄버)”를 소개합니다. 이 지표는 MACD 다이버전스(괴리) 전략을 기반으로 한 올인원(All-in-One) 거래 시스템입니다. 이 기술 지표의 주요 목적은 가격과 MACD 지표 간의 다이버전스를 감지하고, **향후 가격이 어느 방향으로 움직일지를 알려주는
Power Candles MT5
Daniel Stein
5 (8)
Power Candles V3 - 자체 최적화 강도 지표 파워 캔들 V3는 적용된 모든 차트에서 통화 및 상품의 강세를 실행 가능한 거래 계획으로 전환합니다. 단순히 캔들에 색상을 입히는 대신, 백그라운드에서 실시간 자동 최적화를 수행하여 현재 보고 있는 종목에 대한 최적의 손절매, 익절 및 신호 임계값을 제공합니다. 한 번의 클릭으로 실시간 거래에 적용할 수 있으며, 진입점, 손절매 및 익절 선이 정확한 가격에 맞춰 차트에 표시되고, 방향과 함께 알림이 발령됩니다. 이 도구는 Stein Investments 에코시스템의 일부입니다. 18개 이상의 도구와 함께 당신의 1대1 AI 트레이딩 멘토 Max.  항상 대기 중, 모든 인디케이터를 깊이 있게 이해, 무언가를 차근차근 생각해보고 싶은 순간에 도움을 줍니다.  https://stein.investments 에서 만나보세요 매 종가 바마다 3,000회 이상의 트레이딩 시뮬레이션. 9가지 강도 상태. 2가지 전략을 병렬로 테스트.
SignalTech MT5
Yue Wang
5 (11)
SignalTech MT5 is a trading system for EURUSD, USDCHF, USDJPY, AUDUSD, NZDUSD, EURJPY, AUDJPY, NZDJPY, CADJPY H2 and H3 Timeframe.  It can generate signals with Buy/Sell Arrows and Pop-Up/Sound Alerts. Each signal has clear Entry and Stop Loss levels, which should be automatically flagged on the chart, as well as potential Targets 1, 2, and 3. The Entry and TP levels are fixed after the trade is taken. The exit level is dynamic. If there are signs of a potential short-term trend reversal, the
Grabber System MT5
Ihor Otkydach
4.83 (23)
탁월한 기술적 지표인 Grabber를 소개합니다. 이 도구는 즉시 사용 가능한 “올인원(All-Inclusive)” 트레이딩 전략으로 작동합니다. 하나의 코드 안에 강력한 시장 기술 분석 도구, 매매 신호(화살표), 알림 기능, 푸시 알림이 통합되어 있습니다. 이 인디케이터를 구매하신 모든 분들께는 다음의 항목이 무료로 제공됩니다: Grabber 유틸리티: 오픈 포지션을 자동으로 관리하는 도구 단계별 영상 매뉴얼: 설치, 설정, 그리고 실제 거래 방법을 안내 맞춤형 세트 파일: 인디케이터를 빠르게 자동 설정하여 최고의 성과를 낼 수 있도록 도와줍니다 다른 전략은 이제 잊어버리세요! Grabber만이 여러분을 새로운 트레이딩의 정점으로 이끌어 줄 수 있습니다. Grabber 전략의 주요 특징: 거래 시간 프레임: M5부터 H4까지 거래 가능한 자산: 어떤 자산이든 사용 가능하지만, 제가 직접 테스트한 종목들을 추천드립니다 (GBPUSD, GBPCAD, GBPCHF, AUDCAD, AU
FX Trend MT5 NG
Daniel Stein
5 (4)
FX Trend NG: 차세대 멀티 마켓 트렌드 인텔리전스 개요 FX Trend NG 는 다중 시간 프레임 기반의 전문 트렌드 분석 및 시장 모니터링 도구입니다. 몇 초 만에 전체 시장 구조를 파악할 수 있도록 설계되었습니다. 여러 차트를 일일이 전환할 필요 없이, 어떤 종목이 추세에 있는지, 어디에서 모멘텀이 약화되고 있는지, 그리고 어떤 시간 프레임이 서로 정렬되어 있는지 즉시 확인할 수 있습니다. 출시 기념 특별 혜택 – FX Trend NG 를 $30 (6개월) 또는 $80 평생 라이선스 로 이용할 수 있습니다. 이미 Stein Investments 고객이신가요? -> 메시지를 보내 전용 고객 그룹에 참여하세요. 설정이나 사용 방법이 필요하신가요? -> Stein Investments 공식 페이지 를 방문하세요. 1. FX Trend NG가 특별한 이유 3단계 추세 로직 – 단순한 Buy / Sell이 아닙니다 • 대부분의 지표는 Buy 또는 Sell 두 가지 상태만 제
이 지표를 구매하면 제 프로페셔널 트레이드 매니저를 무료로 드립니다. 우선 이 거래 시스템이 리페인팅, 리드로잉 및 레이그 인디케이터가 아니라는 점을 강조하는 것이 중요합니다. 이는 수동 및 로봇 거래 모두에 이상적인 것으로 만듭니다. 온라인 강좌, 설명서 및 프리셋 다운로드. "스마트 트렌드 트레이딩 시스템 MT5"은 새로운 및 경험이 풍부한 트레이더를 위해 맞춤형으로 제작된 종합적인 거래 솔루션입니다. 10개 이상의 프리미엄 인디케이터를 결합하고 7개 이상의 견고한 거래 전략을 특징으로 하여 다양한 시장 조건에 대한 다목적 선택이 가능합니다. 트렌드 추종 전략: 효과적인 트렌드 추이를 타기 위한 정확한 진입 및 손절 관리를 제공합니다. 반전 전략: 잠재적인 트렌드 반전을 식별하여 트레이더가 범위 시장을 활용할 수 있게 합니다. 스캘핑 전략: 빠르고 정확한 데이 트레이딩 및 단기 거래를 위해 설계되었습니다. 안정성: 모든 인디케이터가 리페인팅, 리드로잉 및 레이그가 아니므로 신뢰
Btmm state engine pro
Garry James Goodchild
5 (4)
BTMM State Engine Pro is a MetaTrader 5 indicator for traders who use the Beat The Market Maker approach: Asian session context, kill zone timing, level progression, peak formation detection, and a multi-pair scanner from a single chart. It combines cycle state logic with a built-in scanner dashboard so you do not need the same tool on many charts at once. What it does Draws the Asian session range; session times can follow broker server offset or be set in inputs. Tracks level progression (L
Gann Made Easy MT5
Oleg Rodin
5 (3)
Gann Made Easy 는 mr.의 이론을 사용하여 최고의 거래 원칙을 기반으로 하는 전문적이고 사용하기 쉬운 Forex 거래 시스템입니다. W.D. 간. 이 표시기는 Stop Loss 및 Take Profit Levels를 포함하여 정확한 BUY 및 SELL 신호를 제공합니다. PUSH 알림을 사용하여 이동 중에도 거래할 수 있습니다. 구매 후 거래 방법 안내 및 유용한 추가 지표를 무료로 받으시려면 저에게 연락주세요! 아마도 Gann 거래 방법에 대해 이미 여러 번 들었을 것입니다. 일반적으로 Gann의 이론은 초보자 거래자뿐만 아니라 이미 거래 경험이 있는 사람들에게도 매우 복잡한 것입니다. Gann의 거래 방식은 이론적으로 적용하기 쉽지 않기 때문입니다. 나는 그 지식을 연마하고 Forex 지표에 최고의 원칙을 적용하기 위해 몇 년을 보냈습니다. 표시기는 적용하기가 매우 쉽습니다. 차트에 첨부하고 간단한 거래 권장 사항을 따르기만 하면 됩니다. 지표는 지속적으로 시장 분석
Quantum TrendPulse
Bogdan Ion Puscasu
5 (23)
SuperTrend   ,   RSI   ,   Stochastic   의 힘을 하나의 포괄적인 지표로 결합하여 트레이딩 잠재력을 극대화하는 궁극의 트레이딩 도구   인 Quantum TrendPulse를   소개합니다. 정밀성과 효율성을 추구하는 트레이더를 위해 설계된 이 지표는 시장 추세, 모멘텀 변화, 최적의 진입 및 종료 지점을 자신 있게 식별하는 데 도움이 됩니다. 주요 특징: SuperTrend 통합:   주요 시장 추세를 쉽게 따라가고 수익성의 물결을 타세요. RSI 정밀도:   매수 과다 및 매도 과다 수준을 감지하여 시장 반전 시점을 파악하는 데 적합하며 SuperTrend 필터로 사용 가능 확률적 정확도:   변동성이 큰 시장에서 숨겨진 기회를 찾기 위해 확률적 진동   을 활용하고 SuperTrend의 필터로 사용 다중 시간대 분석:   M5부터 H1 또는 H4까지 다양한 시간대에 걸쳐 시장을 최신 상태로 유지하세요. 맞춤형 알림:   맞춤형 거래 조건이 충족되면
Trend Screener Pro MT5
STE S.S.COMPANY
4.85 (104)
트렌드 표시기, 트렌드 트레이딩 및 필터링을 위한 획기적인 고유 솔루션, 하나의 도구 안에 내장된 모든 중요한 트렌드 기능! Forex, 상품, 암호 화폐, 지수 및 주식과 같은 모든 기호/도구에 사용할 수 있는 100% 다시 칠하지 않는 다중 시간 프레임 및 다중 통화 표시기입니다. Trend Screener는 차트에 점이 있는 화살표 추세 신호를 제공하는 효율적인 지표 추세 추종 지표입니다. 추세 분석기 표시기에서 사용할 수 있는 기능: 1. 트렌드 스캐너. 2. 최대 이익 분석이 있는 추세선. 3. 추세 통화 강도 측정기. 4. 경고가 있는 추세 반전 점. 5. 경고가 있는 강력한 추세 점. 6. 추세 화살표 Trend Screener Indicator가 있는 일일 분석 예, 일일 신호 성능...등은 여기에서 찾을 수 있습니다. 여기를 클릭하십시오. LIMITED TIME OFFER : Trend Screener Indicator는 50$ 및 평생 동안만 사용할 수 있습니다.
소개       Quantum Breakout PRO   , 브레이크아웃 존 거래 방식을 변화시키는 획기적인 MQL5 지표! 13년 이상의 거래 경험을 가진 숙련된 트레이더 팀이 개발한       퀀텀 브레이크아웃 PRO       혁신적이고 역동적인 브레이크아웃 존 전략으로 거래 여정을 새로운 차원으로 끌어올리도록 설계되었습니다. Quantum Breakout Indicator는 5개의 이익 목표 영역이 있는 브레이크아웃 영역의 신호 화살표와 브레이크아웃 상자를 기반으로 한 손절 제안을 제공합니다. 초보자 거래자와 전문 거래자 모두에게 적합합니다. Quantum EA 채널:       여기를 클릭하세요 중요한! 구매 후 설치 매뉴얼을 받으려면 개인 메시지를 보내주십시오. 추천: 기간: M15 통화쌍: GBPJPY, EURJPY, USDJPY,NZDUSD, XAUUSD 계정 유형: 스프레드가 매우 낮은 ECN, Raw 또는 Razor 브로커 시간: GMT +3 중개인 :
Atomic Analyst MT5
Issam Kassas
3.94 (31)
우선적으로 언급할 점은이 거래 지표가 다시 그리지 않고 지연되지 않으며 이를 통해 수동 및 로봇 거래 모두에 이상적이라는 점입니다. 사용자 매뉴얼: 설정, 입력 및 전략. Atomic Analyst는 가격의 강도와 모멘텀을 활용하여 시장에서 더 나은 이점을 찾는 PA Price Action Indicator입니다. 고급 필터를 장착하여 잡음과 거짓 신호를 제거하고 거래 잠재력을 높이는 데 도움이 됩니다. 복잡한 지표의 다중 레이어를 사용하여 Atomic Analyst는 차트를 스캔하고 복잡한 수학적 계산을 간단한 신호와 색상으로 변환하여 초보 트레이더가 이해하고 일관된 거래 결정을 내릴 수 있도록합니다. "Atomic Analyst"는 새로운 및 경험이 풍부한 트레이더를위한 종합적인 거래 솔루션입니다. 프리미엄 지표와 최고 수준의 기능을 하나의 거래 전략에 결합하여 모든 종류의 트레이더에 대한 다재다능한 선택지가되었습니다. 인트라데이 거래 및 스캘핑 전략 : 빠르고 정확한 일일
OmniSync Projection
Antonio-alin Teculescu
5 (1)
Chronos Fractal Engine is an innovative price projection indicator for MetaTrader 5, designed to transform your technical analysis by intelligently identifying and projecting historical price patterns. Built upon an advanced correlation algorithm and the fractal principles of the market, this powerful tool visualizes potential future price movements, giving you a unique edge in your trading decisions. What is Chronos Fractal Engine? At its core, the Chronos Fractal Engine employs a sophisticat
Basic Harmonic Patterns Dashboard MT5
Mehran Sepah Mansoor
4.36 (11)
이 대시보드는 선택한 심볼에 대해 사용 가능한 최신 고조파 패턴을 표시하므로 시간을 절약하고 더 효율적으로 사용할 수 있습니다 /   MT4 버전 . 무료 인디케이터:   Basic Harmonic Pattern 인디케이터 열 Symbol :   선택한 심볼이 나타납니다 Trend :   강세 또는 약세 Pattern :   패턴 유형(가틀리, 나비, 박쥐, 게, 상어, 사이퍼 또는 ABCD) Entry :   진입 가격 SL:   스톱로스 가격 TP1:   1차 테이크프로핏 가격 TP2:   2차 테이크프로핏 가격 TP3:   3차 테이크프로핏 가격 Current price:   현재 가격 Age (in bars):   마지막으로 그려진 패턴의 나이 주요 입력 Symbols :   "28개 주요 통화쌍" 또는 "선택한 심볼" 중에서 선택합니다. Selected Symbols :   쉼표로 구분하여 모니터링하려는 원하는 심볼("EURUSD,GBPUSD,XAUUSD")을 선택
Azimuth Pro
Ottaviano De Cicco
5 (7)
Azimuth Pro V2: Synthetic Fractal Structure and Confirmed Entries for MT5 Overview Azimuth Pro is a multi-level swing structure indicator by Merkava Labs . Four nested swing layers, swing-anchored VWAP, ABC pattern detection, three-timeframe structural filtering, and closed-bar confirmed entries — one chart, one workflow from micro-swings to macro-cycles. This is not a blind signal product. It is a structure-first workflow for traders who care about location, context, and timing. V2 Launch Offe
우선적으로, 이 거래 도구는 전문적인 거래에 이상적인 비-다시 그리기 및 지연되지 않는 지표입니다.  온라인 강좌, 사용자 매뉴얼 및 데모. 스마트 가격 액션 컨셉트 인디케이터는 신규 및 경험 많은 트레이더 모두에게 매우 강력한 도구입니다. Inner Circle Trader Analysis 및 Smart Money Concepts Trading Strategies와 같은 고급 거래 아이디어를 결합하여 20가지 이상의 유용한 지표를 하나로 결합합니다. 이 인디케이터는 스마트 머니 컨셉트에 중점을 두어 대형 기관의 거래 방식을 제공하고 이동을 예측하는 데 도움을 줍니다.  특히 유동성 분석에 뛰어나 기관이 어떻게 거래하는지 이해하는 데 도움을 줍니다. 시장 트렌드를 예측하고 가격 변동을 신중하게 분석하는 데 탁월합니다. 귀하의 거래를 기관 전략에 맞추어 시장의 동향에 대해 더 정확한 예측을 할 수 있습니다. 이 인디케이터는 시장 구조를 분석하고 중요한 주문 블록을 식별하고 다양
RelicusRoad Pro MT5
Relicus LLC
5 (24)
RelicusRoad Pro: 퀀트 시장 운영 체제 70% 할인 평생 이용권 (한정 시간) - 2,000명 이상의 트레이더와 함께하세요 왜 대부분의 트레이더는 "완벽한" 지표를 가지고도 실패할까요? 진공 상태에서 단일 개념 만으로 거래하기 때문입니다. 문맥 없는 신호는 도박입니다. 지속적인 승리를 위해서는 컨플루언스(중첩) 가 필요합니다. RelicusRoad Pro는 단순한 화살표 지표가 아닙니다. 완전한 퀀트 시장 생태계 입니다. 독점적인 변동성 모델링을 사용하여 가격이 이동하는 "공정 가치 로드"를 매핑하고, 단순 노이즈와 실제 구조적 돌파를 구분합니다. 추측은 그만두세요. 기관급 로드 로직으로 거래를 시작하세요. 핵심 엔진: "Road" 알고리즘 시스템의 중심에는 시장 상황에 실시간으로 적응하는 동적 변동성 채널인 Road Algo 가 있습니다. 세이프 라인(평형) 과 가격이 수학적으로 반전될 가능성이 높은 확장 레벨 을 투영합니다. Simple Road: 일반적인 시장을 위
SMC Intraday Formula
Kareem Abbas
5 (5)
먼저 솔직하게 말하겠습니다. 어떤 인디케이터도 단독으로 당신을 수익성 있게 만들어주지 않습니다. 누군가 그렇게 말한다면, 그는 당신에게 꿈을 파는 것입니다. 완벽한 매수/매도 화살표를 보여주는 모든 인디케이터는 완벽하게 보이도록 만들 수 있습니다 — 단지 올바른 과거 구간을 확대하고 승리한 거래만 캡처하면 됩니다. 우리는 그렇게 하지 않습니다.  SMC Intraday Formula는 도구입니다. 시장 구조를 읽고, 가장 높은 확률의 가격 구간을 표시하며, 현재 스마트 머니의 흐름이 어떻게 보이는지 아주 단순한 언어로 보여줍니다. 최종 결정은 여전히 당신이 합니다. 실행도 당신이 합니다. 하지만 이제는 희망이 아니라 정확성으로 거래하게 됩니다. 우리는 이 인디케이터를 지난 약 3년 동안 골드(XAUUSD) 및 주요 외환 통화쌍의 데이 트레이딩 스캘핑에 사용해 왔습니다. M1, M5, M15, M30에서 우리의 핵심 도구입니다. 이 도구는 미래를 예측하려 하지 않습니다 — 지금 형성
Trend indicator AI mt5
Ramil Minniakhmetov
5 (17)
트렌드 인공 지능 지표는 실행 가능한 진입 점 및 반전 경고와 추세 식별을 결합하여 상인의 시장 분석을 향상시킬 훌륭한 도구입니다. 이 표시기는 사용자가 자신감과 정밀도로 외환 시장의 복잡성을 탐색 할 수 있도록 지원합니다 기본 신호 외에도 트렌드 인공 지능 지표는 풀백 또는 되돌림 중에 발생하는 2 차 진입 점을 식별하여 거래자가 기존 트렌드 내에서 가격 수정을 활용할 수 있도록합니다. 중요한 장점: ·작동 4 및 5 *명확한 구매 또는 판매 신호 *다시 칠하지 않습니다 *모든 자산에서 작동 나는 전보 사기에 개 또는 세트를 판매하지 않도록주의. 모든 설정은 블로그에 여기에 무료.  중요! 지침 및 보너스를 얻기 위해 구입 후 즉시 저에게 연락! 진짜 가동 감시는 뿐 아니라 나의 다른 제품 여기에서 찾아낼 수 있습니다: https://www.mql5.com/en/users/mechanic/seller&nbsp ; 설정 및 입력: 모든 자산에 대해 기본 설정을 권
Entry Points Pro for MT5
Yury Orlov
4.48 (138)
다시 색을 칠하지 않고 거래에 진입할 수 있는 정확한 신호를 제공하는 MT5용 지표입니다. 외환, 암호화폐, 금속, 주식, 지수 등 모든 금융 자산에 적용할 수 있습니다. 매우 정확한 추정값을 제공하고 매수와 매도의 가장 좋은 시점을 알려줍니다. 하나의 시그널로 수익을 내는 지표의 예와 함께 비디오 (6:22)시청하십시오! 대부분의 거래자는 Entry Points Pro 지표의 도움으로 첫 거래 주 동안 트레이딩 결과를 개선합니다. 저희의   Telegram Group 을 구독하세요! Entry Points Pro 지표의 좋은점. 재도색이 없는 진입 신호 신호가 나타나고 확인되면(시그널 캔들이 완성된 경우) 신호는 더 이상 사라지지 않습니다. 여타 보조지표의 경우 신호를 표시한 다음 제거되기 때문에 큰 재정적 손실로 이어집니다. 오류 없는 거래 게시 알고리즘을 통해 트레이드(진입 또는 청산)를 할 이상적인 순간을 찾을 수 있으며, 이를 통해 이를 사용하는 모든 거래자의 성공률이
Market Structure Order Block Dashboard MT5는 시장 구조와 주요 가격 반응 구역을 차트에서 직접 읽고자 하는 트레이더를 위해 설계된 MT5 지표입니다. BOS, ChoCH, 오더 블록, Fair Value Gap (FVG), 유동성, Kill Zones, Volume Profile 그리고 빠른 분석을 위한 콤팩트한 대시보드를 결합합니다. 이 지표는 시장 구조, ICT 및 Smart Money 개념을 의사결정 프레임워크로 사용하는 트레이더를 대상으로 합니다. 추세 지속, 가능한 반전, 가격 불균형, 유동성 타겟 및 관심 구역을 보다 체계적으로 식별하는 데 도움을 줄 수 있습니다. 구매자를 위한 포함 리소스 구매 후 MQL5 개인 메시지로 요청하시면 완전한 PDF 사용 설명서와 파라미터 설정 팁을 제공해 드립니다. MQL5 개인 메시지를 통한 직접 기술 지원. 1.20 버전은 두 가지 주요 추가 기능을 제공합니다: Pending BOS / Pending
Smart Stop Indicator – 차트 위에서 직접 작동하는 지능형 스톱로스 시스템 개요 Smart Stop Indicator는 감이나 추측이 아닌 명확하고 체계적인 방식으로 스톱로스를 설정하고 싶은 트레이더를 위한 맞춤형 솔루션입니다. 이 도구는 클래식 프라이스 액션 논리(고점, 저점 구조)와 현대적인 브레이크아웃 인식을 결합하여 실제로 가장 논리적인 다음 스톱 레벨을 정확히 식별합니다. 추세, 박스권, 빠른 브레이크아웃 상황 등 어떤 시장에서도 인디케이터는 최적의 SL 구역과 상태(“new”, “broken”, “valid”)를 차트에 직접 표시합니다. 새로운 기능으로 SL 거리의 %ADR 표시가 추가되었습니다. 핵심 기능 자동 시장구조 기반 스톱 설정 • 시장 구조와 실시간 가격 움직임을 기반으로 의미 있는 스톱로스 레벨을 자동으로 탐지합니다. 스마트 브레이크아웃 감지 • 빠른 방향 변화나 돌파 상황에서도 불필요한 조기 스톱 조정을 강요하지 않으며 유연하게 반응합
Crystal Heikin Ashi Signals
Muhammad Jawad Shabir
5 (2)
Crystal Heikin Ashi Signals - Professional Trend & Signal Detection Indicator Advanced Heikin Ashi Visualization with Intelligent Signal System for Manual & Automated Trading Final Price: $149 ---------> Price goes up $10 after every 10 sales . Limited slots available — act fast . Overview Crystal Heikin Ashi Signals is a professional-grade MetaTrader 5 indicator that combines pure Heikin Ashi candle visualization with an advanced momentum-shift detection system. Designed for both manual traders
Bill Williams Advanced
Siarhei Vashchylka
5 (11)
Bill Williams Advanced is designed for automatic chart analysis using Bill Williams' "Profitunity" system. The indicator analyzes four timeframes at once. Manual (Be sure to read before purchasing) Advantages 1. Analyzes the chart using Bill Williams' "Profitunity" system. Signals are displayed in a table in the corner of the screen and on the price chart. 2. Finds all known AO and AC signals, as well as zone signals. Equipped with a trend filter based on the Alligator. 3. Finds "Divergence Bar
ARICoins
Temirlan Kdyrkhan
ARICoin is a powerful trading companion designed to generate high-probability entry signals with dynamic TP/SL/DP levels based on volatility. Built-in performance tracking shows win/loss stats, PP1/PP2 hits, and success rates all updated live. Key Features: Buy/Sell signals with adaptive volatility bands Real-time TP/SL/DP levels based on ATR Built-in MA Filter with optional ATR/StdDev volatility Performance stats panel (Success, Profit/Loss, PP1/PP2) Alerts via popup, sound, push, or email Cust
Market Structure Patterns
Samuel Manoel De Souza
4.47 (19)
Market Structure Patterns   is an indicator based on   smart money concepts   that displays   SMC/ICT   elements that can take your trading decisions to the next level. Take advantage of the   alerts ,   push notifications   and   email messages   to keep informed from when an element is formed on the chart, the price crosses a level and/or enters in a box/zone. Developers can access the values of the elements of the indicator using the   global variables  what allows the automation of trading
Meridian Pro
Ottaviano De Cicco
5 (1)
Meridian Pro 2.00: Professional Multi-Timeframe Trend Matrix for MT5 Meridian Pro 2.00 is a professional adaptive trend matrix for MetaTrader 5. It combines the original Meridian trend engine, a clean chart ribbon, closed-bar signal arrows, an 8-timeframe dashboard, Fuel momentum, weighted consensus, synthetic HTF processing and chart-native higher-timeframe context lines. The goal is simple: read current trend, multi-timeframe structure, strength, momentum and EA-ready state from one discipline
Advanced Supply Demand MT5
Bernhard Schweigert
4.53 (15)
현재 33% 할인! 초보자나 전문 트레이더를 위한 최고의 솔루션! 이 보조지표는 우리가 다수의 독창적 기능과 새로운 공식을 통합한 독특하고 고품질이며 저렴한 거래 도구입니다. 이 업데이트를 통해 이중 시간대를 표시할 수 있습니다. 더 높은 TF를 표시할 수 있을 뿐만 아니라 차트 TF와 더 높은 TF 모두를 표시할 수 있습니다: 중첩 영역 표시. 모든 Supply Demand 트레이더들이 좋아할 것입니다. :) 중요한 정보 공개 Advanced Supply Demand의 잠재력을 극대화하려면 다음을 방문하십시오. https://www.mql5.com/ko/blogs/post/720245   진입 또는 목표의 명확한 트리거 포인트를 정확히 찾아냄으로 해서 거래가 어떻게 개선될지 상상해 보십시오. 새로운 알고리즘을 기반으로 매수자와 매도자 간의 잠재적인 불균형을 훨씬 더 쉽게 분간할 수 있습니다. 왜냐하면 가장 강한 공급영역과 가장 강한 수요 영역과 과거에 어떻게 진행 되었는지를(이전
제작자의 제품 더 보기
Phase Angle Cycle Mt5
Pieter Gerhardus Van Zyl
Phase Angle Cycle Mt5  is a precision timing oscillator designed to reveal the underlying rhythm of price movement. Instead of relying on traditional momentum or overbought/oversold logic, it focuses on identifying the market’s internal phase progression and dominant cycle structure. Displayed in a separate window, it blends phase positioning with adaptive frequency smoothing to help traders recognize where price is within its current rotational path. The main PhaseAngle line reflects the market
Phase Angle Cycle
Pieter Gerhardus Van Zyl
Phase Angle Cycle is a precision timing oscillator designed to reveal the underlying rhythm of price movement. Instead of relying on traditional momentum or overbought/oversold logic, it focuses on identifying the market’s internal phase progression and dominant cycle structure. Displayed in a separate window, it blends phase positioning with adaptive frequency smoothing to help traders recognize where price is within its current rotational path. The main PhaseAngle line reflects the market’s re
Quantum Core Phase Shift
Pieter Gerhardus Van Zyl
Quantum Core – Phase Shift is a neural synchronization engine designed for intermarket phase diagnostics. Harnessing temporal displacement algorithms and flux harmonics, it decodes the hidden oscillatory behavior of market energy fields. The NeuroLink Trace renders the core stability vector, while the Quantum Phase Core tracks phase divergence through a smoothed temporal conduit. Anchored to a central gravity threshold, it expands and contracts dynamically, visualizing phase shifts in real ti
Non Repaint Diamonds
Pieter Gerhardus Van Zyl
Non Repaint Diamonds is a precision-engineered MT5 indicator designed to provide traders with highly reliable chart signals that remain stable once confirmed. Unlike repainting tools that shift or vanish after the fact, this indicator locks its signals in place, allowing traders to analyze with confidence. It marks the chart with distinct diamond-shaped signals that highlight potential turning points in market structure. The tool offers flexible customization of signal appearance, offsets, an
Reversal Spiker
Pieter Gerhardus Van Zyl
5 (1)
Reversal Spiker is a dynamic momentum–volatility fusion indicator designed to highlight extreme market conditions where price is statistically stretched and prone to reversal. It operates in a separate window, displaying a normalized histogram that expands toward high values when multiple internal forces align. A dynamic threshold line adapts in real time to changing market volatility, helping distinguish ordinary movement from true exhaustion spikes. At its core, the indicator blends several mo
Pullback Arrows
Pieter Gerhardus Van Zyl
5 (1)
i pyosigineun EMAleul giban-eulo han idong pyeong-gyun mich magdae saegsang-eulo maesu mich maedo hwasalpyoleul jegonghabnida. idongpyeong-gyunseon wieneun maesu hwasalpyoman pyosidoego idongpyeong-gyunseon alaeeneun maedo hwasalpyoman pyosidoebnida. hwasalpyoneun banjeon algolijeum-eul giban-eulo hameulo pulbaeg jijeom-eul chaj-eulyeogo habnida. wonhaneun daelo allim-eul hwalseonghwahal su issseubnida.  seontaeghan gigan-ina dogue jeoghab gumaehagi jeon-e demo-eseo teseuteuhae b
Spinosaurus
Pieter Gerhardus Van Zyl
The indicator is a histogram that is great for showing when to enter the market When the hump moves above the median go long and when it moves below the median go short The colors can be adjusted as preferred  Suitable for any timeframe Test in demo before purchase Enjoy -------------------------------------------------------------------------------
Arrow Wizard
Pieter Gerhardus Van Zyl
Arrow Wizard v1.1 – The Spellcaster of Precision Signals Step into the mystical world of technical sorcery with Arrow Wizard , your trusted arcane companion for revealing buy and sell portals on any price chart. Powered by a fusion of ATR incantations , Fibonacci alignments , and pivot-based foresight , this indicator weaves price action and volatility into clear directional arrows – each one a magical glyph pointing toward trade opportunity. Arcane Mechanics Arrow Wizard channels the
Gold Strength Index Pro
Pieter Gerhardus Van Zyl
Gold Strength Index Pro (GSI Pro)  is an indicator designed to analyze gold's strength across multiple currency pairs. It aggregates weighted price data from 7 XAU pairs (e.g., XAUUSD, XAUEUR) over a user-defined lookback period, calculating a composite strength value. Key features include: Color-Coded Histogram : Displays bullish (green) and bearish (red) - momentum based on a threshold zone (±0.2 default). Smoothed Lines : A gold-colored EMA (SmoothPeriod) reduces noise, while a DodgerBlue si
Dragons Pulse Oracle
Pieter Gerhardus Van Zyl
The Dragon's Pulse Oracle - A Mystical Market Divination Tool In the ancient halls of trading lore, where fortunes rise and fall like the breath of dragons, the   Dragon's Pulse Oracle   emerges—a powerful indicator forged from the wisdom of seers and the primal energy of the markets. This mystical tool reveals the hidden currents of price action, transforming raw data into prophetic visions of bullish fire and bearish shadow. The Oracle's Wisdom The Dragon's Pulse Oracle interprets the market's
AlienCore Oscillator
Pieter Gerhardus Van Zyl
AlienCore Oscillator is a futuristic market momentum analyzer inspired by intergalactic signal processing. Based on the enhanced MACD concept, it measures the energy flux between fast and slow warp fields, then decodes the telepathic sync signal to reveal alien-level insights into trend strength and shifts. Quantum Surges (strong bullish moves) and Void Collapses (strong bearish moves) are visualized through vibrant histograms, while Nebula Drifts and Gravity Pulls signal moderate momentum. Des
USD Macro Strength Index
Pieter Gerhardus Van Zyl
The USD Macro Strength Index is a custom indicator designed to assess and visualize the overall strength or weakness of the US Dollar (USD) across major currency pairs. It achieves this by calculating a weighted average of USD-related price changes over a defined lookback period and displaying the results as a color-coded histogram with optional smoothed index and signal lines. Key Features: Macro USD Sentiment Analysis: Uses six major USD pairs ( EURUSD , USDJPY , GBPUSD , AUDUSD , USDCAD
Dragonfire Arrows
Pieter Gerhardus Van Zyl
Dragonfire Arrows is a mythical-themed arrow signal indicator that blends adaptive trend-following logic with multiple types of moving averages—reimagined as “Dragon Breaths.” It generates Buy (Ice Arrow ↑) and Sell (Fire Arrow ↓) signals directly on the chart using a multi-layered pulse system inspired by fantasy creatures, each with its own moving average logic. The system uses three magical “pulse” layers: Dragon’s Quick Pulse (fast MA), Wyvern’s Slow Pulse (slow MA), and Mage’s Sight (weight
FREE
XauUsd Net Strength
Pieter Gerhardus Van Zyl
The XauUsd Net Strength indicator is a professional-grade market strength tool designed to track and compare the relative performance of Gold (XAU) against the U.S. Dollar (USD) across a diversified basket of currency pairs. Instead of relying on a single chart, it aggregates information from multiple gold- and dollar-based pairs, applies weighting factors, and translates the results into an easy-to-read strength comparison. The indicator plots six components in a separate window: Green & Red Hi
Multi Currency Strength Index
Pieter Gerhardus Van Zyl
The Multi-Currency Strength Index is a professional analytical tool designed to reveal relative strength and weakness across major currencies and Gold in a single, unified view. Instead of focusing on one symbol at a time, the indicator evaluates multiple instruments simultaneously and plots smooth strength lines in a separate window, making cross-market comparison fast and intuitive. Each colored line represents a currency’s aggregated performance over the selected analysis period. Values above
Non Repaint Dots
Pieter Gerhardus Van Zyl
The indicator is designed to highlight potential buy and sell opportunities on the chart using green and red dots . A green dot suggests that price has broken upward past a calculated threshold, signaling a possible bullish move. A red dot suggests that price has broken downward past a calculated threshold, signaling a possible bearish move. It adapts to market conditions by factoring in both trend movement and volatility , so the signals adjust when markets are more or less active. Because it o
Wavelet Pro
Pieter Gerhardus Van Zyl
Wavelet Pro is a precision-engineered market analysis indicator designed for traders who demand clarity in complex price movement. It blends wavelet-style trend detection , quantum momentum shifts , and adaptive candle visualization into a unified trading framework. The system’s goal is to provide a refined visual representation of trend strength, phase changes, and market balance without lag or repainting behavior. At its core, Wavelet Pro constructs a dynamic dual-line wave structure that rea
NeuroSlope
Pieter Gerhardus Van Zyl
NeuroSlope is a precision-tuned market strength indicator that enhances RSI analysis using adaptive neuro-style smoothing. It intelligently filters out noise and volatility spikes while maintaining the RSI’s natural rhythm, creating a clean, flowing signal that better reflects underlying price momentum. The dual-histogram structure — the smart smoothed RSI (blue) and its advanced slope curve (yellow) — provides a clear visual framework for identifying directional bias, shifts in market strength,
Astral Energy
Pieter Gerhardus Van Zyl
Astral Energy (MT4) From the Astral Mechanics Lab – Ptr777 Overview Astral Energy is an advanced subwindow indicator designed to visualize the directional “flow” of market energy through a harmonic dual-stream histogram. It interprets the balance of internal strength and weakness within price movement — revealing when the market’s astral momentum is aligning for expansion (ascending phase) or contraction (descending phase). Behind the scenes, Astral Energy translates complex volatility and di
Cosmic Flow
Pieter Gerhardus Van Zyl
Cosmic Flow  From the Astral Mechanics Lab – Ptr777 , Cosmic Flow is the harmonic oscillator at the heart of astral motion and energetic balance. It visualizes the subtle rhythm between celestial expansion and contraction — the hidden pulse that governs the market’s energetic tides. Each bar in the histogram represents the phase alignment between astral momentum and harmonic strength, capturing the invisible ebb and surge of flow between creation (rise), dissolution (fall), and the void of ba
Goldin Line
Pieter Gerhardus Van Zyl
Goldin Line is a precision momentum oscillator designed to reveal hidden shifts in market pressure. It plots a dynamic Gold Line together with a Signal Line inside a normalized 0–100 scale, allowing traders to quickly identify momentum transitions and potential trend opportunities. The indicator blends market activity with a gold-influenced component to create a unique view of price strength and weakness. Horizontal guide levels help visualize overextended conditions and equilibrium zones, maki
Gold Ripper Oscillator
Pieter Gerhardus Van Zyl
The Gold Ripper Oscillator is a specialized momentum-pressure gauge designed for XAUUSD. It visualizes the real-time tug-of-war between bullish gold strength (“GoldRush”) and opposing USD pressure (“USDCrush”). The indicator displays two color-coded histogram streams that expand or contract based on shifting market drive. When the gold side dominates, golden bars rise above the baseline, reflecting strong upward energy. When USD-driven weakness takes control, crimson bars form below the baseline
Cosmic Nexus
Pieter Gerhardus Van Zyl
Cosmic Nexus is a pure momentum-direction histogram designed to show the dominant force in the market with instant visual clarity. Instead of plotting fluctuating values, it simplifies momentum into two clean states: Cosmic Ascension (green) when upward pressure dominates, and Celestial Descent (violet) when downside energy takes control. This makes trend recognition fast and intuitive, even during volatile periods. You can use Cosmic Nexus as a directional filter, a trend confirmation layer, or
Cosmic Nebula
Pieter Gerhardus Van Zyl
Cosmic Nebula is an advanced MT4 momentum and trend-state oscillator that transforms classical ADX directional flow into a multi-state market structure model. By combining directional pressure, triple-EMA (TEMA) smoothing, and weighted signal comparison, it visualizes market conditions as distinct “cosmic phases,” allowing traders to instantly recognize trend strength, transitions, and exhaustion. The indicator runs in a separate window and plots four color-coded histogram states around a zero e
Neuro Lines
Pieter Gerhardus Van Zyl
Neuro Lines is an advanced visual momentum-mapping indicator designed to overlay intelligent oscillation lines directly onto the price chart. Instead of working in a separate sub-window, it transforms internal market rhythm into dynamic, price-scaled lines that move with the chart itself. This creates a highly intuitive view of momentum shifts, trend bias, and timing without cluttering your workspace. The indicator plots two adaptive lines: a fast-reacting signal line and a smoother guidance lin
Gold Force Index
Pieter Gerhardus Van Zyl
Gold Force Index is a relative strength oscillator designed to compare Gold and the US Dollar in a clean, intuitive way. It visualizes which side of the market currently holds dominance by transforming multi-market data into two normalized strength curves displayed in a separate indicator window. The focus is clarity: instead of reacting to short-term price noise, the indicator highlights sustained shifts in strength that often precede meaningful market moves. Both strength readings are plotted
Gold Oscillator Pro
Pieter Gerhardus Van Zyl
Gold Oscillator Pro is a professional momentum and strength oscillator designed to give a clear, structured view of gold market conditions across multiple related instruments. It condenses complex market behavior into a single, easy-to-read histogram with an adaptive signal line, helping traders identify bullish and bearish phases, momentum shifts, and potential continuation or exhaustion zones. The indicator is displayed in a separate window and uses color-coded histogram bars to reflect four d
Wavelet Energy Pro
Pieter Gerhardus Van Zyl
Wavelet Energy Pro is an advanced momentum and pressure-analysis oscillator designed to reveal how much directional “energy” is present in the market, not just which way price is moving. Instead of focusing on raw price alone, it highlights the balance between bullish and bearish force, how strong that force is, and—most importantly—when that strength begins to fade. The indicator is displayed in a separate window and combines two perspectives: a fast, responsive energy reading and a smoother, r
Gold Bands
Pieter Gerhardus Van Zyl
Gold Bands is a precision chart indicator designed to highlight cyclical price behavior while adapting to changing market volatility. The indicator plots a dynamic central line that follows a smoothed price rhythm derived from market structure rather than simple price averaging. This core line represents the underlying oscillation of price movement and helps traders visually identify shifts between expansion and contraction phases. Surrounding the center line are two sets of adaptive bands that
Bitcoin Barometer
Pieter Gerhardus Van Zyl
Bitcoin Barometer  is a dual-strength oscillator designed to measure the relative momentum of Bitcoin versus the US Dollar in one clear view. It plots two smoothed lines in a separate window: BTC Strength (orange) and USD Strength (blue), both normalized on a 0–100 scale with a central equilibrium level at 50. The indicator calculates percentage return over a customizable lookback period (minutes, hours, or days), then converts that return into a strength score. USD strength is derived from a ba
필터:
리뷰 없음
리뷰 답변