Trend Dot Indicator MT5
- 지표
- 버전: 1.2
- 업데이트됨: 7 12월 2025
- 활성화: 10

Trend Dot Indicator MT5
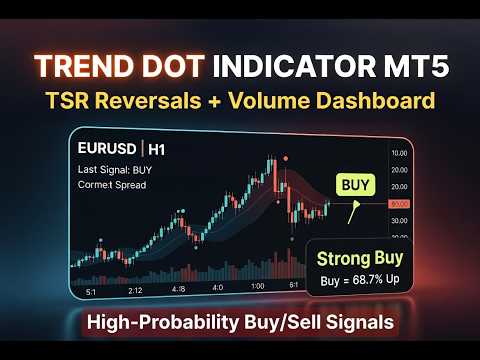
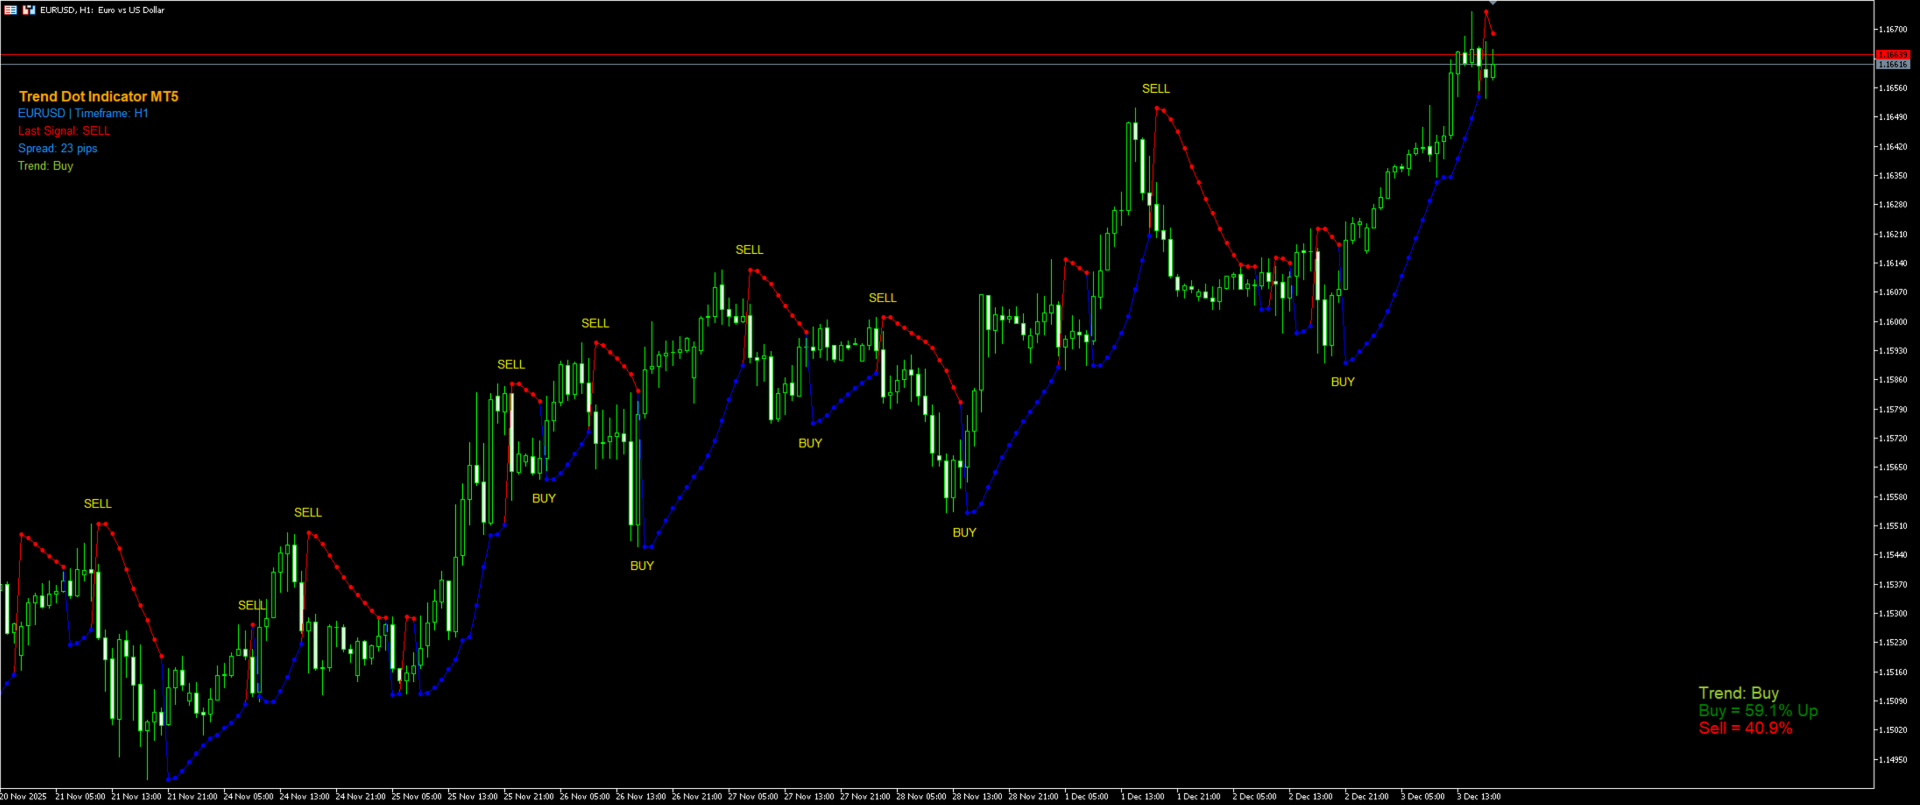
A fast-reacting Trend Step Regression (TSR) line with color-coded dots instantly shows the current trend. Buy and Sellsignals appear only when a real reversal occurs, confirmed by minimum trend length and ADX strength.
Visit my MQL5 blog profile to read the full guide.
Support and questions via MQL5 product comments.
For questions, updates, and to connect with other traders, join my official MQL5 group ForexEAandMore
Features:
- Clear visual TSR line
- Filtered reversal signals with text labels
- Real-time volume pressure dashboard
- Info panel: symbol, timeframe, last signal, spread, volume trend
- Alerts pop-up, push and email
Clean chart, strong signals, works on all markets and timeframes.
Disclaimer
This indicator is provided for informational purposes only and does not constitute financial advice. Past performance calculated using historical data does not guarantee future results, and trading involves risk of loss. Always test the product in a demo account, combine it with appropriate risk management, and consult a professional advisor if necessary. The developer assumes no liability for any trading decisions made based on this tool. Translations are available via MQL5 tools for global accessibility.