OverBought OverSold Average Level Dashboard


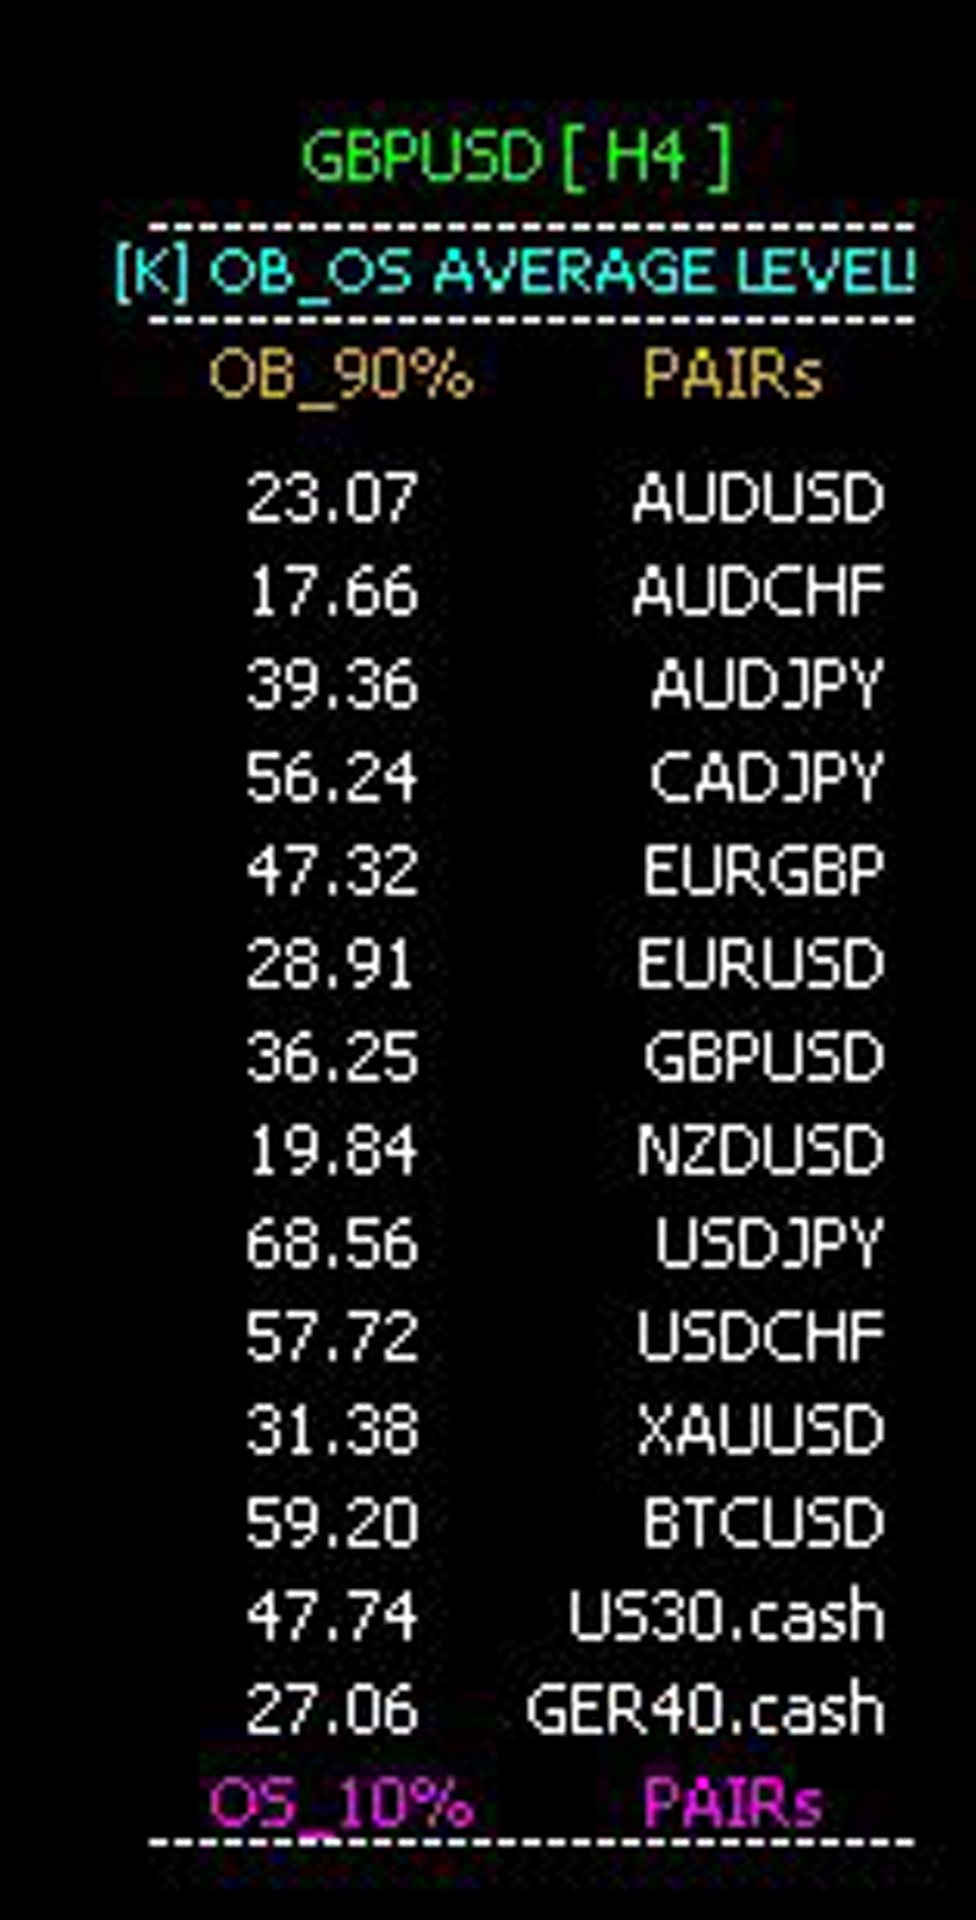
This is  a dashboard indicator that displays the Average Level of each selected currency pairs that filters and gives us a signal for overbought (>=90%) or if price at extreme peak above 90, and/or oversold (<=10%) or if price at extreme peak below 10.

The calculation is using Relative Strength Index default periods (2 & 9) applied to three different higher time frames H4,D1,&W1.

This won't change or altered even if you change symbol or switch to lower time frames or even in monthly and yearly time frames.

In using this indicator we have the advantage that would helps us filter in finding and identifying the last step of price in trending market condition, and/or first step of price of the next trend/cycle(opposite) easily and be alerted if the selected currency pair is at Xtreme peak above or Overbought>=90% or is at Xtreme peak below or Oversold<=10%.

With the signals we can prepare the plan for our trades if the market is at its extreme peak of price movement or at extreme zone or cycle.
The signal should be added with confluence with other trading tool that filters the Xtreme peak of price in the trending market condition.

This indicator is recommended for swing and long position trading.

The indicator is equipped with alerts: notification, message, & email alerts of each selected currency pairs.

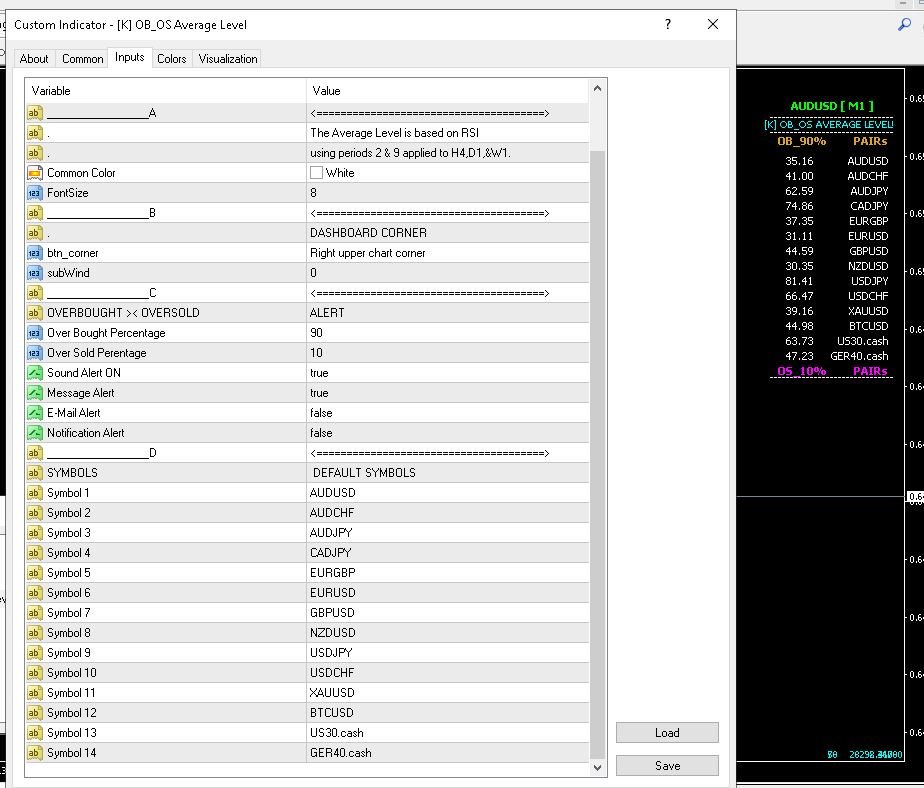
You can also change currency pair of your choice in the "Inputs" Tab.

You can change the percentage for overbought and oversold in the "Inputs Tab. Default: 90% for OverBought and 10% for OverSold

[please view images for you to understand the functions well or watch the video. thank you.]

ATTENTION:  If you download this indicator from Free Demo link, it will save in the Expert Advisors Folder under Market Folder and can only be run in the "Strategy Tester".  Sometimes the test won't work and no display on chart. So better contact the seller or use the product without limitations, purchase the full version from the market. (MQL5.com)

Disclaimer: this indicator or trading tool is to be use only to filter price action and give signal of each selected currency pairs.  this tool will determine the last step of the trend and first step of the next trend/cycle(opposite) of the price movement in the market. This is not intended and not to be use for entering trades.  For more info or queries or request, please send a message to the seller including your proof of payment screen shot with your MQL5 profile only here on this website MQL5 dot com.

For the upgraded updated version with symbol changer, you may contact the seller.
Thank you.  Enjoy and Happy Trading!
추천 제품
Binary Option Signal
Yaroslav Varankin
Indicator for binary options arrow is easy to use and does not require configuration works on all currency pairs, cryptocurrencies buy signal blue up arrow sell signal red down arrow tips do not trade during news and 15-30 minutes before their release, as the market is too volatile and there is a lot of noise it is worth entering trades one or two candles from the current period (recommended for 1 candle) timeframe up to m 15 recommended money management fixed lot or fixed percentage of the depo
Forex Gump
Andrey Kozak
2.4 (5)
Forex Gump is a fully finished semi-automatic trading system. In the form of arrows, signals are displayed on the screen for opening and closing deals. All you need is to follow the instructions of the indicator. When the indicator shows a blue arrow, you need to open a buy order. When the indicator shows a red arrow, you need to open a sell order. Close orders when the indicator draws a yellow cross. In order to get the most effective result, we recommend using the timeframes H1, H4, D1. There
"다이나믹 스캘핑 오실레이터"는 MT4를 위한 고급 맞춤형 암호화폐/외환 지표이자 효율적인 트레이딩 도구입니다! - 차세대 오실레이터 - 사용 방법은 그림을 참조하세요. - 다이나믹 스캘핑 오실레이터는 적응형 과매도/과매수 영역을 제공합니다. - 오실레이터는 동적인 과매도/과매수 영역에서 정확한 진입 시점을 찾는 보조 도구입니다. - 과매도 값: 녹색선 아래, 과매수 값: 주황색선 위. - 이 지표는 가격 변동 패턴과도 결합하기 좋습니다. - 일반 오실레이터보다 훨씬 정확합니다. 적합한 시간대: M30, H1, H4, D1, W1. - PC 및 모바일 알림 기능 제공. .......................................................................... 여기를 클릭하여 고품질 트레이딩 로봇과 지표를 확인하세요! MQL5 웹사이트에서만 제공되는 오리지널 제품입니다.
Signal From Level
Yaroslav Varankin
Binary Options Support Resistance Indicator This indicator is designed for binary options trading and effectively shows retracements from support and resistance levels. Signals appear on the current candle. A red arrow pointing downwards indicates a potential selling opportunity, while a blue arrow pointing upwards suggests buying opportunities. All that needs adjustment is the color of the signal arrows. It is recommended to use it on the M1-M5 timeframes as signals are frequent on these timef
Pyro Trend
Oleksii Ferbei
Pyro Trend is a new product that allows you to identify the current market phase (uptrend, downtrend or flat). The indicator is applicable for any data and periods. The middle of the trend wave, as well as the edges, are places of special heat and market behavior; when writing the indicator, an attempt was made to implement precisely finding the middle. Pyro Trend is a trend indicator that uses an original calculation algorithm. This indicator paints arrows in different colors depending on the
PTW NON REPAINT TRADING SYSTEM + HISTOGRAM Non-Repainting ,   Non-Redrawing   and   Non-Lagging  Trading System. Does the following: - Gives Accurate Entry and Exit Points - Scalping, Day and Swing Trading  - 95% Accuracy  - Targets, where to take profits. - Shows Trends, Support and resistance levels - Works on All Brokers - Works on All Currencies, CFDs and Stocks - It does not place trades for you, it only shows you what trades to place. - It works on All Timeframes - It is for Trend or ran
이 지표는 실제 거래에 완벽한 자동 파동 분석 지표입니다! 사례... 참고:   웨이브 그레이딩에 서양식 이름을 사용하는 데 익숙하지 않습니다. Tang Lun(Tang Zhong Shuo Zen)의 명명 규칙의 영향으로 기본 웨이브를   펜   으로 명명하고 2차 웨이브 밴드를   세그먼트   로 명명했습니다. 동시에, 세그먼트에는 추세 방향이 있습니다.   주요 추세 세그먼트에는   이름이 지정되지만(이 이름 지정 방법은 향후 노트에서 사용됩니다. 먼저 말씀드리겠습니다.) 알고리즘은 굴곡 이론과 거의 관련이 없으므로 그렇게 해서는 안 됩니다. 이는 나의 시장 분석을   통해 요약된 끊임없이 변화하고 복잡한 운영 규칙을   반영합니다. 밴드는 더 이상 사람마다 다르지 않도록 표준화되고 정의되었습니다. 인위적인 간섭의 드로잉 방법은 시장 진입을 엄격하게 분석하는 데 핵심적인 역할을 합니다. 이 지표를 사용하는 것은 거래 인터페이스의 미학을 개선하고 원래의 K-line 거래를
Deep Analyst Expert Advisor    (mt5  https://www.mql5.com/en/market/product/163998 ) Deep Analyst   is a professional analytical tool powered by a specialized algorithm designed for deep analysis of market cycles and price amplitude fluctuations. By analyzing market conditions over a specific timeframe, the Expert Advisor determines price strength and amplitude using a unique indicator system based exclusively on real-time data. When the global trend and its vector shift, the algorithm automati
This indicator works on MT4 and is very easy to use. When you receive a signal from it, you wait for that candle with the signal to close and you enter your trade at the beginning of the next new candle . A red arrow means sell and a green arrow means buy. All arrows comes with Alert  like for easy identification of trade signal. Are you okay with that? 1 minute candle 1 minute expire
PipFinite Impulse PRO
Karlo Wilson Vendiola
4.94 (62)
Are You Tired Of Getting Hunted By Spikes And Whipsaws? Don't become a victim of the market's erratic moves.. Do Something About It! Instantly make smarter decisions with Impulse Pro's precise balance of filters and accurate statistics. Timing Is Everything In Trading To learn more, please visit www.mql5.com/en/blogs/post/718212 Anticipate the next big move before it unfolds in 3 Simple Steps! Advantages You Get Early impulse detection algorithm. Flexible combination to different trading s
[ MT5 Version ]  [ Kill Zones ]  [ SMT Divergences ] How to trade using Order Blocks:  Click here User Interface Performance:  During testing in the strategy tester, the UI may experience lag. Rest assured, this issue is specific to the testing environment and does not affect the indicator's performance in live trading. Elevate your trading strategy with the  Order Blocks ICT Multi TF  indicator, a cutting-edge tool designed to enhance your trading decisions through advanced order block analys
Market Structure Zig Zag
Lesedi Oliver Seilane
4.66 (29)
Free Market structure zig zag to assist in price action trading the screenshots describe how to use and how to spot patterns new version comes with alerts, email alert and  push notification alert can be used on all pairs  can be used on all timeframes  you can add additional confirmation indicators the indicator shows you your higher high and low highs as well as your lower lows and lower highs  the indication makes price action analysis easier to spot.
FREE
Scalp88
Andrey Kozak
Scalp88 — MTF Scalp Indicator for XAUUSD (M1) Scalp88 is a professional scalping indicator for MetaTrader 4 , designed for fast market reading on the M1 timeframe and trading in the direction of the prevailing impulse. The indicator combines dynamic trend logic , volatility normalization (ATR) , and multi-timeframe confirmation (MTF) , presenting everything as clear arrows and an easy-to-read strength percentage. To learn how to purchase the indicator, follow this link:  https://www.mql5.com/en/
The new update makes this indicator a complete tool for studying, analyzing and operating probabilistic patterns. It includes: On-chart Multi-asset percentage monitor. Configurable martingales. Twenty-one pre-configured patterns , including Mhi patterns and C3. An advanced pattern editor to store up to 5 custom patterns. Backtest mode to test results with loss reports. Trend filter. Hit operational filter. Martingale Cycles option. Various types of strategies and alerts. Confluence between patte
Sarangani Venom
Sherwin Dennis Tava Ruiz
sarangani venom is 100% profitable, easy to use indicator, a chart without indicator is stressful and will lead you to many losses, this indicator is pleasing to the eye that will gives you more confident to trade when there is signal, your computer will gives sound and the spider will animate, it can be used to all time frame and to all currency, you have many options, when the candlestick touches to upper line it is buy, when it touches to lower line it is sell, when the rope is pull to buy ar
The basis of the indicator is based on my trading strategy, according to which I trade daily. I automated my system so that it would learn on the market independently. The indicator will not show transactions on the history of the chart, since all calculations of the trading system are in real time. Differences from other indicators: Real time calculations Dynamic Take Profits Dynamic Signals Trend Signals Ideal for beginners Any Currency Pair Any TimeFrame Suitable for scalping To enter
PZ Mean Reversion MT4
PZ TRADING SLU
3 (4)
평균 회귀 거래에 대한 전문적이고 정량적인 접근 방식을 구현하는 고유한 지표입니다. 이는 가격이 예측 가능하고 측정 가능한 방식으로 평균으로 전환되고 반환된다는 사실을 이용하여 비정량적 거래 전략을 훨씬 능가하는 명확한 진입 및 퇴장 규칙을 허용합니다. [ Installation Guide | Update Guide | Troubleshooting | FAQ | All Products ] 명확한 거래 신호 놀랍도록 쉬운 거래 사용자 정의 가능한 색상 및 크기 성능 통계 구현 대부분의 거래 전략을 능가합니다. 적절한 SL 및 TP 레벨을 표시합니다. 이메일/음향/시각 알림을 구현합니다. 작동 원리 이 지표는 더 높은 기간에서 완전히 사용자 정의 가능한 이동 평균 주변의 표준 편차를 측정하고 추세 추종 접근 방식을 사용하여 정확하게 거래를 찾습니다. 거래는 현재 차트의 가격 동작을 살펴보고 선택한 더 높은 기간에서 계산된 평균 가격대로 가격이 돌아오면 닫힙니다. 코딩 방식 때문에 지
GeoWprPro
Georgij Komarov
WPR by Profile, or WPR for Professionals Geo_WprPro is one of the well-known currency profile indicators. It simultaneously displays two WPR indicators with different parameters in the matrix form on all timeframes of multiple currency pairs forming the currency profile . As follows from the description, " WPR is a leading indicator that often goes ahead of the price chart. The oscillator frequently reaches extreme values before the price reversal as if anticipating that event: it almost always
Email Drawdown Alert
Roman Starostin
5 (12)
Free informative Indicator-helper. It'll be usefull for traders who trade many symbols or using grid systems (Averaging or Martingale). Indicator counts drawdown as percent and currency separate. It has a number of settings: Count deposite drawdown according equity value and send e-mail or notifications to user if DD more than set; Sending e-mail when max open orders reached; Shows price and remaining pips amount before MarginCall on current chart and Account generally; Display summary trade lot
FREE
Godfather
Ivan Simonika
The intelligent algorithm of the Godfather indicator accurately determines the trend, filters out market noise and generates entry and exit levels. The indicator will help in finding entry points when analyzing the price chart. The program first receives a "snapshot" of the graph, then analyzes it. The results are reported to the trader in the form of signals. The main purpose of this indicator is to determine the moments of entries and exits from transactions, so the indicator displays only th
**바이너리 스마트 시스템 소개: 귀하의 궁극적인 트레이딩 파트너** 바이너리 스마트 시스템은 단순히 인디케이터가 아닙니다. 이는 정교한 트레이딩 도구로, 다양한 시장에서 핀포인트 정확도와 적시의 신호를 제공하여 트레이더에게 성공을 이끌어주는 데 주안점을 둔 것입니다. 혁신적인 알고리즘과 다양한 기술적 지표의 철저한 컬렉션을 기반으로 구축된 이 시스템은 트레이딩 성공을 얻기 위한 열쇠입니다. **인디케이터 구성 요소:** 1. **이동 평균 비율 (MAP):** 이 구성 요소는 다양한 이동 평균의 가중 평균을 계산하여 추세 식별을 위한 강력한 기준을 형성합니다. MAP은 시장 상황에 동적으로 적응하여 현재 추세 방향을 파악하는 정보를 제공합니다. 2. **상품 채널 지수 (CCI):** 평균 가격으로부터의 편차를 분석함으로써 CCI는 과매수 및 과매도 조건을 판단합니다. 바이너리 스마트 시스템의 CCI 통합은 잠재적인 반전 지점을 식별하는 종합적인 접근을 보장합니다. 3.
Deal Trading SPT
Sukunthakan Ngernbamrung
Deal Trading SPT (Super Trend) is an indicator, shows the market trend direction, entry position, take profit level, stop loss level and trend strength. Utility Help to further filter and develop strategy to trade Market overview on the chart Stop loss and take profit calculation with market volatility Resistance and support for trialing stop No repaint after the finished bar Works in any timeframe and financial instrument, including forex, CFD and crypto etc. Message pop-up, notification with
Introducing the "Magic Trades" for MetaTrader 4 – your ultimate tool for precision trading in dynamic markets. This innovative indicator revolutionizes the way you perceive market trends by harnessing the power of advanced analysis to detect subtle changes in character, paving the way for optimal trading opportunities. The Magic Trades Indicator is designed to empower traders with insightful entry points and well-defined risk management levels. Through its sophisticated algorithm, this indicato
EARLY REMINDER: The Starting price is 65 price will rise soon up to 365$ and then 750$ after first 10 copies of sales. Grab this offer now! Introduction Hello, traders! Welcome to the demonstration of the Forex Beast Indicator , a comprehensive tool designed to assist aspiring traders in navigating the complexities of the forex market. This indicator incorporates seven essential components to provide a well-rounded trading experience: Moving Averages Colored Zones Support and Resistance Levels
The principle of this indicator is very simple: detecting the trend with Moving Average, then monitoring the return point of graph by using the crossing of Stochastic Oscillator and finally predicting BUY and SELL signal with arrows, alerts and notifications. The parameters are fixed and automatically calculated on each time frame. Example: If you install indicator on EURUSD, timeframe M5: the indicator will detect the main trend with the Moving Average on this timeframe (for example the Moving
Moving Pivot Average    The pivot indicator compares the selected period with its counterpart from the previous period. The indicator uses very flexible algorithm for pivot value calculating. It allows you to allocate in days a certain time intervals (custom bars) and calculate the average pivot value based on High, Low and Close prices of these bars. How many custom bars will be taken into account is determined by the "Days" setting. The pivot line can be considered an average trend line and us
Trump Day
Dmitriy Kashevich
3 (2)
Trump Day Indicator for Effective Profitable Binary Options Trading complete lack of redrawing The arrow indicates the direction of the next candle and the possible trend direction. Percentage of correct indicator predictions from 80%. its benefits: signal accuracy. complete lack of redrawing. You can choose absolutely any tool. indicator will provide accurate signals. It is recommended to open trades for 2 - 3 candles. Pros indicator: 1. forward signals. 2. high accuracy of the reports.
Night ghost
Dmitriy Kashevich
Night Ghost - Arrow indicator for binary options. This is a reliable assistant to you in the future! - No redrawing on the chart -Works great on EUR/USD currency pairs! -Indicator accuracy up to 90% (Especially at night) -No long setup required (Perfectly set up for Binary Options) - Not late signals - The appearance of a signal on the current candle -Perfect for M1 period (No More!) - Eye-friendly candle color (Red and Blue) -Installed Alert Working with it: - Blue arrow shows signa
The Binary Profit Maker,  This indicator works on MT4 and is very easy to use. When you receive a signal from it, you wait for that candle with the signal to close and you enter your trade at the beginning of the next new candle . A Up Purple arrow means Buy and a Down Purple arrow means Sell. All arrows comes with Alert  like for easy identification of trade signal. Are you okay with that? How To Enter Trade? 1 minute candle 1 minute expire
ADR AWR and AMR lines
Jerome Tommy Bodden
ADR/AWR/AMR Lines Indicator - Professional Range Boundary Display Advanced Multi-Timeframe Range Analysis Tool for Professional Traders Overview The ADR/AWR/AMR Lines Indicator is a sophisticated visual analysis tool that displays dynamic range boundaries across multiple timeframes on your chart. This professional-grade indicator calculates and projects Average Daily Range (ADR), Average Weekly Range (AWR), and Average Monthly Range (AMR) boundaries, providing traders with precise entry/exit l
이 제품의 구매자들이 또한 구매함
Miraculous Indicator – Gann Square of Nine 기반 100% 비리페인트 Forex 및 바이너리 도구 이 영상은 Miraculous Indicator 를 소개합니다. 이 지표는 Forex 및 바이너리 옵션 트레이더를 위해 특별히 개발된 매우 정확하고 강력한 트레이딩 도구입니다. 이 지표가 독특한 이유는 전설적인 **Gann Square of Nine(Gann 9의 사각형)**과 **Gann's Law of Vibration(Gann 진동의 법칙)**에 기반을 두고 있기 때문입니다. 이는 현대 트레이딩에서 가장 정밀한 예측 도구 중 하나로 손꼽힙니다. Miraculous Indicator는 완전히 비리페인트(non-repaint) 됩니다. 즉, 캔들이 마감된 후에도 신호가 변경되거나 사라지지 않습니다. 보이는 것이 곧 결과입니다. 이는 트레이더가 자신감을 가지고 거래에 진입하고 청산할 수 있는 신뢰할 수 있고 일관된 기반을 제공합니다. 주요 특징: Gann
Precautions for subscribing to indicator This indicator only supports the computer version of MT4 Does not support MT5, mobile phones, tablets The indicator only shows the day's entry arrow The previous history arrow will not be displayed (Live broadcast is for demonstration) The indicator is a trading aid Is not a EA automatic trading No copy trading function The indicator only indicates the entry position No exit (target profit)  The entry stop loss point is set at 30-50 PIPS Or the front hi
PairMaster Buy Sell Arrow Indicator for MT4 Trade Reversals Like a Pro — Catch Every Swing Point with Precision The PairMaster Buy Sell Arrow Indicator is a powerful MetaTrader 4 tool built to identify high-probability swing trading opportunities . Designed for traders who value accuracy, clarity, and simplicity, PairMaster detects key market turning points and plots intuitive buy and sell arrows directly on your chart. Key Features Accurate Swing Point Detection – Automatically identifies ma
Pulse Scalping Line - an indicator for identifying potential pivot points. Based on this indicator, you can build an effective Martingale system. According to our statistics, the indicator gives a maximum of 4 erroneous pivot points in a series. On average, these are 2 pivot points. That is, the indicator shows a reversal, it is erroneous. This means that the second signal of the indicator will be highly accurate. Based on this information, you can build a trading system based on the Martingale
Bomb Bank Signal
Igor Pereira Calil
5 (1)
폭탄 은행 신호: MetaTrader 4의 신뢰도 지표 Bomb Bank Signal은 금융 시장에서 가장 관련성이 높은 추세를 식별하도록 설계된 MetaTrader 4의 강력한 지표입니다. 움직임을 정확하게 예측하는 도구를 찾고 있다면 Bomb Bank가 바로 여러분에게 필요한 동맹입니다. 작동 방식: 이 지표는 거래량 분석, 양초 종가, 대칭 추세 등 세 가지 방법을 결합하여 매수 및 매도 기회를 감지하고 신호를 보냅니다. Bomb Bank는 매수 기회를 포착할 때는 '폭탄'과 같고, 매도 신호를 감지할 때에는 '해골'과 같습니다. 폭탄 은행은 왜 다른가요? 완전한 신뢰성: 폭탄 은행 신호는 신호를 제거하지 않습니다. 일단 신호가 발행되면 그 신호는 계속 유지되므로 기회를 절대 놓치지 않습니다. 극도의 정확성: Bomb Bank는 잘못된 신호를 보내지 않습니다. 시장이 발전함에 따라 조정하면서 실시간으로 업데이트하지만 이전 신호의 투명성은 유지합니다. 실시간 업데이트:
BinaryIndicator
Andrey Spiridonov
BinaryIndicator is a highly accurate indicator for trading binary options. It shows excellent results in scalping. This indicator is based in multifactor analysis of trend indicators, as well as confirmation oscillators, which in the end gives an increased accuracy of signals. Advantages of the indicator Increased accuracy of signals. Excellent results when trading binary options with a short expiration time from M30 to M1 . It works on any timeframes. Works with any trade symbols. Parameters
Rtc ML Ai Predictor MT4
Muhammad Faisal Sagala
Rtc ML Ai | Predictor CORE MACHINE LEARNING ENGINE Adaptive ML Market Predictor – Multi-Bar Trend & Candle Forecast What This Indicator Does This indicator is a  real-time market prediction engine  designed to analyze price behavior and estimate  future market tendencies . Unlike conventional indicators, this system  does not rely on static parameters or historical curve-fitting , but adapts its internal state dynamically during live market operation. Instead of using static rules, the indic
The Hurricane Indicator
Paul Nicholas Clevett
5 (1)
Currently switched to the 4 hour chart - but use other time frames for confirmation. :-)  I change my main time frame based on the market movement at the time. The Hurricane Forex Indicator is a multi time frame indicator that includes such things as Trade Notifications, Trade Calculator, Momentum Indicator, risk reward and much more. We have a free Trade room for our users as well. Please check out the video for full details of how this indicator works as it has over 15 years worth of developme
FFx Engulfing Setup Alerter gives trade suggestions with Entry, Target 1, Target 2 and StopLoss. Below are the different options available: Entry suggestion - pips to be added over the break for the entry 3 different options to calculate the SL - by pips, by ATR multiplier or at the pattern High/Low 3 different options to calculate the 2 TPs - by pips, by ATR multiplier or at Risk/Reward Offset the dashboard - any place on the chart Remove the suggestion once the price reached the SL line Lines
FFx InsideBar Setup Alerter gives trade suggestions with Entry, Target 1, Target 2 and StopLoss. Below are the different options available: Entry suggestion - pips to be added over the break for the entry Minimum candle size - to avoid too close buy/sell entry suggestions 3 different options to calculate the SL - by pips, by ATR multiplier or at the pattern High/Low 3 different options to calculate the 2 TPs - by pips, by ATR multiplier or at Risk/Reward Offset the dashboard - any place on the c
FFx OutsideBar Setup Alerter gives trade suggestions with Entry, Target 1, Target 2 and StopLoss. Below are the different options available: Entry suggestion - pips to be added over the break for the entry. 3 different options to calculate the SL - by pips, by ATR multiplier or at the pattern High/Low. 3 different options to calculate the 2 TPs - by pips, by ATR multiplier or at Risk/Reward. Offset the dashboard - any place on the chart. Remove the suggestion once the price reached the SL line.
FFx PinBar Setup Alerter gives trade suggestions with Entry, Target 1, Target 2 and StopLoss. Below are the different options available: Entry suggestion - pips to be added over the break for the entry Minimum candle size - to avoid too small candles 3 different options to calculate the SL - by pips, by ATR multiplier or at the pattern High/Low 3 different options to calculate the 2 TPs - by pips, by ATR multiplier or at Risk/Reward Offset the dashboard - any place on the chart Remove the sugges
Lineverse Trendlines
Arkady Segal
5 (1)
Automatic, live & interactive picture of all trendlines. Assign push, email and sound alerts to the lines of your choice and be informed about price rollback, breakout, rollback after breakout, number of rollbacks, line expiration by double breakout. Correct, drag or delete the lines and interactively tune the line system. https://youtu.be/EJUo9pYiHFA . Chart examples https: //www.mql5.com/en/users/efficientforex Price Interaction Events All events are effective immediately and only after one
FFx MACD Divergences
Eric Venturi-Bloxs
The purpose of this new version of the MT4 standard indicator provided in your platform is to display in a sub-window multiple timeframes of the same indicator with its divergences. See the example shown in the picture below. But the display isn't like a simple MTF indicator. This is the real display of the indicator on its timeframe. Here's the options available in the FFx divergences indicator: Select the timeframes to be displayed (M1 to Monthly) Define the width (number of bars) for each tim
FFx RSI Divergences
Eric Venturi-Bloxs
The purpose of this new version of the MT4 standard indicator provided in your platform is to display in a sub-window multiple timeframes of the same indicator with its divergences. See the example shown in the picture below. But the display isn't like a simple MTF indicator. This is the real display of the indicator on its timeframe. Here's the options available in the FFx divergences indicator: Select the timeframes to be displayed (M1 to Monthly) Define the width (number of bars) for each tim
FFx CCI Divergences
Eric Venturi-Bloxs
The purpose of this new version of the MT4 standard indicator provided in your platform is to display in a sub-window multiple timeframes of the same indicator with its divergences. See the example shown in the picture below. But the display isn't like a simple MTF indicator. This is the real display of the indicator on its timeframe. Here's the options available in the FFx divergences indicator: Select the timeframes to be displayed (M1 to Monthly). Define the width (number of bars) for each ti
The FFx Dashboard MTF alerter will show you on a single chart all the timeframes (M1 to Monthly) with their own status for the indicator. 2 Alert Options: Single timeframe: each selected timeframe alert separately when a signal occurs Multi timeframes: all selected timeframes must agree for an alert to be triggered Both options have an input to select the timeframes to be used for the alert(s). How to Understand the Status: Green/Red square: histogram above/below 0 line Green square + Red bord
The FFx Dashboard MTF alerter will show you on a single chart all the timeframes (M1 to Monthly) with their own status for the indicator. 2 Alert Options: Single timeframe: each selected timeframe alert separately when a signal occurs Multi timeframes: all selected timeframes must agree for an alert to be triggered Both options have an input to select the timeframes to be used for the alert(s). How to understand the status: Green/Red square: RSI above/below 50 line Green square + Red border: R
The FFx Dashboard MTF alerter will show you on a single chart all the timeframes (M1 to Monthly) with their own status for the indicator. 2 Alert Options: Single timeframe: each selected timeframe alert separately when a signal occurs Multi timeframes: all selected timeframes must agree for an alert to be triggered Both options have an input to select the timeframes to be used for the alert(s). How to understand the status: Green/Red square: Stoch above/below 50 line Green square + Red border:
The FFx Dashboard MTF alerter will show you on a single chart all the timeframes (M1 to Monthly) with their own status for the indicator. 2 Alert Options: Single timeframe: each selected timeframe alert separately when a signal occurs Multi timeframes: all selected timeframes must agree for an alert to be triggered Both options have an input to select the timeframes to be used for the alert(s). How to understand the status: Green/Red square: Price above/below Cloud (Kumo) Green square + Red bo
The FFx Dashboard MTF alerter will show you on a single chart all the timeframes (M1 to Monthly) with their own status for the indicator. 2 Alert Options: Single timeframe: each selected timeframe alert separately when a signal occurs Multi timeframes: all selected timeframes must agree for an alert to be triggered Both options have an input to select the timeframes to be used for the alert(s). How to understand the status: Green/Red square: MA pointing Up/Down Green square + Red border: MA po
The FFx Dashboard MTF alerter will show you on a single chart all the timeframes (M1 to Monthly) with their own status for the indicator. 2 Alert Options: Single timeframe: each selected timeframe alert separately when a signal occurs. Multi timeframes: all selected timeframes must agree for an alert to be triggered. Both options have an input to select the timeframes to be used for the alert(s). How to understand the status: Green square: Price above PSAR Red square: Price below PSAR Options
The FFx Dashboard MTF alerter will show you on a single chart all the timeframes (M1 to Monthly) with their own status for the indicator. 2 Alert Options: Single timeframe: each selected timeframe alert separately when a signal occurs Multi timeframes: all selected timeframes must agree for an alert to be triggered Both options have an input to select the timeframes to be used for the alert(s). How to understand the status: Green/Red square: CCI above/below levels (ie. 100/-100) Grey square: C
The FFx Dashboard MTF alerter will show you on a single chart all the timeframes (M1 to Monthly) with their own status for the indicator. 2 Alert Options: Single timeframe: each selected timeframe alert separately when a signal occurs Multi timeframes: all selected timeframes must agree for an alert to be triggered Both options have an input to select the timeframes to be used for the alert(s). How to understand the status: Green/Red square: ADX above level Grey square: ADX below level Red bor
The FFx Dashboard MTF alerter will show you on a single chart all the timeframes (M1 to Monthly) with their own status. 2 Alert Options: Single timeframe: each selected timeframe alert separately when a signal occurs Multi timeframes: all selected timeframes must agree for an alert to be triggered Both options have an input to select the timeframes to be used for the alert(s). How to understand the status: Green/Red square: bullish/bearish candle Options available in the FFx Dashboard Alerter
THE GRAFF III
Antonin Skaryd
The [GRAFF] III manual trading system is based on multiple MetaTrader (MT4) indicators. Together, the entire PACK of GRAFF III indicators makes an advanced trading tool. The system consists of over 20 different custom-built indicators which have been carefully selected and tested in the long term to produce strong and efficient trading signals. The particular indicators are based on different mathematical formulas, so the entire system is calibrated to remove false signals from its own indicator
This indicator allows you to see the strength of the trend on all timeframes. It can be used for all currency pairs. The indicator can be displayed in the form of a column (from left to right): status buy / sell / strong buy / strong sell, strength of the trend in percentage, pips last candle, body candle now, remaining time, and the timeframe of M1 to MN. Information contained below (from left to right): total trend percent, sell percent, buy percent.
FFx Universal Strength Meter PRO is more than a basic strength meter. Instead of limiting the calculation to price, it can be based on any of the 19 integrated strength modes + 9 timeframes. With the FFx USM, you are able to define any period for any combination of timeframes. For example, you can set the dashboard for the last 10 candles for M15-H1-H4… Full flexibility! Very easy to interpret... It gives a great idea about which currency is weak and which is strong, so you can find the best pai
제작자의 제품 더 보기
This is  a dashboard indicator that displays the auto-calculated risk lot, with the given risk percentage & risk points (Stop Loss) and others. The main function of this indicator is to help you calculate your exact scalping risk lots and swing risk lots. Also it displays the active trades of each pair you've executed with the following: type of trade, lot size, symbol, & equity(+/-). Also displays the bar counter set in every 5-minute bar timer. (whichever time frame you're active, the bar time
필터:
리뷰 없음
리뷰 답변