Volatility Sentiment Scanner
- 지표
- 버전: 1.0
- 활성화: 10

Advanced Market Strength Dashboard – ATR, Range, Momentum, Volume, Sentiment & Trend Engine
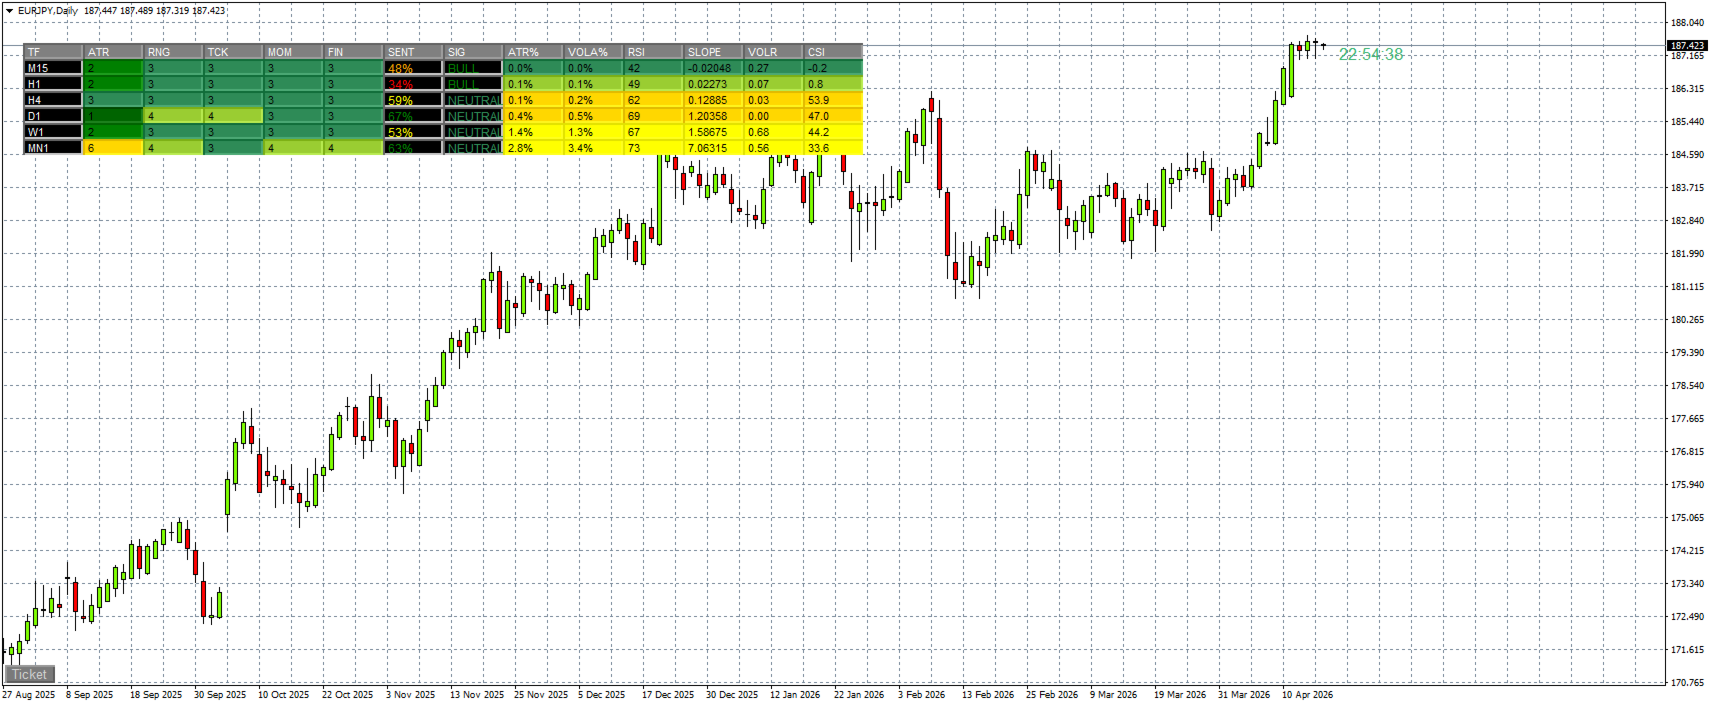
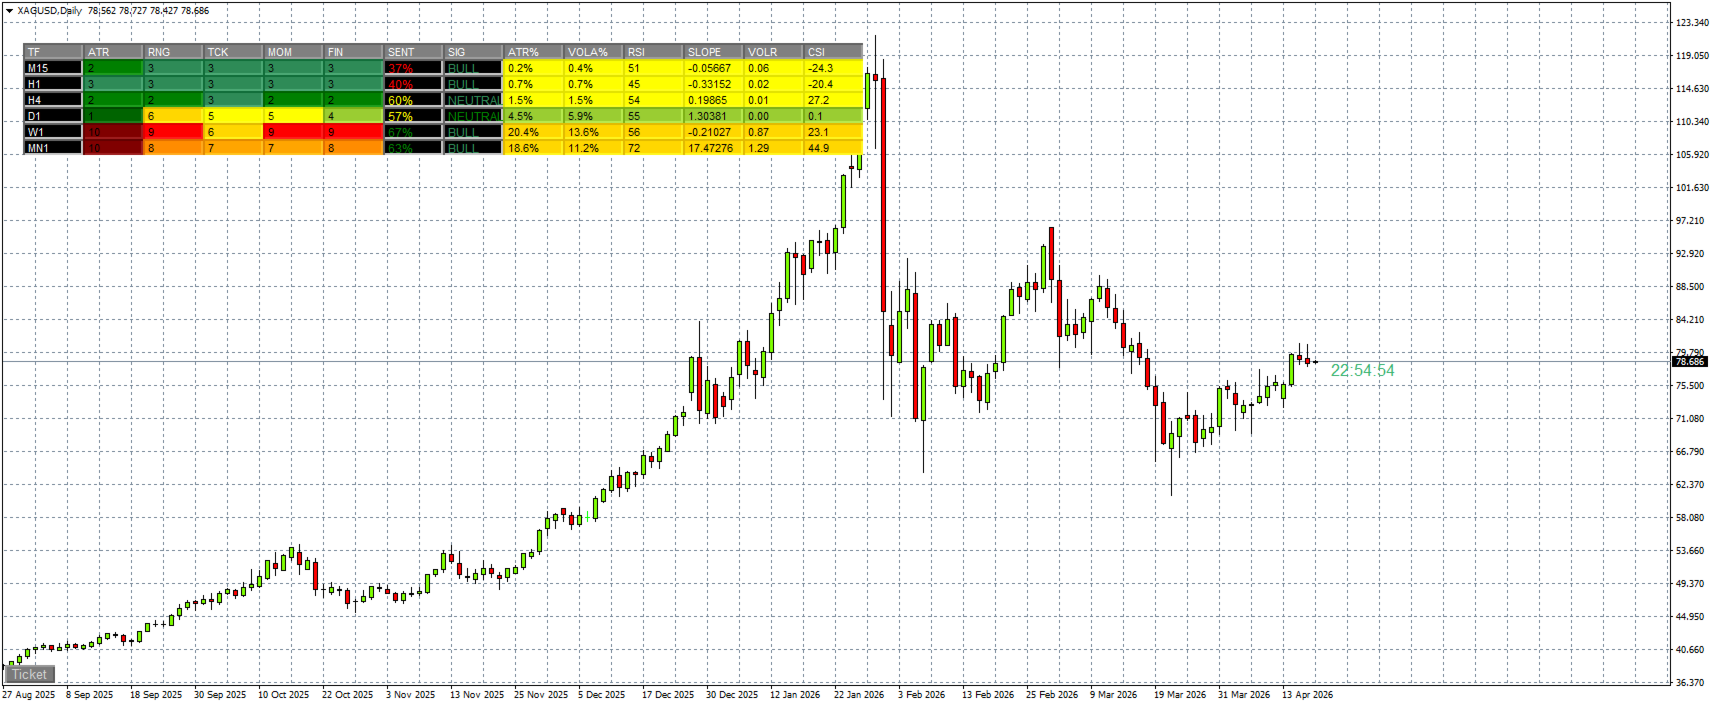
The Volatility & Sentiment Scanner is a professional multi‑timeframe market analyzer designed for traders who need fast, accurate, and actionable information. It combines volatility metrics, sentiment analysis, momentum, volume pressure, trend bias, and signal scoring into a clean, lightweight dashboard that updates in real time.
This tool gives you an instant overview of market conditions across M15, H1, H4, D1, W1, MN1, helping you identify high‑probability environments for trend continuation, reversals, breakouts, and volatility expansions.
🔥 Key Features✔ Multi‑Timeframe Dashboard (6 TFs)
Displays all important metrics in one place:
-
ATR (current vs baseline)
-
Range (current vs baseline)
-
Tick Volume (current vs baseline)
-
Momentum (current vs baseline)
-
Final Volatility Score (1–10)
-
Sentiment (% bullish vs bearish)
-
Signal (BULL / BEAR / NEUTR)
-
ATR%
-
Volatility%
-
RSI
-
Slope (EMA20 angle)
-
Volume Ratio (current vs average)
-
CSI (Candle Strength Index)
The scanner generates directional signals based on:
-
Volatility expansion/compression
-
Sentiment deviation
-
Trend bias (EMA50 vs EMA200)
-
Momentum pressure
-
Volume acceleration
-
Candle strength imbalance
Signals:
-
BULL – bullish pressure confirmed
-
BEAR – bearish pressure confirmed
-
NEUTR – no clear direction
Each signal includes a strength score (1–10).
🔥 AlertsReceive alerts only when a new signal appears:
-
Popup alert
-
Push notification
-
Email alert
-
Minimum alert interval filter
-
Fully built using OBJ_LABEL (Market‑safe)
-
No repainting
-
No lag
-
No heavy calculations
-
Works on any symbol (FX, indices, crypto, metals, stocks)
-
Detecting volatility breakouts
-
Identifying trend continuation zones
-
Spotting early reversals
-
Measuring market strength
-
Confirming entries with multi‑TF alignment
-
Filtering low‑volatility periods
-
Building rule‑based trading systems
-
ATR period
-
Average length
-
Dashboard position & size
-
Font sizes
-
Alert settings
-
MetaTrader 4
-
Works on all symbols
-
Works on all timeframes
-
No DLLs
-
Market‑safe code (OBJ_LABEL only)
Because it gives you everything you need to understand the market in 1 second:
-
Is volatility rising or falling?
-
Is sentiment bullish or bearish?
-
Is volume accelerating?
-
Is momentum strong or weak?
-
Is the trend aligned across timeframes?
-
Is the market preparing for a breakout?
This dashboard answers all of that instantly.