WhaleFinder MT4
- 지표
-
Kazuya Yamaoka
 Forex Trader & Forex Live Streamer💹I am publishing all trading steps📹Mainly, US Dollar straight🇺🇸🇪🇺🇯🇵🇬🇧🇨🇳🇦🇺🇨🇦🇨🇭🇭🇰I monetize with 9 MetaTrader original indicators based on established tactics📈I am publishing my daily income on social medias📊
 - 버전: 1.1
- 업데이트됨: 25 6월 2023
- 활성화: 5
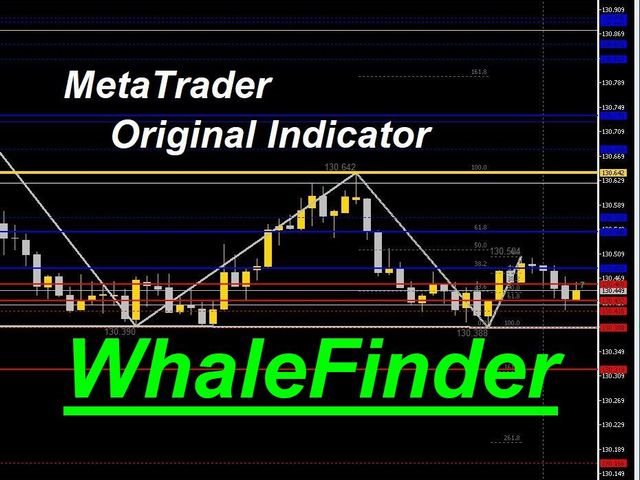
Considering the main theories of Forex (Dow Theory, support lines, chart patterns, and Fibonacci retracements),
It tells you the price range where whales (large investors) are likely to appear.
You can trade at the price points that professionals also aim for.
You no longer have to warry about where to aim next.
We are live-streaming the actual operation of the system.
Please check for yourself if it is usable.
Please check it out for yourself.
https://www.youtube.com/@ganesha_forex
We do not guarantee your investment results. Investments should be made at your own risk.
We sharll not be liable for any disadvantage or damage caused by the use of the information provided.