Channel Range Medvedev Percentage
- 지표
- 버전: 1.2
- 업데이트됨: 24 3월 2020
- 활성화: 5

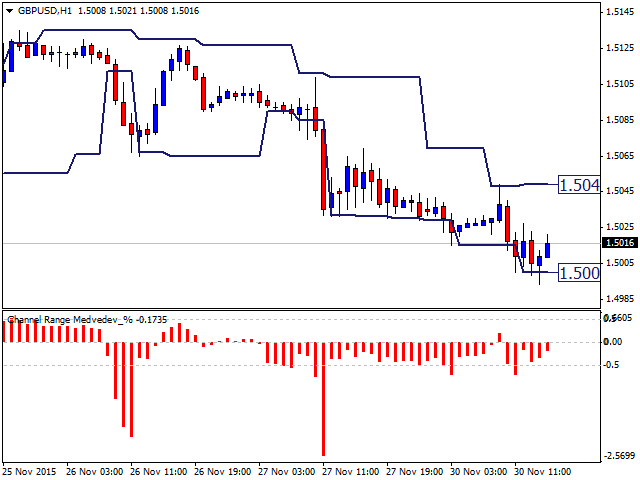
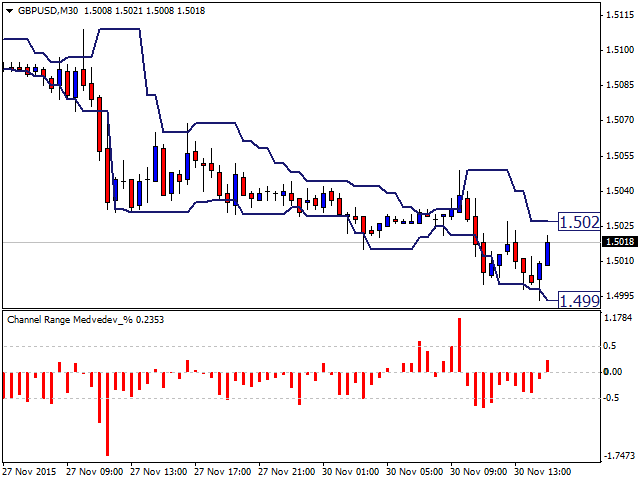
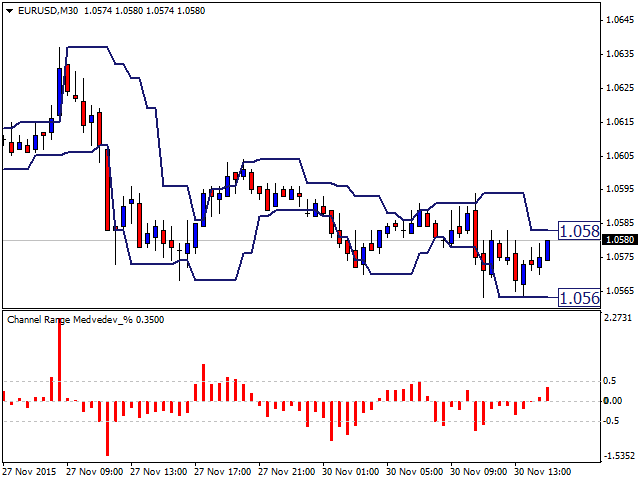
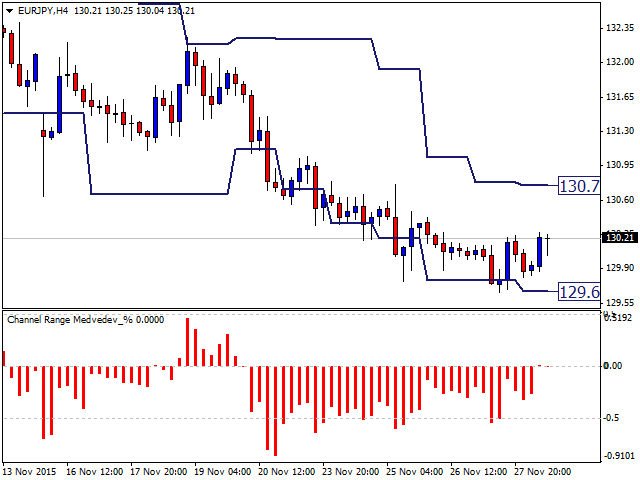
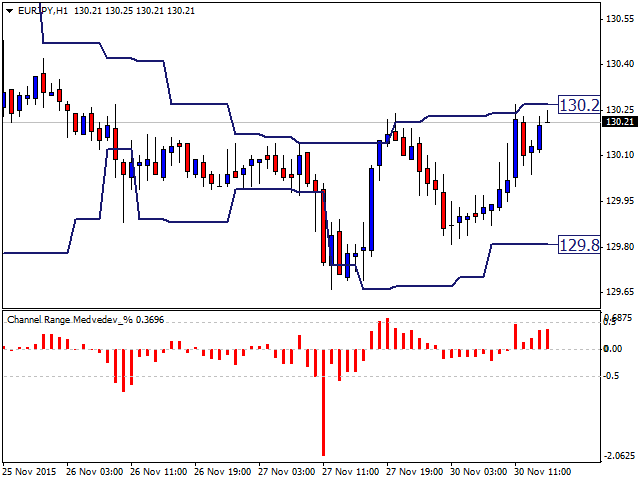
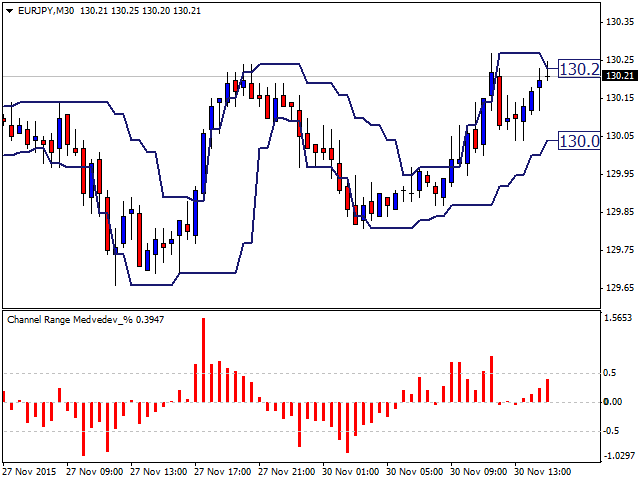
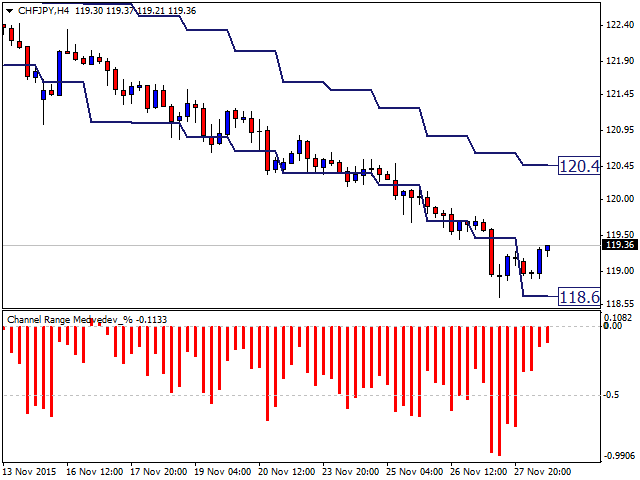
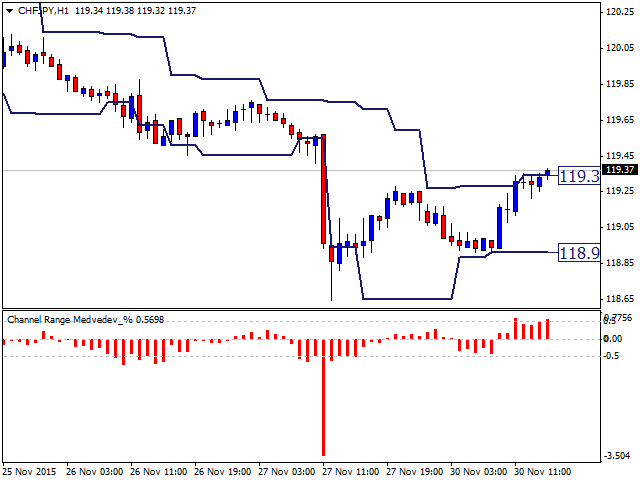
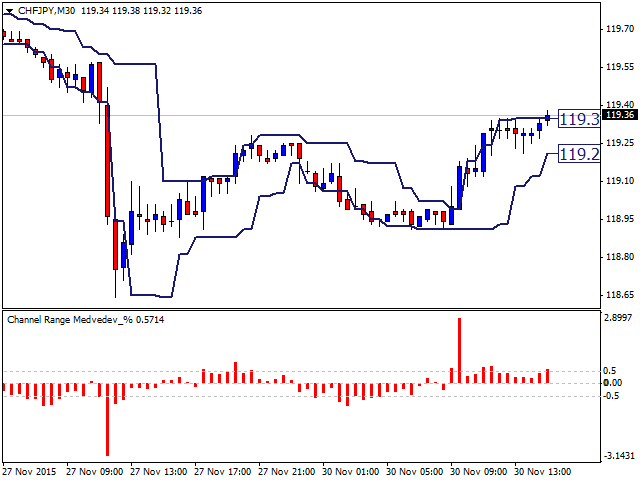
This indicator is a logical extension of the product at https://www.mql5.com/en/market/product/12526. The only difference is that price movement is displayed using a histogram with levels, allowing to assess the direction and strength of the movement. How to interpret the signal: 0 - the middle of the channel; above 0.5 - the breakdown of the channel up; below -0.5 - the breakdown of the channel down. Both indicators are displayed in the attached screenshots. Install the indicator and you will receive a bar chart.
Indicator Parameters
MinBars — the number of calculated bars. The default is 500. 0 - the entire available history range.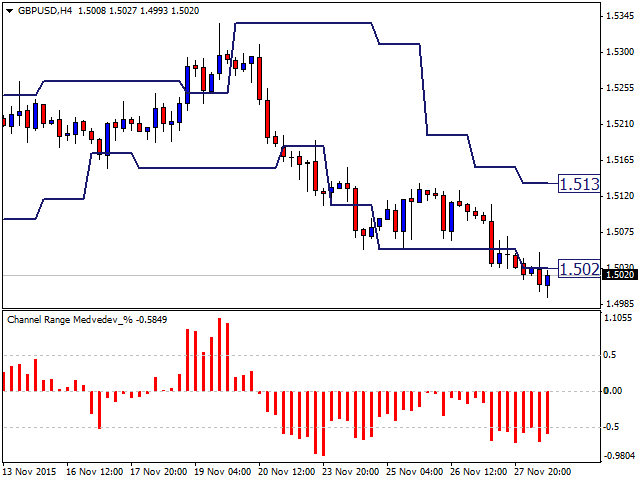


사용자가 평가에 대한 코멘트를 남기지 않았습니다