Multi Time Frame Moving Average Indicator

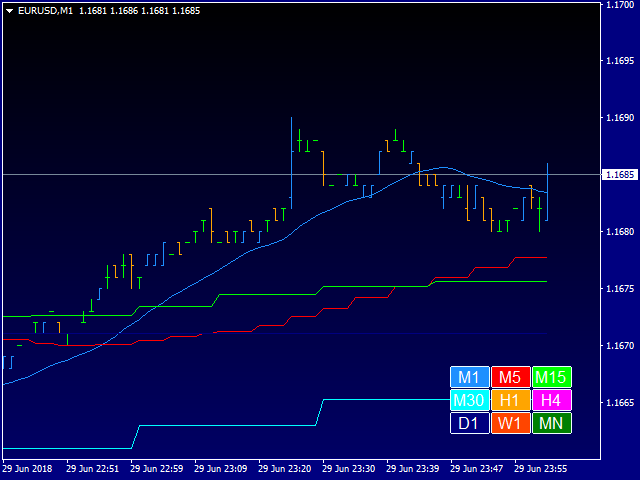
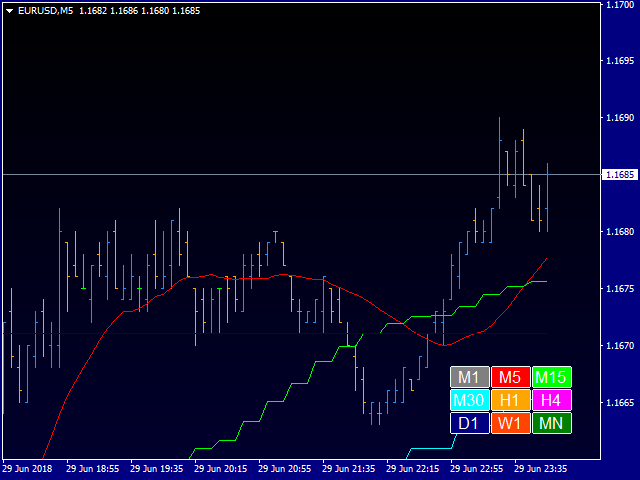
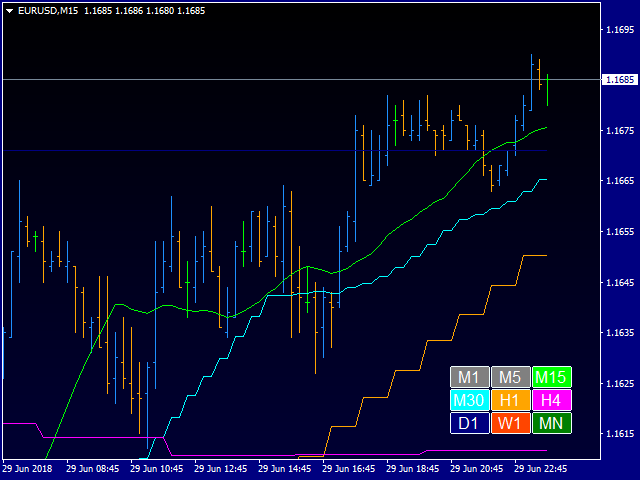
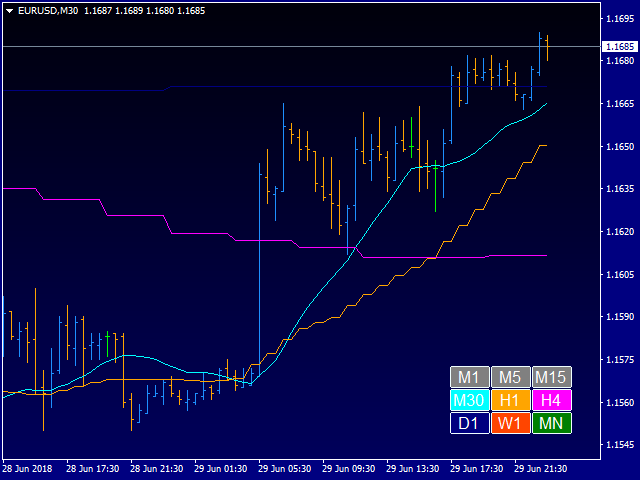
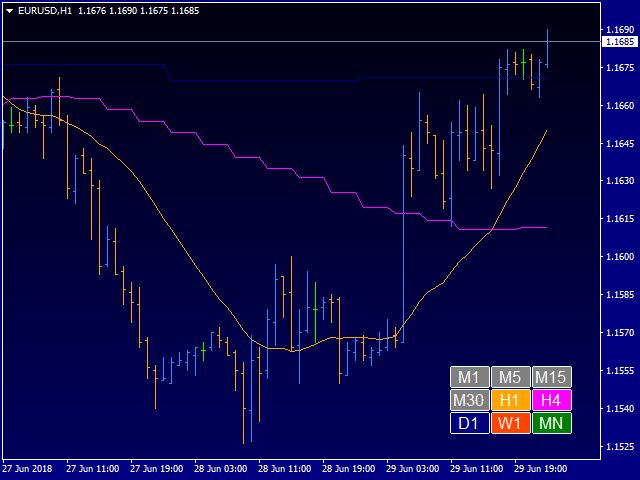
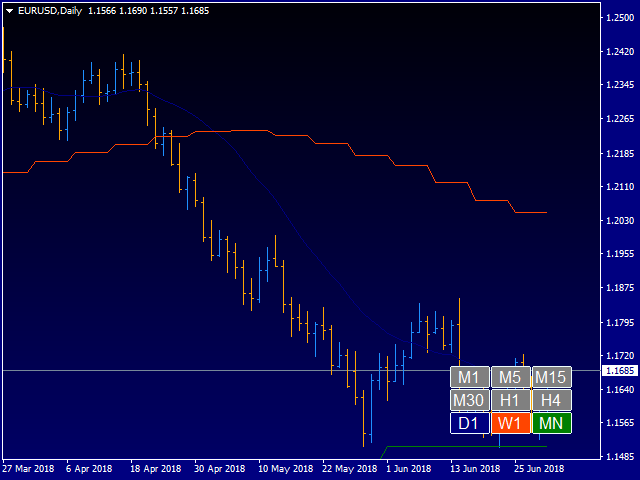
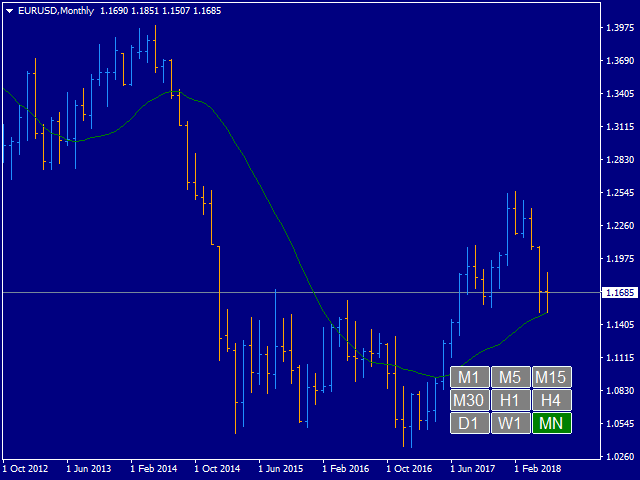
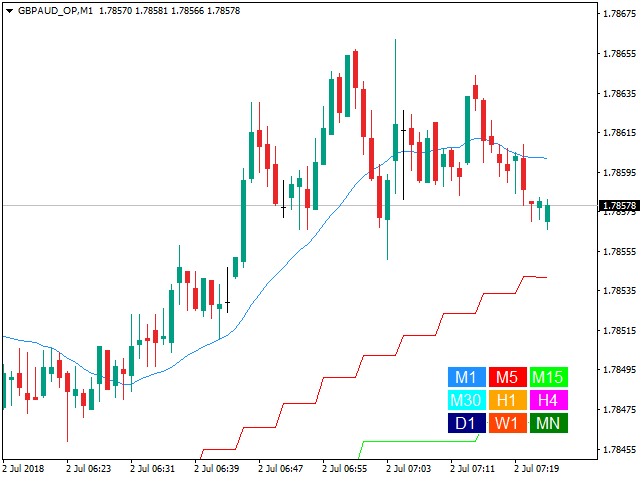
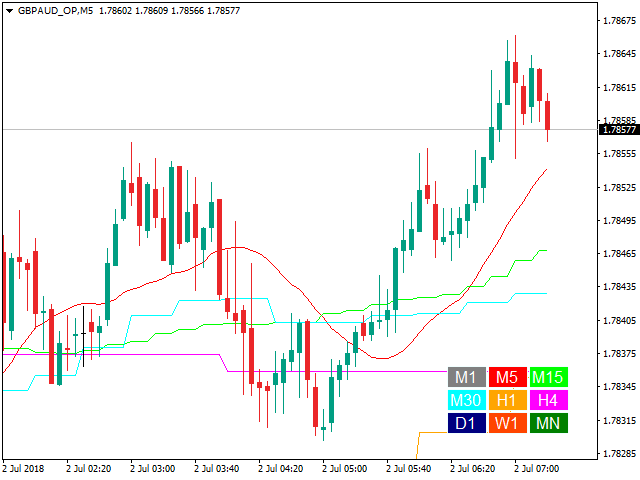
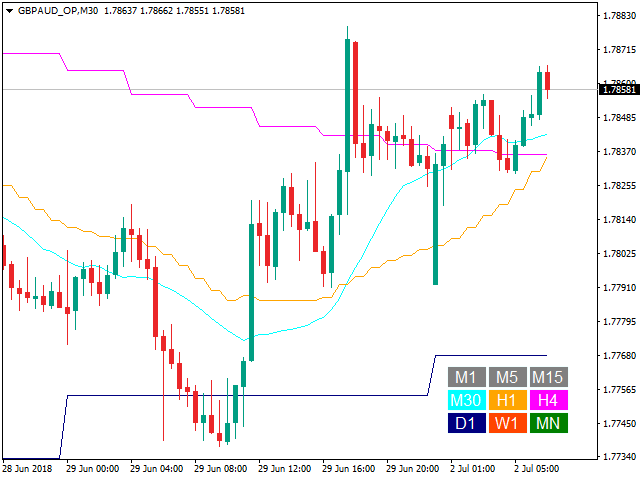
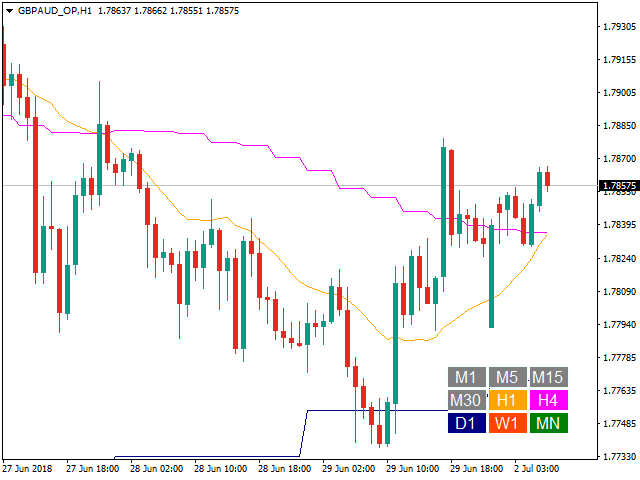
This indicator displays a set of moving average lines across all higher timeframes. The indicator can be installed on any financial instrument and any timeframe. For the analysis of the lines, a panel with timeframe values is provided in the lower right corner. Using the panel, you can easily enable/disable the display of the MA line of any higher timeframe. This allows a more thorough analysis of the market situation. The color of the button matches the color of the moving average line.


Parameters

  • "___| Settings of the main indicator "
  • Moving Average Period - default is 20;
  • Moving Average Method - simple averaging;
  • Moving Average Applied Price- default is Close price;
  • Moving average shift - default is 0;
  • "___| Color palette "
  • Text color - default is White;
  • ColorM1 - the color of the M1 timeframe line (default is DodgerBlue);
  • ColorM5 - the color of the M5 timeframe line (default is Red);
  • ColorM15 - the color of the M15 timeframe line (default is Lime);
  • ColorM30 - the color of the M30 timeframe line (default is Aqua);
  • ColorH1 - the color of the H1 timeframe line (default is Orange);
  • ColorH4 - the color of the H4 timeframe line (default is Magenta);
  • ColorD1 - the color of the D1 timeframe line (default is Navy);
  • ColorW1 - the color of the W1 timeframe line (default is OrangeRed);
  • ColorMN - the color of the MN timeframe line (default is Green);

Specify the MA calculation period and its parameters, and the indicator will show you MA on all higher periods. Alternatively, you can set the display of MA of required timeframes.

추천 제품
ForexGumpUltra
Andrey Kozak
3.25 (4)
ForexGumpUltra is a new and more advanced indicator of the ForexGump series. This indicator easily determines the price direction on any currency pair and any timeframe. The indicator draws its signals on the zero bar and does not redraw them (see the video). In the 34th second of the video it can be seen that this indicator uses new filters to determine the changes in price movement direction without delay, despite the market noise present at the moment (see the video on the 34th second). Once
스토캐스틱 멀티커런시 스캐너 대시보드 MT4 는 스토캐스틱 오실레이터를 사용하여 여러 통화 쌍과 시간 프레임을 모니터링하도록 설계된 강력한 도구입니다. 심볼과 시간 프레임(M1에서 MN1까지)을 기준으로 신호를 정리하는 그리드 형식으로 제공됩니다. 트레이더는 전략에 맞게 특정 시간 프레임을 활성화하거나 비활성화할 수 있습니다. MT5 버전은 여기에서 확인할 수 있습니다: Stochastic Oscillator Multicurrency Scanner MT5 자세한 문서는 여기에서 클릭하세요: 문서 이 도구는 다음 스토캐스틱 전략을 기반으로 신호를 표시합니다: 과매수/과매도 전략: 스토캐스틱이 과매수(상위 레벨 초과) 또는 과매도(하위 레벨 미만) 구역에 진입하거나 벗어날 때 신호가 생성되어 잠재적인 반전을 나타냅니다. 역레벨 전략: 스토캐스틱이 사용자 정의 또는 자동 계산된 상위 또는 하위 레벨을 역방향으로 교차할 때 신호가 트리거되어 모멘텀의 변화를 시사합니다. 크로스오버 전략: 스
Range Dashboard
DIMITAR ILCHEV
A trading range takes place when a financial instrument (stocks, indices, bonds, commodities, Forex currencies or cryptocurrencies) oscillates between two upwards and downwards boundaries for a period of time. This Indicator tool help us to view range on the chart bar per bars, also set range in percent and get clean posicion.  Range trading works best in the absence of a trend. When the markets lack a clear direction, that’s when these consolidation periods settle in. Alternatively, more exper
The Arrow Scalper
Fawwaz Abdulmantaser Salim Albaker
1 (2)
Dear Friend..  I share with you this simple Expert Adviser .. it is full automatic  this Expert Adviser following the trend of the pair you install on or any stocks or indices , it is works like that: - when the trend on H4 chart show a start of up trend the expert will wait till the 15M & 1H charts show an up trend the EA will open a buy order directly , and do the same for down trend and open a sell order the buy or sell  order lot size and take profit and stop loss will measured manually  by
FREE
BB & RSI Candle Color: Technical Analysis Indicator on MetaTrader 4 The "BB & RSI Candle Color" indicator is a powerful technical analysis tool designed for MetaTrader 4 traders looking for an effective visual representation of market conditions. Created by 13 Crow Trading Club, this indicator combines the popular Bollinger Bands and the Relative Strength Indicator (RSI) to provide clear and accurate visual signals. This indicator offers three key aspects: Candle Color: Normal candles are displa
FREE
The indicator sends messages to e-mail and mobile terminal when the price approaches the horizontal levels and trend lines that are drawn using the handy panel! The levels and trend lines are deleted and placed to the chart using one click on the panel, and they can be dragged on the chart by mouse! It is possible to set the interval between messages in the settings, the interval is applied to each object separately! Indicator Settings ===*** Main settings ***=== - below is the list of the main
Elite Ranger
Amirhossein Heydarijokani
마틴게일 무함유 안티 마틴게일 무함유 그리드 없음 HFT 없음 더블링 없음 모든 포지션에는 손절매가 있습니다. 이 EA에 대한 권장 사항 EURCHF 를 강력히 추천하지만 EURJPY 및 EURCAD 통화 쌍도 좋은 결과를 얻을 수 있습니다. EURCHF의 경우   M30을 사용하는 것이 좋지만 M5, M15, H1도 좋은 기간입니다. EA는 양호한   ECN   계정에서 실행되어야 합니다. 평균 스어세이브 는   10점을   넘지 않아야 합니다. Zero   Stop-Level 이 가장 잘 작동합니다. 위험도가 높은 갑작스런   슬리피지가   있는 브로커에게는 이 EA를 사용하지 마십시오. EURCHF에 평균 스프레드 10포인트, 낮은 랏당 수수료, 낮은 슬리피지, 제로 스톱 레벨 및 스왑 프리 옵션이 있는   Alpari Pro-ECN   계정에서 EA를 사용하는 것이 좋습니다. 파라미터 오버view 기본 설정은 EURCHF(Alpari 브로커)에 대해 테스트 및 최적화되었습
Double HMA lines MTF
Pavel Zamoshnikov
5 (1)
This is a multi-timeframe version of the popular Hull Moving Average (HMA). The Double HMA MTF Light indicator combines two timeframes on a single chart. The HMA of the higher timeframe defines the trend, and the HMA of the current timeframe defines short-term price movements. The indicator is freely distributed and hasn't audio signals or messages. Its main function is the visualization of price movements. If you need advanced functionality of the HMA multi-timeframe indicator (information ab
FREE
Rebate gnome
Vasilii Konovalov
Rebate robot. The money on the deposit rotates around zero, while a lot of transactions are made and the rebate is stuffed.It does not load the deposit, there is a stop loss and take profit.It is necessary to bet on several instruments at once, pairs can be any, but it is recommended to bet on those in which the trend is clearly traced on the daily chart. With prolonged reversals, the robot loses, but it happens very slowly and relatively safely, so it is recommended to track the trend at least
Ticks Momentum 4
Andrej Nikitin
The Momentum indicator drawn using a tick chart. After launching it, wait for enough ticks to come. Parameters: period - period of the indicator calculation. levels count - number of displayed levels (no levels are displayed if set to 0) calculated bar - number of bars for the indicator calculation.
Sensitive Signal
Aleksey Ivanov
5 (2)
The Sensitive Signal ( SS ) indicator, using the filtering methods  (which includes cluster multicurrency analysis) developed by the author, allows, with a high degree of probability, to establish the beginning of the true (filtered from interference - random price walks) trend movement. It is clear that such an indicator is very effective for trading on the currency exchange , where signals are highly distorted by random noise. The filtration developed by the author is carried out
The three white soldiers candlestick pattern is a bullish reversal pattern typically observed in candlestick charting. It consists of three consecutive long-bodied candlesticks formed after a downtrend, signaling a potential shift in market sentiment from bearish to bullish. Here's a detailed description of the pattern: 1. **First Candlestick:**    - The first candlestick in the pattern is usually formed during a downtrend and has a long white (or green) body.    - The long body indicates stro
FREE
Trend StarteR
Abdulkarim Karazon
Trend StarteR은 화살표 형태로 상승 및 하락 추세 신호를 제공하는 다중 RSI 기반 지표입니다. 이 지표는 가능한 추세를 예측하고 거래자가 이러한 추세를 거래하는 데 참여할 수 있도록 돕기 위해 만들어졌습니다. 이 표시기는 후면 페인트를 다시 칠하지 않으며 이 표시기 신호는 지연되지 않습니다. ================= 권장 사항: 스프레드가 낮은 브로커, 어느 시간대에나 가능하지만 스프레드를 극복하려면 M5 이상을 고수하는 것이 좋습니다. ================================== 매개변수: 첫 번째, 두 번째, 세 번째 RSI 기간 교차가 발생할 때 신호가 인쇄되는 위아래 레벨 알림 설정: 모바일 알림, 소리 알림, mt4 메시지 ================================================= ================
Transition Trend
Tatiana Savkevych
The Transition Trend indicator shows the points of potential market reversal. The indicator's smart algorithm detects the trend, filters out market noise and generates entry signals and exit levels. Simple, visual and efficient trend detection. Uses just one parameter for settings. The indicator does not redraw and does not lag. You can set up message alerts as sound or email. Works on all currency pairs and all timeframes. Ready-made trading system.
Clever RSI
Carlos Forero
Description Better version of RSI indicator which offer a complete visual trading strategy and realize an auto-optimization Support:   We create great tools for the entire trading community. Most of them are free. If you believe in what we do  Support Us Here.   KEY LINKS:   How to Install  –  Frequent Questions  -  All Products  How is this indicator useful? NEVER repaints. Detect best parameters of RSI indicator, based on profit factor during the specified period. This indicator can be used as
CCI and ATR Trader
Evgeniia Terekhova
2.33 (3)
Советник работает на двух индикаторах CCI и ADX. Условия для входа в BUY: 1. ADX пересекает уровень 20 2. CCI пересекает уровень 100 снизу вверх 3. Выставляем фиксированный StopLoss и TakeProfit 4. Закрываем позицию по рыночной цене, когда CCI пересекает уровень 100 сверху вниз. Условия для входа в SELL: 1. ADX пересекает уровень 20 2. CCI пересекает уровень -100 сверху вниз 3. Выставляем фиксированный StopLoss и TakeProfit 4. Закрываем позицию по рыночной цене, когда CCI пересекает уровень -10
FREE
SniperPro
Aleksandr Skorikov
The SniperPro(XAU-USD) trading indicator has performed well for 15 days on XAU USD.....When trading on this indicator, the order sometimes goes into a drawdown.....The indicator does not redraw!!!!!! The indicator works on time intervals M1-D1....He performed well during the release of economic news… We attach the indicator to the XAU – USD M5 chart with standard settings without changing anything.....
This Indicator is based on Fibonacci levels and draws Buy & Sell Areas. Buy areas are defined in green color (light green & dark green) while Sell areas are defined in red color (light red pink and darker color) Rectangles to easily know that whether price is in buy area or sell area. If price is in gray area, wait for price to come in to your desired area. You can use on any Forex Pairs. This indicator calculates on the basis of h4 timeframe no matter what time frame you have selected, its calc
SAAD TrendTracker
Adnan Iqbal
4.03 (34)
SAAD TrendTracker is a fully automated EA. It is based on mathematical algorithms Trend Tracker indicator and SAADScalper. The EA scalps pips by its strong Entry strategy based on SAADScalper. Trades that are not successful to scalp are handled in a different way of uniquely designed algorithm based on Trend Tracker indicator. EA is designed for M1, M5, M15 and M30. It consults daily chart for successful trading accuracy. It consults H1 to handle unsuccessful trades using Trend Tracker Indicator
FREE
Macd Martin
Roman Yablonskiy
2.5 (2)
Double Breakout   is an automatic expert advisor with two separate strateges that uses martingale. The MACD indicator with adjustable parameters is used as inputs for each flow of orders. The specified takeprofit and stoploss levels are used to exit the position.  General recommendation The minimum recommended deposit is 1000 cents. Spread is recommended not more than 3 points. It is better to use trend currency pairs. The martingale parameter can be set from 0.1 to any value. When martingale i
FREE
MetaForecast M4
Vahidreza Heidar Gholami
5 (2)
MetaForecast는 가격 데이터의 조화를 기반으로 모든 시장의 미래를 예측하고 시각화합니다. 시장이 항상 예측 가능한 것은 아니지만 가격에 패턴이 있다면 MetaForecast는 가능한 정확하게 미래를 예측할 수 있습니다. 다른 유사한 제품과 비교했을 때, MetaForecast는 시장 동향을 분석하여 더 정확한 결과를 생성할 수 있습니다. 입력 매개변수 Past size (과거 크기) MetaForecast가 미래 예측을 생성하기 위한 모델을 만드는 데 사용하는 막대의 수를 지정합니다. 모델은 선택한 막대 위에 그려진 노란색 선으로 표시됩니다. Future size (미래 크기) 예측해야 할 미래 막대의 수를 지정합니다. 예측된 미래는 핑크색 선으로 표시되며 그 위에 파란색 회귀선이 그려집니다. Degree (차수) 이 입력은 MetaForecast가 시장에서 수행할 분석 수준을 결정합니다. Degree 설명  0 차수 0의 경우, "Past size" 입력에 모든 봉우리와
Skan
Niravkumar Maganbhai Patel
4.75 (4)
SKAN   This indicator helps you to scan all symbols which are in the Market Watch window and filter out a trend with alerts. It works on five most effective indicators which are used by most of traders for trading: Moving Average Super Trend (ST) Bolinger Band (BB) OPRC BFD It calculates two bars for scanning. When box colour changes to coral or royal blue colour, it indicates you for trend change for long and short entry. And also you will get alert on screen. When it changes to royal blue, it
FREE
Asteroid
Evgeniy Zhdan
The basis of the work of the adviser is to use the change in trend strength to determine the optimal entry points to the market. The logic of the advisor’s work combines two strategies: control of price consolidation and its “explosion” and control of the trend end to work in the channel. The EA does NOT use dangerous trading methods. Each trade has a stop loss and take profit. Recommended trading tools (5m): EURUSD, GBPUSD, USDJPY, USDCAD. Settings: MaxRisk - Value for calculating the tradi
NIGHTCrusher Lite FREE
Christian Opperskalski
4.5 (2)
NIGHTCRUSHER is a fully automated expert advisor, designed for scalping on quite market situation. The Lite - Version is limited to minimal Lot per Pair and dont has lot mulitplier and dynamic function you can also run different strategies like swing trading or grid different Trade Entry Signals different Exit Strategies included (MA Cut / Signal Change / Trailing TP) clever Risk & Money management - Balance based - Longrun trades tracking You can also use a Grid function or Lot multipier, if ne
FREE
Pin Bars
Yury Emeliyanov
5 (4)
주요 목적:"핀 바"는 금융 시장 차트에서 핀 바를 자동으로 감지하도록 설계되었습니다. 핀 바는 특징적인 몸체와 긴 꼬리를 가진 촛불로,추세 반전 또는 교정을 신호 할 수 있습니다. 작동 원리:표시기는 차트의 각 촛불을 분석하여 촛불의 몸,꼬리 및 코의 크기를 결정합니다. 미리 정의 된 매개 변수에 해당하는 핀 막대가 감지되면 표시기는 핀 막대의 방향(강세 또는 약세)에 따라 위 또는 아래 화살표로 차트에 표시합니다. 매개 변수: 꼬리의 길이와 핀 바의 몸체 크기 사이의 최소 비율을 정의합니다. "코"와 핀 바의 꼬리 사이의 최대 허용 비율을 설정합니다. 화살표 크기-표시된 핀 막대와 차트에서 핀 막대를 가리키는 화살표 사이의 거리를 정의합니다. 신청:"핀 바"표시기는 잠재적 인 추세 반전 지점을 식별하고 시장 또는 가까운 위치에 진입하기 위해 신호를 생성하는 데 사용할 수 있습니다. 올바르게 사용하고 다른 기술 지표 및 분석 방법과 결합하면이 지표는 거래 결과를 향상시킬 수
FREE
Candlestick Patterns Scanner MT4
KEENBASE SOFTWARE SOLUTIONS
KT Candlestick Patterns Scanner is a Multi-Symbol and Multi-Timeframe scanner that fetches and shows various candlestick patterns on 28 currency pairs and 9 time-frames concurrently . The scanner finds the candlestick patterns by loading the KT Candlestick Patterns indicator as a resource in the background. Features The scanner can find the candlestick patterns on 252* combinations of symbols and time-frames from a single chart. Open the signal's chart loaded with a predefined template with a s
| Fully-automated Smart Money Concept (ICT) inspired trading solution with multi-strategy capabilities | Built by a grid trader >> for grid traders.  This is MT4 version, click  here  for  Blue CARA MT5  (settings and logics are same in both versions)     Real monitoring signal  -->  Cara Gold Intro Blue CARA EA   ('CARA') - short for  C omprehensive  A lgorithmic R esponsive A dvisor is a next-gen  multi-currency    multi-timeframe  EA base on the widely known (and perhapse most popular) Inn
Free automatic fibonacci
Tonny Obare
4.67 (49)
Free automatic Fibonacci is an indicator that automatically plots a Fibonacci retracement based on the number of bars you select on the BarsToScan setting in the indicator. The Fibonacci is automatically updated in real time as new highest and lowest values appears amongst the selected bars. You can select which level values to be displayed in the indicator settings. You can also select the color of the levels thus enabling the trader to be able to attach the indicator several times with differe
FREE
Hello all The expert works by hanging pending deals moving with the price when activating a transaction It closes on the stop loss or on a profit from the pursuit of profit Work on low spread currency pairs Like dollar yen currency The work is done with the same settings as the expert, or it can be modified as the user likes Work on a timing of 15M or more as the user likes parameters: Transaction_Movement : Movement =true  . no Movement=false . Lot1: Manual Lot Size Auto_Lot: Set true to auto
이 제품의 구매자들이 또한 구매함
Gann Made Easy
Oleg Rodin
4.83 (155)
Gann Made Easy 는 mr.의 이론을 사용하여 최고의 거래 원칙을 기반으로 하는 전문적이고 사용하기 쉬운 Forex 거래 시스템입니다. W.D. 간. 이 표시기는 Stop Loss 및 Take Profit Levels를 포함하여 정확한 BUY 및 SELL 신호를 제공합니다. PUSH 알림을 사용하여 이동 중에도 거래할 수 있습니다. 거래 팁, 보너스, GANN MADE EA를 무료로 받으시려면 구매 후 저에게 연락주세요! 아마도 Gann 거래 방법에 대해 이미 여러 번 들었을 것입니다. 일반적으로 Gann의 이론은 초보자 거래자뿐만 아니라 이미 거래 경험이 있는 사람들에게도 매우 복잡한 것입니다. Gann의 거래 방식은 이론적으로 적용하기 쉽지 않기 때문입니다. 나는 그 지식을 연마하고 Forex 지표에 최고의 원칙을 적용하기 위해 몇 년을 보냈습니다. 표시기는 적용하기가 매우 쉽습니다. 차트에 첨부하고 간단한 거래 권장 사항을 따르기만 하면 됩니다. 지표는 지속적으로 시장
Game Changer Indicator
Vasiliy Strukov
4.75 (16)
Game Changer는 모든 금융 상품에 적용 가능한 혁신적인 추세 지표로, MetaTrader를 강력한 추세 분석 도구로 탈바꿈시켜 줍니다. 모든 시간대에서 작동하며 추세 식별, 잠재적 반전 신호 제공, 트레일링 스톱 기능, 그리고 신속한 시장 대응을 위한 실시간 알림 기능을 제공합니다. 숙련된 전문가든 이제 막 시작하는 초보자든, Game Changer는 추세의 역학을 명확하게 이해하고 자신감 있고 규율 있는 거래를 할 수 있도록 도와줍니다. 이 지표는 차트 재구성 기능을 지원합니다. 구매 후 즉시 연락 주시면 특별 보너스를 드립니다. Strong Support 및 Trend Scanner 지표를 무료로 제공해 드립니다. [email protected]으로 메시지를 보내주세요. 참고로, 저는 텔레그램에서 EA나 특별 세트를 판매하지 않습니다. 모든 EA는 MQL5에서만 사용 가능하며, 세트 파일은 제 블로그(여기)에서만 다운로드하실 수 있습니다. 사기꾼을 조심하시고 다른 사
GOLD Impulse with Alert
Bernhard Schweigert
4.64 (11)
이 지표는 Advanced Currency IMPULSE with ALERT  +   Currency Strength Exotics  의 2가지 제품의 슈퍼 조합입니다. 그것은 모든 시간 프레임에 대해 작동하며 8개의 주요 통화와 하나의 기호에 대한 강약의 충동을 그래픽으로 보여줍니다! 이 표시기는 금, 이국적인 쌍, 상품, 지수 또는 선물과 같은 기호에 대한 통화 강도 가속을 표시하는 데 특화되어 있습니다. 금, 은, 오일, DAX, US30, MXN, TRY, CNH 등의 진정한 통화 강도 가속(충동 또는 속도)을 표시하기 위해 9번째 줄에 모든 기호를 추가할 수 있습니다. 새로운 기본 알고리즘을 기반으로 구축되어 잠재적인 거래를 훨씬 더 쉽게 식별하고 확인할 수 있습니다. 이는 통화의 강세 또는 약세가 가속되는지 여부를 그래픽으로 표시하고 가속 속도를 측정하기 때문입니다. 자동차의 속도계처럼 생각하면 됩니다. 가속화할 때 Forex 시장에서 동일한 일이 분명히 더 빠르
Scalper Inside PRO
Alexey Minkov
4.74 (69)
An exclusive indicator that utilizes an innovative algorithm to swiftly and accurately determine the market trend. The indicator automatically calculates opening, closing, and profit levels, providing detailed trading statistics. With these features, you can choose the most appropriate trading instrument for the current market conditions. Additionally, you can easily integrate your own arrow indicators into Scalper Inside Pro to quickly evaluate their statistics and profitability. Scalper Inside
Trend Lines PRO
Roman Podpora
5 (1)
트렌드 라인즈 프로       이 지표는 시장이 실제로 어떤 방향으로 전환되는지 파악하는 데 도움이 됩니다. 실제 추세 반전 지점과 주요 시장 참여자들이 다시 진입하는 지점을 보여줍니다. 보시다시피       BOS 라인       복잡한 설정이나 불필요한 노이즈 없이 더 높은 시간대의 추세 변화와 주요 레벨을 확인할 수 있습니다. 신호는 차트에 다시 그려지지 않고 캔들이 마감된 후에도 계속 표시됩니다. VERSION MT 5   -   RFI LEVELS PRO   표시기   와 결합할 때 최대 잠재력을 발휘합니다. 지표가 보여주는 내용: 실제 변화       추세(BOS 라인) 한 번 신호가 나타나면 그 신호는 계속 유효합니다! 이는 신호를 발생시킨 후 변경될 수 있는 리페인팅 방식의 지표와 중요한 차이점입니다. 리페인팅 방식의 지표는 잠재적으로 자금 손실로 이어질 수 있습니다. 이제 더욱 높은 확률과 정확도로 시장에 진입할 수 있습니다. 또한 화살표가 나타난 후 목표가(익절)
Miraculous Indicator – Gann Square of Nine 기반 100% 비리페인트 Forex 및 바이너리 도구 이 영상은 Miraculous Indicator 를 소개합니다. 이 지표는 Forex 및 바이너리 옵션 트레이더를 위해 특별히 개발된 매우 정확하고 강력한 트레이딩 도구입니다. 이 지표가 독특한 이유는 전설적인 **Gann Square of Nine(Gann 9의 사각형)**과 **Gann's Law of Vibration(Gann 진동의 법칙)**에 기반을 두고 있기 때문입니다. 이는 현대 트레이딩에서 가장 정밀한 예측 도구 중 하나로 손꼽힙니다. Miraculous Indicator는 완전히 비리페인트(non-repaint) 됩니다. 즉, 캔들이 마감된 후에도 신호가 변경되거나 사라지지 않습니다. 보이는 것이 곧 결과입니다. 이는 트레이더가 자신감을 가지고 거래에 진입하고 청산할 수 있는 신뢰할 수 있고 일관된 기반을 제공합니다. 주요 특징: Gann
Dynamic Forex28 Navigator
Bernhard Schweigert
4.43 (7)
Dynamic Forex28 Navigator - 차세대 외환 거래 도구. 현재 49% 할인. Dynamic Forex28 Navigator는 오랫동안 인기 있는 지표의 진화형으로, 세 가지의 힘을 하나로 결합했습니다. 고급 통화 Strength28 지표(695개 리뷰) + 고급 통화 IMPULSE with ALERT(520개 리뷰) + CS28 콤보 신호(보너스). 지표에 대한 자세한 정보 https://www.mql5.com/en/blogs/post/758844 차세대 Strength 지표는 무엇을 제공합니까?  원래 지표에서 좋아했던 모든 것이 새로운 기능과 더 높은 정확도로 강화되었습니다. 주요 기능: 독점적인 통화 Strength 공식.  모든 시간대에 걸쳐 부드럽고 정확한 강도선. 추세와 정확한 진입을 식별하는 데 이상적입니다. 역동적인 시장 피보나치 수준(시장 피보나치).  이 지표에만 있는 고유한 기능. 가격 차트가 아닌 통화 강도에 피보나치가 적용됩니다.
RFI levels PRO
Roman Podpora
5 (1)
이 지표는 추세 반전 지점과 가격 반등 영역을 정확하게 보여줍니다.       주요 투자자들   . 새로운 트렌드가 형성되는 곳을 파악하고 최대한 정확하게 의사결정을 내리며 모든 거래를 완벽하게 통제합니다. TREND LINES PRO   지표와 함께 사용할 때 최대의 잠재력을 발휘합니다.  VERSION MT5 지표가 보여주는 내용: 새로운 추세의 시작 시 활성화되는 반전 구조 및 반전 수준. 최소한의 위험 대비 수익률을 갖는 이익 실현   (TAKE PROFIT)   및   손절매(STOP LOSS)   레벨 표시       RR 1:2   . 지능형 손실 감소 로직이 적용된 손절매 기능. 지정된 지표에서 두 가지 추세 유형에 대한 반전 패턴을 표시합니다. 지표: 트렌드를 따라   트렌드 라인 프로   (글로벌 트렌드 변화) 트렌드 프로   (빠른 트렌드 변화) 간단하고 효과적입니다       스캐너       실시간 추세 (신규). 다중 시간 프레임 도구 필터링. 표시하다  
M1 Sniper
Oleg Rodin
5 (19)
M1 SNIPER 는 사용하기 쉬운 거래 지표 시스템입니다. M1 시간대에 맞춰 설계된 화살표 지표입니다. 이 지표는 M1 시간대 스캘핑을 위한 단독 시스템으로 사용할 수 있으며, 기존 거래 시스템의 일부로도 사용할 수 있습니다. 이 거래 시스템은 M1 시간대 거래용으로 특별히 설계되었지만, 다른 시간대에도 사용할 수 있습니다. 원래는 XAUUSD와 BTCUSD 거래를 위해 이 방법을 설계했지만, 다른 시장 거래에도 유용하다는 것을 알게 되었습니다. 이 지표의 신호는 추세 방향과 반대로 거래될 수 있습니다. 저는 지표의 신호를 활용하여 양방향으로 거래할 수 있도록 돕는 특별한 거래 기법을 알려드립니다. 이 방법은 특별한 동적 지지선과 저항선 가격 영역을 활용하는 것을 기반으로 합니다. 구매하시면 M1 SNIPER 화살표 지표를 바로 다운로드하실 수 있습니다. 또한, 아래 스크린샷에 표시된 Apollo Dynamic SR 지표는 M1 SNIPER 도구를 사용하는 모든 사용자에게 무료로
Currency Strength Wizard
Oleg Rodin
4.84 (57)
통화 강도 마법사는 성공적인 거래를 위한 올인원 솔루션을 제공하는 매우 강력한 지표입니다. 표시기는 여러 시간 프레임의 모든 통화 데이터를 사용하여 이 또는 해당 외환 쌍의 힘을 계산합니다. 이 데이터는 특정 통화의 힘을 확인하는 데 사용할 수 있는 사용하기 쉬운 통화 지수 및 통화 전력선의 형태로 표시됩니다. 필요한 것은 거래하려는 차트에 표시기를 부착하는 것뿐입니다. 표시기는 거래하는 통화의 실제 강세를 보여줍니다. 지표는 또한 추세와 거래할 때 유리하게 사용할 수 있는 구매 및 판매 거래량 압력의 극한값을 보여줍니다. 지표는 또한 피보나치에 기반한 가능한 대상을 보여줍니다. 표시기는 PUSH 알림을 포함한 모든 유형의 알림을 제공합니다. 구매 후 연락주세요. 나는 당신과 거래 팁을 공유하고 당신에게 무료로 훌륭한 보너스 지표를 줄 것입니다! 나는 당신에게 행복하고 유익한 거래를 기원합니다!
Currency Strength Exotics
Bernhard Schweigert
4.88 (33)
현재 20% 할인! 초보자 또는 전문가 트레이더를 위한 최고의 솔루션! 이 표시기는 Exotic Pairs Commodities, Indexes 또는 Futures와 같은 기호에 대한 통화 강도를 표시하는 데 특화되어 있습니다. 금, 은, 석유, DAX, US30, MXN, TRY, CNH 등의 진정한 통화 강도를 보여주기 위해 9번째 줄에 모든 기호를 추가할 수 있습니다. 이것은 독특하고 고품질이며 저렴한 거래 도구입니다. 우리는 많은 독점 기능과 새로운 공식을 통합했습니다. 새로운 추세 또는 스캘핑 기회의 정확한 트리거 포인트를 정확히 찾아낼 수 있기 때문에 거래가 어떻게 개선될지 상상해 보십시오. 사용 설명서: 여기를 클릭 https://www.mql5.com/en/blogs/post/708876 모든 시간대에 작동합니다. TREND를 빠르게 확인할 수 있습니다! 새로운 기본 알고리즘을 기반으로 설계되어 잠재적인 거래를 더욱 쉽게 식별하고 확인할 수 있습니다. 8개의
Precautions for subscribing to indicator This indicator only supports the computer version of MT4 Does not support MT5, mobile phones, tablets The indicator only shows the day's entry arrow The previous history arrow will not be displayed (Live broadcast is for demonstration) The indicator is a trading aid Is not a EA automatic trading No copy trading function The indicator only indicates the entry position No exit (target profit)  The entry stop loss point is set at 30-50 PIPS Or the front hi
PRO Renko System
Oleg Rodin
5 (30)
PRO Renko System 은 RENKO 차트 거래를 위해 특별히 고안된 매우 정확한 거래 시스템입니다. 이것은 다양한 거래 상품에 적용될 수있는 보편적 인 시스템입니다. 체계는 효과적으로 당신에게 정확한 반전 신호에 접근을 주는 소위 시장 소음을 중화합니다. 이 표시기는 사용하기가 매우 쉽고 신호 생성을 담당하는 매개 변수가 하나만 있습니다. 당신은 쉽게 당신의 선택의 어떤 무역 계기에 공구를 적응시킬 수 있고 renko 막대기의 크기. 나는 항상 당신이 내 소프트웨어로 수익성있게 거래 할 수 있도록 추가 지원을 제공 할 준비가되어 있습니다! 나는 당신에게 행복하고 수익성있는 거래를 기원합니다! 구매 후 저에게 연락하십시오! 내 렌코 차트 생성기를 보내드립니다. 또한 내 개인 권장 사항 및 시스템의 다른 모듈을 무료로 공유 할 것입니다!
Are you looking for a simple and reliable indicator that can help you spot market swing points easily? Do you want clear buy and sell signals that work on any timeframe and any trading instrument? Buy Sell Signal Pro is designed to do exactly that. It helps traders identify important market turning points and understand the current market structure in a clear and easy way. This indicator detects Higher Highs (HH), Higher Lows (HL), Lower Highs (LH), and Lower Lows (LL) so you can quickly see wh
현재 40% 할인 ! 초보자 또는 전문가 트레이더를 위한 최고의 솔루션! 이 대시보드 소프트웨어는 28개의 통화 쌍에서 작동합니다. 2가지 주요 지표(Advanced Currency Strength 28 및 Advanced Currency Impulse)를 기반으로 합니다. 전체 Forex 시장에 대한 훌륭한 개요를 제공합니다. 고급 통화 강도 값, 통화 이동 속도 및 모든(9) 시간대의 28 Forex 쌍에 대한 신호를 보여줍니다. 추세 및/또는 스캘핑 기회를 정확히 파악하기 위해 차트의 단일 지표를 사용하여 전체 시장을 볼 수 있을 때 거래가 어떻게 개선될지 상상해 보십시오! 잠재적인 거래를 식별하고 확인하면서 강력한 통화와 약한 통화를 더욱 쉽게 식별할 수 있도록 이 지표에 기능을 내장했습니다. 이 표시기는 통화의 강세 또는 약세가 증가 또는 감소하는지 여부와 모든 시간대에서 수행되는 방식을 그래픽으로 보여줍니다. 추가된 새로운 기능은 현재 시장 조건 변화에 적응하는
Advanced Currency Strength28 Indicator
Bernhard Schweigert
4.91 (657)
현재 40% 할인 초보자 또는 전문가 트레이더를 위한 최고의 솔루션! 이 지표는 우리가 독점 기능과 새로운 공식을 통합했기 때문에 독특하고 고품질이며 저렴한 거래 도구입니다. 단 하나의 차트로 28 Forex 쌍의 통화 강도를 읽을 수 있습니다! 새로운 추세 또는 스캘핑 기회의 정확한 트리거 포인트를 정확히 찾아낼 수 있기 때문에 거래가 어떻게 개선될지 상상해 보십시오. 사용 설명서: 여기를 클릭  https://www.mql5.com/en/blogs/post/697384 그것이 첫 번째, 원본입니다! 쓸모없는 지망생 클론을 사지 마십시오. 더 스페셜  강력한 통화 모멘텀을 보여주는 하위 창의 화살표 GAP가 거래를 안내합니다! 기본 또는 호가 통화가 과매도/과매도 영역(외부 시장 피보나치 수준)에 있을 때 개별 차트의 기본 창에 경고 표시가 나타납니다. 통화 강도가 외부 범위에서 떨어질 때 풀백/반전 경고. 교차 패턴의 특별 경고 추세를 빠르게 볼 수 있는 다중 시간
FX Power MT4 NG
Daniel Stein
4.95 (21)
FX Power: 통화 강세 분석으로 더 스마트한 거래 결정을 개요 FX Power 는 어떤 시장 상황에서도 주요 통화와 금의 실제 강세를 이해하기 위한 필수 도구입니다. 강한 통화를 매수하고 약한 통화를 매도함으로써 FX Power 는 거래 결정을 단순화하고 높은 확률의 기회를 발견합니다. 트렌드를 따르거나 극단적인 델타 값을 사용해 반전을 예측하고자 한다면, 이 도구는 귀하의 거래 스타일에 완벽히 적응합니다. 단순히 거래하지 말고, FX Power 로 더 스마트하게 거래하세요. 1. FX Power가 거래자에게 매우 유용한 이유 통화와 금의 실시간 강세 분석 • FX Power 는 주요 통화와 금의 상대적 강세를 계산하고 표시하여 시장 역학에 대한 명확한 통찰력을 제공합니다. • 어떤 자산이 앞서고 있고 어떤 자산이 뒤처지는지 모니터링하여 보다 현명한 거래 결정을 내릴 수 있습니다. 포괄적인 멀티 타임프레임 뷰 • 단기, 중기 및 장기 타임프레임에서 통화와 금의 강세를
Advanced Supply Demand
Bernhard Schweigert
4.91 (298)
현재 40% 할인! 초보자나 전문 트레이더를 위한 최고의 솔루션! 이 보조지표는 우리가 다수의 독창적 기능과 새로운 공식을 통합한 독특하고 고품질이며 저렴한 거래 도구입니다. 이 업데이트를 통해 이중 시간대를 표시할 수 있습니다. 더 높은 TF를 표시할 수 있을 뿐만 아니라 차트 TF와 더 높은 TF 모두를 표시할 수 있습니다: 중첩 영역 표시. 모든 Supply Demand 트레이더들이 좋아할 것입니다. :) 중요한 정보 공개 Advanced Supply Demand의 잠재력을 극대화하려면 다음을 방문하십시오. https://www.mql5.com/ko/blogs/post/720245   진입 또는 목표의 명확한 트리거 포인트를 정확히 찾아냄으로 해서 거래가 어떻게 개선될지 상상해 보십시오. 새로운 알고리즘을 기반으로 매수자와 매도자 간의 잠재적인 불균형을 훨씬 더 쉽게 분간할 수 있습니다. 왜냐하면 가장 강한 공급영역과 가장 강한 수요 영역과 과거에 어떻게 진행 되었는지를(이전
Advanced Currency IMPULSE with ALERT
Bernhard Schweigert
4.9 (490)
현재 40% 할인!! 초보자 또는 전문가 트레이더를 위한 최고의 솔루션! 이 지표는 우리가 독점 기능과 비밀 공식을 통합했기 때문에 독특하고 고품질이며 저렴한 거래 도구입니다. 단 하나의 차트로 28개 통화 쌍 모두에 대한 경고를 제공합니다. 새로운 추세 또는 스캘핑 기회의 정확한 트리거 포인트를 정확히 찾아낼 수 있기 때문에 거래가 어떻게 개선될지 상상해 보십시오! 새로운 기본 알고리즘을 기반으로 구축되어 잠재적인 거래를 훨씬 더 쉽게 식별하고 확인할 수 있습니다. 이는 통화의 강세 또는 약세가 가속되는지 여부를 그래픽으로 표시하고 가속 속도를 측정하기 때문입니다. 자동차의 속도계처럼 생각하면 됩니다. 가속화할 때 Forex 시장에서 동일한 일이 분명히 더 빠르게 발생합니다. 즉, 반대 방향으로 가속화되는 통화를 페어링하면 잠재적으로 수익성 있는 거래를 식별한 것입니다. 통화 모멘텀의 수직선과 화살표가 거래를 안내합니다! 역동적인 Market Fibonacci 23 레벨은
Trend indicator AI
Ramil Minniakhmetov
4.57 (82)
트렌드 인공 지능 지표는 실행 가능한 진입 점 및 반전 경고와 추세 식별을 결합하여 상인의 시장 분석을 향상시킬 훌륭한 도구입니다. 이 표시기는 사용자가 자신감과 정밀도로 외환 시장의 복잡성을 탐색 할 수 있도록 지원합니다 기본 신호 외에도 트렌드 인공 지능 지표는 풀백 또는 되돌림 중에 발생하는 2 차 진입 점을 식별하여 거래자가 기존 트렌드 내에서 가격 수정을 활용할 수 있도록합니다. 중요한 장점: ·작동 4 및 5 *명확한 구매 또는 판매 신호 *다시 칠하지 않습니다 *모든 자산에서 작동 나는 전보 사기에 개 또는 세트를 판매하지 않도록주의. 모든 설정은 블로그에 여기에 무료.  중요! 지침 및 보너스를 얻기 위해 구입 후 즉시 저에게 연락! 진짜 가동 감시는 뿐 아니라 나의 다른 제품 여기에서 찾아낼 수 있습니다: https://www.mql5.com/en/users/mechanic/seller&nbsp ; 설정 및 입력: 모든 자산에 대해 기본 설정을 권
FX Volume
Daniel Stein
4.63 (38)
FX Volume: 브로커 시각에서 바라보는 진짜 시장 심리 간단 요약 트레이딩 접근 방식을 한층 더 향상시키고 싶으신가요? FX Volume 는 소매 트레이더와 브로커의 포지션을 실시간으로 파악할 수 있게 해 줍니다. 이는 COT 같은 지연된 보고서보다 훨씬 빠릅니다. 꾸준한 수익을 추구하는 분이든, 시장에서 더 깊은 우위를 원하시는 분이든, FX Volume 을 통해 대규모 불균형을 찾아내고, 돌파 여부를 확인하며 리스크 관리를 정교화할 수 있습니다. 지금 시작해 보세요! 실제 거래량 데이터가 의사결정을 어떻게 혁신할 수 있는지 직접 경험해 보시기 바랍니다. 1. 트레이더에게 FX Volume이 매우 유익한 이유 탁월한 정확도를 지닌 조기 경보 신호 • 다른 사람들보다 훨씬 앞서, 각 통화쌍을 매수·매도하는 트레이더 수를 거의 실시간으로 파악할 수 있습니다. • FX Volume 은 여러 리테일 브로커에서 추출한 실제 거래량 데이터를 종합해 명확하고 편리한 형태로 제공하는
Meravith
Ivan Stefanov
5 (3)
마켓 메이커를 위한 도구. Meravith는 다음과 같은 기능을 제공합니다: 모든 타임프레임을 분석하고 현재 유효한 추세를 표시합니다. 강세와 약세 거래량이 동일한 유동성 구간(거래량 균형 구간)을 강조 표시합니다. 서로 다른 타임프레임의 모든 유동성 레벨을 차트에 직접 표시합니다. 텍스트 기반 시장 분석을 생성하여 참고용으로 제공합니다. 현재 추세를 기반으로 목표가, 지지선 및 손절가를 계산합니다. 거래의 위험 대비 보상 비율(Risk/Reward)을 계산합니다. 계좌 잔고에 따라 포지션 크기를 산출하고 잠재 수익을 추정합니다. 시장에 중대한 변화가 발생할 경우 경고도 제공합니다. 지표의 주요 라인: 강세/약세 거래량 소진 라인 — 목표가로 사용됩니다. 시장 추세를 나타내는 라인. 시장이 강세인지 약세인지에 따라 색상이 변경되며 추세 지지선 역할을 합니다. 색상은 주로 시장 심리를 보여줍니다. 거래량 균형선(Eq). Eq(Volume Equilibrium) 라인은 시스템의 핵심입니
Apollo SR Master
Oleg Rodin
5 (1)
Apollo SR Master는 지지/저항 구간에서의 거래를 더욱 쉽고 안정적으로 만들어 주는 특수 기능을 갖춘 지지/저항 지표입니다. 이 지표는 지역 가격의 고점과 저점을 감지하여 시간 지연 없이 실시간으로 지지/저항 구간을 계산합니다. 새롭게 형성된 저항 구간을 확인하기 위해 지표는 해당 저항 구간을 실제 매도 또는 매수 신호로 활용할 수 있음을 나타내는 특수 신호를 표시합니다. 이 경우, 저항 구간의 강도가 높아지고, 따라서 저항 구간에서의 성공적인 거래 가능성도 높아집니다. 이것이 바로 이 지표의 핵심 아이디어입니다. SR 존은 손절매와 이익실현을 더욱 쉽게 할 수 있도록 해줍니다. 신호 방향에 따라 SR 존 위 또는 아래 공간을 손절매로 활용할 수 있습니다. 또한, 반대쪽 SR 존은 잠재적 이익실현 영역으로 활용할 수 있습니다. 또한 Apollo SR Master 지표를 사용하는 모든 사용자에게 "Apollo Price Action System" 지표를 무료로 제공합니다.
IQ Gold Gann Levels
INTRAQUOTES
5 (4)
Presenting one-of-a-kind Gann Indicator for XAUUSD IQ Gold Gann Levels is a non-repainting, precision tool designed exclusively for XAUUSD/Gold intraday trading. It uses W.D. Gann’s square root method to plot real-time support and resistance levels, helping traders spot high-probability entries with confidence and clarity. William Delbert Gann (W.D. Gann) was an exceptional market analyst whose trading technique was based on a complex blend of mathematics, geometry, astrology, and ancient calcul
KT Trend Trading Suite MT4
KEENBASE SOFTWARE SOLUTIONS
KT Trend Trading Suite는 트렌드 추종 전략과 여러 돌파 지점을 결합한 다기능 지표입니다. 이러한 돌파 지점은 진입 신호로 사용됩니다. 새로운 추세가 형성되면 이 지표는 여러 번의 진입 기회를 제공하여 트렌드를 성공적으로 따라갈 수 있도록 돕습니다. 덜 중요한 진입 신호를 피하기 위해 되돌림 기준값이 사용됩니다. MT5 버전은 여기에서 확인할 수 있습니다  https://www.mql5.com/en/market/product/46270 기능 여러 가지 시장 흐름을 하나의 수식으로 결합하여 현재 추세를 명확하게 시각화합니다. 진입 신호가 발생한 구간에 직사각형 박스를 표시하여 지역 고점과 저점을 명확히 나타냅니다. 신호의 정확도를 측정하고 간단한 성능 지표를 제공합니다. 다중 시간대 대시보드를 포함하여 모든 시간 프레임을 스캔하고 각 시간대의 추세 방향을 표시합니다. 입력 파라미터 History Bars:   과거 신호 분석에 사용할 히스토리 바 개수입니다.
El indicador "MR BEAST ALERTAS DE LIQUIDEZ" es una herramienta avanzada diseñada para proporcionar señales y alertas sobre la liquidez del mercado basándose en una serie de indicadores técnicos y análisis de tendencias. Ideal para traders que buscan oportunidades de trading en función de la dinámica de precios y los niveles de volatilidad, este indicador ofrece una visualización clara y detallada en la ventana del gráfico de MetaTrader. Características Principales: Canal ATR Adaptativo: Calcula
Volatility Trend System - a trading system that gives signals for entries. The volatility system gives linear and point signals in the direction of the trend, as well as signals to exit it, without redrawing and delays. The trend indicator monitors the direction of the medium-term trend, shows the direction and its change. The signal indicator is based on changes in volatility and shows market entries. The indicator is equipped with several types of alerts. Can be applied to various trading ins
GM Arrows Pro
Guillaume Pierre Philippe Mesplont
Product Name: GM Arrows Pro – Signals & Alerts Short Description: GM Arrows Pro is a clean, reliable MT4 indicator showing BUY/SELL arrows on the chart with unique alerts at the moment the signal appears. Full Description: GM Arrows Pro is a professional MT4 indicator designed for traders who want clear, actionable signals: BUY and SELL arrows visible on the entire chart history Unique alerts when a new signal appears (no repeated alerts) Option to disable repetitive signals ( disable_repeatin
PZ Divergence Trading
PZ TRADING SLU
5 (2)
Unlock hidden profits: accurate divergence trading for all markets Tricky to find and scarce in frequency, divergences are one of the most reliable trading scenarios. This indicator finds and scans for regular and hidden divergences automatically using your favourite oscillator. [ Installation Guide | Update Guide | Troubleshooting | FAQ | All Products ] Easy to trade Finds regular and hidden divergences Supports many well known oscillators Implements trading signals based on breakouts Display
Trend Screener
STE S.S.COMPANY
4.79 (95)
트렌드 표시기, 트렌드 트레이딩 및 필터링을 위한 획기적인 고유 솔루션, 하나의 도구 안에 내장된 모든 중요한 트렌드 기능! Forex, 상품, 암호 화폐, 지수 및 주식과 같은 모든 기호/도구에 사용할 수 있는 100% 다시 칠하지 않는 다중 시간 프레임 및 다중 통화 표시기입니다. 기간 한정 특가: 지원 및 저항 스크리너 지표는 단 100달러에 평생 제공됩니다. (원래 가격 50 달러) (제안 연장) Trend Screener는 차트에 점이 있는 화살표 추세 신호를 제공하는 효율적인 지표 추세 추종 지표입니다. 추세 분석기 표시기에서 사용할 수 있는 기능: 1. 트렌드 스캐너. 2. 최대 이익 분석이 있는 추세선. 3. 추세 통화 강도 측정기. 4. 경고가 있는 추세 반전 점. 5. 경고가 있는 강력한 추세 점. 6. 추세 화살표 Trend Screener Indicator가 있는 일일 분석 예, 일일 신호 성능...등은 여기에서 찾을 수 있습니다.   여기를 클릭하십시오. L
제작자의 제품 더 보기
It is widely known that colors affect the emotional state of a human, especially if this human is a trader. Psychologists recommend that you follow your instincts and select the color of your environment that is most comfortable to you. In order to reduce emotional stress, impact of colors on a person should be considered. The optimal range of the most beneficial colors includes green, yellow-green and green-blue ones. This indicator allows you to manage your emotional state and health. Choose a
FREE
This is an interactive and easy-to-set indicator which allows to form seven equally spaced channels which have your settings simultaneously. All seven channels are enabled by default. But you can easily enable one or another channel using control buttons located in the upper case of the indicator's control panel. You can change a period of the indicator calculation by clicking one of buttons indicating number of the channel in the lower case of the control panel. Two other buttons (one of them i
This EA represents an interactive panel with adjustable parameters destined for installation and deletion of pending orders (orders grid generator). You can place the panel anywhere on the screen or hide it into a dot clicking on the button in the upper left part of the chart (it will be shown after clicking on it for the second time). Number and step of orders, lot size, vertical shift for limit orders - all these things make your work easier. There are functions for restoring according to pend
Equidistant channel
Valeriy Medvedev
The purpose of the indicator is drawing an equidistant channel. It is somewhat different from the traditional model. The choice of control parameters is simple and does not require any special description. Enter the calculation interval in hours and the solution to the problem will appear on the screen. Please note that the time involved in calculation of the channel must be greater than the timeframe it will be displayed on. If the parameters you enter are beyond the allowable limits, you will
This indicator is designed for drawing equidistant channels. Two options are available: based on the number of hours in the indicator calculation and by the number of bars. To draw a channel, enter a number 1 or greater. The maximum value is limited by the amount of visible bars. If the parameters you enter are beyond the allowable limits, you will get notified if the indicator restrictions. Please note that the time involved in calculation of the channel must be greater than the timeframe it wi
ZigZag on average
Valeriy Medvedev
This is a well-known ZigZag indicator. But it differs by the fact that its plot is based on values of the middle line which is set by a user. It can display Andrews’ Pitchfork and standard or Bobokus Fibo levels. NO REPAINTING. Parameters Period МА — middle line period. Default value is 34. Minimum value is 4. Maximum value is set at your discretion. Used to calculate price - base price to calculate the middle line. The averaging method - method of smoothing the middle line. Turning pitchfork —
The indicator displays the moving average of all periods on one chart. It shows the MA of a one step lower timeframe and all the MAs equal to and higher than it. Parameters Period moving average - Moving Average period (default is 34); Used to calculate price - price used for the MA calculation (default is the average price = (high+low)/2); The averaging method - default is linear-weighted; Moving average shift - MA shift (default is 0). Just enter the MA calculation period and its parameters,
Desk Analytical Table Portfolio Monitoring for Active Traders Overview: The Desk Analytical Table indicator is a professional tool designed for traders managing multiple financial instruments simultaneously. It consolidates key data on open positions, orders, and market statistics into a single window, ensuring seamless portfolio control even during high-intensity trading sessions. Key Features: ️ Multi-Instrument Analysis - Monitor up to 30 assets in real time with quick switching between inst
This is a prototype of the famous Control and management of transactions panel. There are two main differences: Allows to work with all the variety of financial instruments opened by a user and not only with instruments it was attached to; To activate levels of order closure hidden from a broker, it uses not lines but modifiable virtual levels. To enjoy the full functionality of the panel you are advised to have: Desk analytical table . Their combined operation allows to keep the situation under
Inform Panel For ALL Symbols — Advanced Multi-Instrument Trading Management The Inform Panel For ALL Symbols is a sophisticated trading management tool designed to streamline control over all financial instruments in a trader’s portfolio, eliminating the need to attach it to specific charts. Its core innovation lies in using modifiable virtual levels for stop loss (SL) and take profit (TP), allowing discreet order closure hidden from brokers. The panel automatically detects and lists all active
The indicator is based on the two-buffer scheme and does not require any additional settings. It can be used on any financial instrument without any restrictions. The indicator is a known ZigZag, but it does not redraw . The indicator allows to easily detect significant levels on the price chart, as well as demonstrates the ability to determine the probable direction of a price movement. The calculations are based on the candles' Close prices, thus improving the reliability of the levels. Param
The idea of the indicator stems from the necessity to clearly define the borders of support and resistance levels, which helps to plan the opening and closing of positions in the areas that most appropriately determine the process. Look at the breakdowns of the resistance level that confirm the intention of the price to continue the upward movement, after it passed the support level and entered the channel formed by the two levels. The same is for the case when the price enters the channel downw
This indicator is a logical extension of the product at https://www.mql5.com/en/market/product/12526 . The only difference is that price movement is displayed using a histogram with levels, allowing to assess the direction and strength of the movement. How to interpret the signal: 0 - the middle of the channel; above 0.5 - the breakdown of the channel up; below -0.5 - the breakdown of the channel down. Both indicators are displayed in the attached screenshots. Install the indicator and you will
Simple Line
Valeriy Medvedev
The indicator shows the levels of the past week and day. In addition, it draws a level in percentage. This level is specified relative to the difference between the High and Low of the past month and week. For the daily levels of the past day, the Close levels are additionally displayed. All you need to do is configure the display parameters of the levels to your liking. Parameters Over the past months installations - settings for the last months; PasteMonthsLines - the level display mode is on
This indicator is the logical continuation of the well-known equidistant channel indicator: https://www.mql5.com/en/market/product/8723 . The main purpose of the indicator is the visualization of price levels relative to the parallel channel using Fibo Bobokus levels in a separate window and the price history. This often allows forecasting the future price movement with a sufficiently high degree of probability. The Fibo levels calculation equation is as follows: FiboLevel = (50-(100*((Close[i]-
This simple to use utility allows opening charts from the list of financial instruments by left clicking their names. The chart window is opened using the Default template. The template name can be changed to one of those stored in Charts-Templates section of the terminal. It is possible to customize the background colors of panels and their labels, and also to select the display type for a more comfortable working environment. This is all you need to know in order to see the result quickly. Pa
If you need to quickly evaluate the results of trading on a current financial instrument by hypothetical price movement in the chosen direction and up to a certain level, set the indicator on any chart that contains open positions and move the line to the desired level after it appears together with the results tab. This is all you need to understand what happens to your deposit if the price is at this level without taking into account existing stop loss and take profit. Enable considering pendi
This is an individual tool for analyzing the market situation. It is very simple to use. After attaching the indicator to the chart, you will see three vertical lines named "VLine 1", "VLine 2" and "VLine 3", following in this order from left to right. For the utility to operate correctly, this sequence should always be observed. Please note: at the first start, the lines are not bound to specific price levels on the chart. This should be done by user in accordance with the following rule: if li
This indicator is designed for monitoring RSI levels on the current and higher timeframes. The control panel is user friendly and consists of buttons, with which you can control the display of lines as per the names of the buttons. The button color matches the line color. Parameters "___| Settings of the main indicator " RSI Period - averaging period for index calculation (default is 14); RSI Price type - price used for calculations (default is the Close price); "___| Color palette " Text color
Этот индикатор предназначен для контроля уровней CCI на текущем и старших от него таймфреймах. Панель управления проста в понимании и состоит из кнопок, с помощью которых можно управлять отображением линий, соответствующим указанным на наименовании кнопок. Цвет кнопки совпадает с цветом линии. Этот индикатор из серии подобных индикаторов, которые уже успели завоевать популярность: https://www.mql5.com/ru/market/product/30276 и https://www.mql5.com/ru/market/product/30403 Параметры "___| Setti
This is a well-known ZigZag indicator. But it differs by the fact that its plot is based on values of the middle line which is set by a user. It can display Andrews’ Pitchfork and standard or Bobokus Fibo levels. NO REPAINTING. Parameters Period МА — middle line period. Default value is 34. Minimum value is 4. Maximum value is set at your discretion. Used to calculate price — type of price used for the midline calculations. The averaging method — type of smoothing for the middle line. Turning p
The indicator is similar to https://www.mql5.com/en/market/product/12330 . However, it considers the MQL5 platform features. Peaks and bottoms are calculated based solely on external bars. After a swing is formed, the indicator does not redraw providing opportunities for traders working on horizontal level breakthroughs. Traffic can be reduced by changing the amount of calculated bars in the MinBars variable (default value is 500). All you need is to select the output options, so that you can se
The indicator is based on the two-buffer scheme and does not require any additional settings. It can be used on any financial instrument without any restrictions. The indicator is a known ZigZag, but it does not redraw . The indicator allows to easily detect significant levels on the price chart, as well as demonstrates the ability to determine the probable direction of a price movement. The calculations are based on the candles' Close prices, thus improving the reliability of the levels. Param
It is an analogue of the indicator of levels at https://www.mql5.com/en/market/product/24273 for the MetaTrader 5 platform. The indicator shows the levels of the past month, week and day. In addition, it draws a level in percentage relative to the difference between the High and Low of the past month and week. For the daily levels of the past day, the Close levels are additionally displayed. All you need to do is to configure the display parameters of the levels to your liking. In some cases, af
필터:
jetztea1
174
jetztea1 2021.12.03 12:57 
 

사용자가 평가에 대한 코멘트를 남기지 않았습니다

Andreas Opitz
2188
Andreas Opitz 2021.10.13 14:14 
 

사용자가 평가에 대한 코멘트를 남기지 않았습니다

Takashi Hasebe
407
Takashi Hasebe 2020.10.08 11:29 
 

사용자가 평가에 대한 코멘트를 남기지 않았습니다

Shaheen Hassanali
6800
Shaheen Hassanali 2018.12.03 13:22 
 

사용자가 평가에 대한 코멘트를 남기지 않았습니다

Tim Eubanks
5763
Tim Eubanks 2018.07.14 17:53 
 

사용자가 평가에 대한 코멘트를 남기지 않았습니다

Erdinç Yıldız
539
Erdinç Yıldız 2018.07.06 22:21 
 

사용자가 평가에 대한 코멘트를 남기지 않았습니다

리뷰 답변