Three simple lines

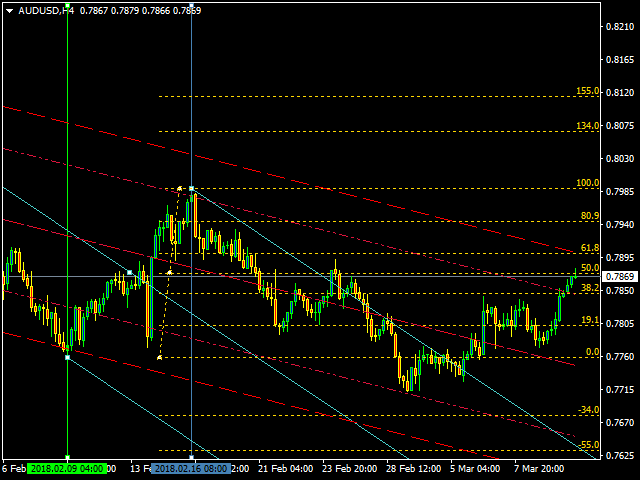
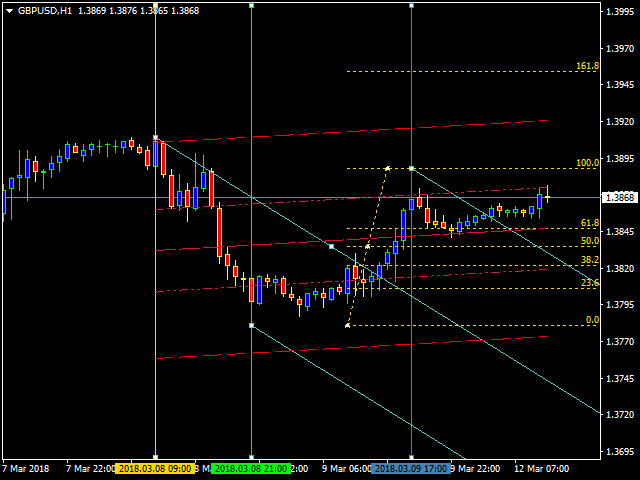
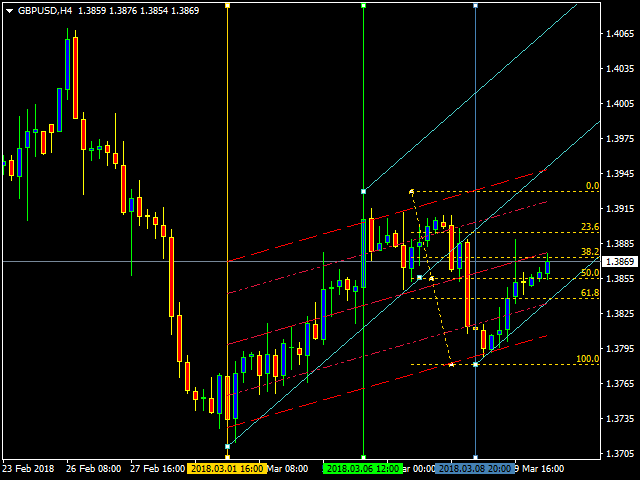
This is an individual tool for analyzing the market situation. It is very simple to use. After attaching the indicator to the chart, you will see three vertical lines named "VLine 1", "VLine 2" and "VLine 3", following in this order from left to right. For the utility to operate correctly, this sequence should always be observed. Please note: at the first start, the lines are not bound to specific price levels on the chart. This should be done by user in accordance with the following rule: if line 1 is set to identify a bottom, the line 2 should be set at the top, and line 3 should be placed similar to the first one, at the bottom. This is similar to a LOW-HIGH-LOW zigzag. In case a top at the line 1 is selected as the start, the sequence should be: HIGH-LOW-HIGH. The advantage of this approach is that users define the tops and bottoms for analyzing the market situation themselves. The indicator is equipped with the ability to plot such graphical tools as Andrews pitchforks, two types of Fibonacci levels, as well as linear regression and standard deviation channels. Each section of indicator parameters has a corresponding label, and the settings are reduced to the minimum required for their display.


Parameters

  • ___| Line — vertical line display section:
  • Line 1 Color — color of line 1.
  • Line 2 Color — color of line 2.
  • Line 3 Color — color of line 3.
  • Line Style — line display style.
  • Line Thickness — line width.
  • Delete lines? — delete the lines when the timeframe is changed or when the indicator is removed.
  • ___| Pitchfork — Andrews' Pitchfork display section:
  • Fitting Pitchfork — plot Andrews' Pitchfork, enabled by default.
  • Color Pitchfork — color of Andrews' Pitchfork.
  • ___| Fibo — Fibonacci level display section:
  • Inclusion levels Fibo — plot Fibonacci levels, enabled by default.
  • Installing Fibo levels — plot type: standard (default) or Bobokus.
  • Distance pips to turn Fibo levels — the minimum profit in pips required for plotting, default is 60.
  • Color Fibo Levels — color of Fibonacci levels.
  • ___| Linear Regression Channel — linear regression channel display section:
  • Inclusion Linear Regression Channel — plot linear regression channel, enabled by default.
  • Channel color — channel line color.
  • Style of channel lines — channel line style.
  • Width of channel lines — channel line width.
  • Channel's continuation to the right — extend the channel to the right, disabled by default.
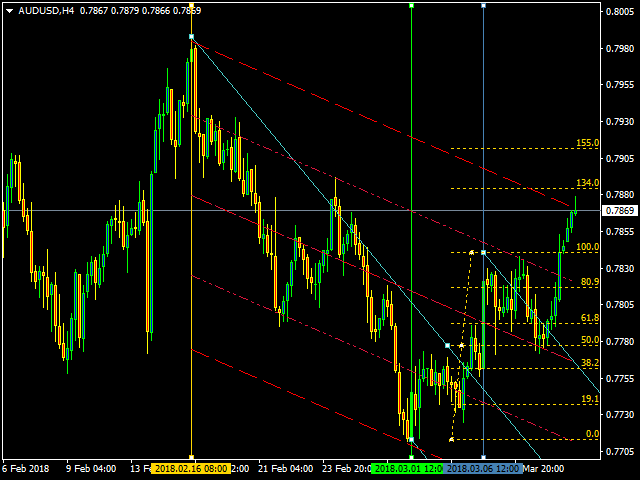
  • ___| Standard Deviation Channel — standard deviation channel display section:
  • Standard Deviation Channel - plot standard deviation channel, enabled by default.
  • Deviation — deviation, default is 1.0;
  • Channel color — channel line color.
  • Style of channel lines — channel line style.
  • Width of channel lines — channel line width.
  • Channel's continuation to the right — extend the channel to the right, disabled by default.
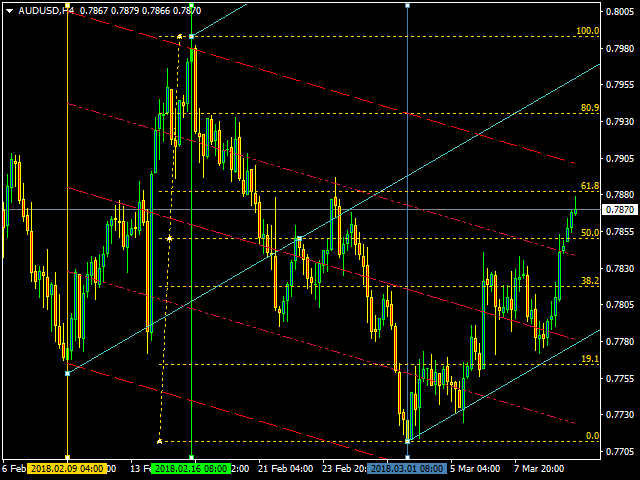
추천 제품
Auto Fibo Pro m
DMITRII GRIDASOV
"Auto FIBO Pro" Crypto_Forex 지표 - 거래에 유용한 보조 도구입니다! - 지표는 자동으로 Fibo 수준과 로컬 추세선(빨간색)을 계산하여 차트에 배치합니다. - Fibonacci 수준은 가격이 반전될 수 있는 주요 영역을 나타냅니다. - 가장 중요한 수준은 23.6%, 38.2%, 50%, 61.8%입니다. - 역전 스캘핑이나 존 그리드 거래에 사용할 수 있습니다. - Auto FIBO Pro 지표를 사용하여 현재 시스템을 개선할 수 있는 기회도 많습니다. - Info Spread Swap Display가 있습니다. 현재 Spread와 Swap이 부착된 외환 쌍을 표시합니다. - 디스플레이에는 계정 잔액, 자본 및 마진도 표시됩니다. - 차트의 어느 모서리에서나 Info Spread Swap Display를 찾을 수 있습니다. 여기를 클릭하여 고품질 트레이딩 로봇과 지표를 확인하세요! 이것은 이 MQL5 웹사이트에서만 제공되는 오리지널 제품입니다.
Trend Ray
Andriy Sydoruk
The indicator shows the potential trend direction by cyclical-wave dependence. Thus, all the rays of the intersection will be optimal rays, in the direction of which the price is expected to move, taking into account the indicator period. Rays can be used as a direction for potential market movement. But we must not forget that the approach must be comprehensive, the indicator signals require additional information to enter the market.
MasterDot
Andrey Kozak
Master Dot for MetaTrader 4 Detect Volatility Exhaustion Before the Market Returns to Balance Master Dot is a professional non-repainting indicator designed to detect moments when price moves beyond its statistically expected volatility range. These situations often occur during sharp market impulses, liquidity grabs or temporary emotional moves, when price departs from its normal trading conditions. Instead of following trends, Master Dot highlights volatility exhaustion — moments where the mar
Double HMA lines MTF
Pavel Zamoshnikov
5 (2)
This is a multi-timeframe version of the popular Hull Moving Average (HMA). The Double HMA MTF Light indicator combines two timeframes on a single chart. The HMA of the higher timeframe defines the trend, and the HMA of the current timeframe defines short-term price movements. The indicator is freely distributed and hasn't audio signals or messages. Its main function is the visualization of price movements. If you need advanced functionality of the HMA multi-timeframe indicator (information ab
FREE
The indicator detects and displays 3 Drives harmonic pattern (see the screenshot). The pattern is plotted by the extreme values of the ZigZag indicator (included in the resources, no need to install). After detecting the pattern, the indicator notifies of that by a pop-up window, a mobile notification and an email. The indicator highlights the process of the pattern formation and not just the complete pattern. In the former case, it is displayed in the contour triangles. After the pattern is com
PZ Harmonacci Patterns
PZ TRADING SLU
3.17 (6)
Trade smarter, not harder: Empower your trading with Harmonacci Patterns This is arguably the most complete harmonic price formation auto-recognition indicator you can find for the MetaTrader Platform. It detects 19 different patterns, takes fibonacci projections as seriously as you do, displays the Potential Reversal Zone (PRZ) and finds suitable stop-loss and take-profit levels. [ Installation Guide | Update Guide | Troubleshooting | FAQ | All Products  ] It detects 19 different harmonic pric
CRT Candle Range Theory HTF MT4.   Ultimate CRT Indicator: Advanced ICT Concepts and Malaysian SnR Trading System Master the Market Maker's Footprints with the Most Advanced Candle Range Theory Indicator Unlock the true power of  Smart Money Concepts (SMC)  and trade precisely like the institutions with the  Ultimate CRT Indicator . Built exclusively for serious traders, this indicator automates the highly effective  Candle Range Theory (CRT) , a core pillar of  ICT Concepts (Inner Circle Trader
Chart Patterns Detect 15 patterns (Ascending Triangle, Descending Triangle, Rising Wedge, Falling Wedge, Bullish Flag, Bearish Flag, Bullish Rectangle, Bearish Rectangle Symmetrical triangle, Head and Shoulders, Inverted Head and Shoulders, Triple top, Triple Bottom, Double Top, Double Bottom) Use historical data to calculate the probability of each pattern to succeed (possibility to filter notification according to the chance of success) gives graphic indication about the invalidation level and
PZ Support Resistance
PZ TRADING SLU
3.33 (3)
Unlock key market insights with automated support and resistance lines Tired of plotting support and resistance lines? This is a multi-timeframe indicator that detects and plots supports and resistance lines in the chart with the same precision as a human eye would. As price levels are tested over time and its importance increases, the lines become thicker and darker, making price leves easy to glance and evaluate. [ Installation Guide | Update Guide | Troubleshooting | FAQ | All Products ] Boos
The indicator detects and displays Shark harmonic pattern (see the screenshot). The pattern is plotted by the extreme values of the ZigZag indicator (included in the resources, no need to install). After detecting the pattern, the indicator notifies of that by a pop-up window, a mobile notification and an email. The indicator highlights the process of the pattern formation and not just the complete pattern. In the former case, it is displayed in the contour triangles. After the pattern is comple
Gold Phoenix
Yaroslav Varankin
The perfect tool for Scalng in the Forex markets You can trade both from signal to signal and using take profit  The algorithm does not use Zigzag!  No redrawing!  This is a channel instrument that uses a moving average as a filter. Moving Average  There are 2 parameters for the settings Ma Period = 5 period Moving Average  Channel 1.0 distance of channel lines from the chart Price Signal Filter - calculation of signal opening and filter There is a complete set of Alert There is a multi-timefram
FreqoMaster
Stanislav Korotky
The main idea of this indicator is rates analysis and prediction by Fourier transform. The indicator decomposes exchange rates into main harmonics and calculates their product in future. The indicator shows 2 price marks in history, depicting price range in the past, and 2 price marks in future with price movement forecast. Buy or sell decision and take profit size are displayed in a text label in the indicator window. The indicator uses another indicator as an engine for calculations - FreqoMet
Day Pattern
Oleksandr Martsynyshen
Description: - D ay Pattern - an indicator that helps to identify patterns of price changes for the development of trading algorithms and strategies. For whom this tool? - For developers of trading strategies and algorithms. - Medium- and long-term traders. Time frames H1-W1. Features of the indicator: - There is a function of exporting indicator values to a file of the csv format. - Using the information panel, you can conduct an express analysis of trading tool. - The indicator is sui
멀티 타임프레임 지원, 맞춤형 시각 신호 및 구성 가능한 알림 시스템을 갖춘 Balance of Power(BOP) 지표. 프리랜서 프로그래밍 서비스, 업데이트 및 기타 TrueTL 제품은 제 MQL5 프로필 에서 이용하실 수 있습니다. 피드백과 리뷰를 대환영합니다! BOP란 무엇인가요? Balance of Power(BOP)는 가격 변화를 바의 범위와 비교하여 매수자 대 매도자의 강도를 측정하는 오실레이터입니다. 지표는 (종가 - 시가) / (고가 - 저가)로 계산된 후 단순 이동 평균(SMA)으로 평활화됩니다. BOP 값은 -1과 +1 사이에서 변동합니다. 양수 값은 매수자가 더 강함을 나타내고(종가가 시가보다 높음), 음수 값은 매도자가 더 강함을 나타냅니다(종가가 시가보다 낮음). 값의 크기는 움직임의 강도를 나타냅니다. BOP는 매수 압력과 매도 압력 사이의 균형을 보여줌으로써 시장 강도와 잠재적인 반전을 식별하는 데 도움이 됩니다. 특징: 화살표 및 수직선을 이용한
FREE
Antabod Gamechanger
Rev Anthony Olusegun Aboderin
*Antabod GameChanger Indicator – Transform Your Trading!*   Are you tired of chasing trends too late or second-guessing your trades? The *Antabod GameChanger Indicator* is here to *revolutionize your trading strategy* and give you the edge you need in the markets!   Why Choose GameChanger? *Accurate Trend Detection* – GameChanger identifies trend reversals with *pinpoint accuracy*, ensuring you enter and exit trades at the optimal time.   *Clear Buy & Sell Signals* – No more guesswork! T
Happy Scalping Indicator
Leandro Bernardez Camero
이 지표는 공격적인 스캘핑 과 바이너리 옵션에서 빠른 진입 을 위해 설계되었습니다 , 각 캔들 마다 신호를 생성하여 언제든지 무엇이 일어나고 있는지 정확히 알 수 있습니다. Happy Scalping 채널에 가입하세요: MQL5 재작성 없음 : 현재 캔들의 신호는 실시간 으로 생성됩니다. 이는 캔들이 아직 형성 중일 때 가격이 이전 캔들의 종가에 비해 상승하거나 하락하는지에 따라 신호가 변경될 수 있음을 의미합니다. 그러나 캔들이 닫히면 , 신호의 색상은 완전히 고정됩니다 . 변경되지 않으며, 사라지지 않고, 이동하지 않습니다. 보이는 그대로 남습니다. 왜 이렇게 설계되었나요? 많은 스캘퍼들은 특히 가격의 돌파나 급격한 움직임 이 있을 때 즉시 신호를 받는 것을 선호합니다. 이를 통해 그런 빠른 피프스를 바로잡을 수 있습니다. 반면, 일부 트레이더는 닫힌 캔들로 확인을 기다리는 것 을 선호하며, 이 지표는 그들도 완벽하게 사용할 수 있습니다. 두 가지 접근 방식 모두 유효합니
ICT Killzones & Pivots Pro is a powerful trading indicator designed to visualize the most important intraday sessions and liquidity zones used by professional traders. It automatically highlights key trading periods such as Asia, London, and New York sessions, allowing traders to clearly see when market activity and volatility are at their highest. Pricing Launch Price : $33 Incremental Price Increase : The price will increase by $10 after every 10 purchases. Final Price : $69 The indicator draw
Introducing the "Magic Trades" for MetaTrader 4 – your ultimate tool for precision trading in dynamic markets. This innovative indicator revolutionizes the way you perceive market trends by harnessing the power of advanced analysis to detect subtle changes in character, paving the way for optimal trading opportunities. The Magic Trades Indicator is designed to empower traders with insightful entry points and well-defined risk management levels. Through its sophisticated algorithm, this indicato
This is an arrow indicator without a future function,developed based on the most advanced profit trading algorithms.It has the most innovative and advanced dual trend analysis module, as well as the latest and highly effective market trend prediction algorithm.Trends are your friends, and following larger trends can earn the maximum profit in foreign exchange. This indicator helps traders identify current trends and track them. Someone once made a profit of 10 times in a week by relying on it.No
Price Magnets
Ivan Simonika
Price Magnet — Price Density and Attraction Levels Indicator Price Magnet is a professional analytical tool designed to identify key support and resistance levels based on statistical Price Density. The indicator analyzes a specified historical period and detects price levels where the market spent the most time. These zones act as “magnets,” attracting price action or forming a structural base for potential reversals. Unlike traditional Volume Profile tools, Price Magnet focuses on price-time d
EARLY REMINDER: The Starting price is 65 price will rise soon up to 365$ and then 750$ after first 10 copies of sales. Grab this offer now! Introduction Hello, traders! Welcome to the demonstration of the Forex Beast Indicator , a comprehensive tool designed to assist aspiring traders in navigating the complexities of the forex market. This indicator incorporates seven essential components to provide a well-rounded trading experience: Moving Averages Colored Zones Support and Resistance Levels
Potential Reversal Price (PRP) Indicator - Ultimate Sniper Entries for XAUUSD Discounted   Price   !!     Secure your lifetime access   now   before it switches to   subscription-only ! Welcome to the   Potential Reversal Price (PRP) Indicator , your ultimate trading tool designed to catch high-probability market reversals with extreme precision. Built for serious traders who demand accuracy, the PRP Indicator combines advanced market structure analysis with momentum exhaustion to pinpoint the e
캔들의 종가를 예측하는 지표입니다. 지표는 주로 D1 차트에서 사용하기 위한 것이. 이 지표는 전통적인 외환 거래와 바이너리 옵션 거래 모두에 적합합니다. 지표는 독립형 거래 시스템으로 사용하거나 기존 거래 시스템에 추가로 사용할 수 있습니다. 이 표시기는 현재 양초를 분석하여 양초 본체 내부의 특정 강도 요인과 이전 양초의 매개변수를 계산합니다. 따라서 지표는 시장 움직임의 추가 방향과 현재 양초의 종가를 예측합니다. 이 방법 덕분에 지표는 단기 및 중장기 거래 모두에 적합합니다. 지표를 사용하면 시장 상황을 분석하는 동안 지표가 생성할 잠재적 신호의 수를 설정할 수 있습니다. 표시기 설정에는 이를 위한 특별한 매개변수가 있습니다. 또한 인디케이터는 새로운 신호에 대해 차트의 메시지 형태, 이메일 및 PUSH 알림 형태로 알릴 수 있습니다. 구매 후 저에게 꼭 써주세요! 나는 당신에게 지표와 거래에 대한 나의 추천을 줄 것입니다! 또한 보너스를 받으세요!
멀티 타임프레임 지원, 사용자 정의 시각적 신호 및 구성 가능한 알림 시스템을 갖춘 Average True Range(ATR) 지표. 프리랜서 프로그래밍 서비스, 업데이트 및 기타 TrueTL 제품은 제 MQL5 프로필 에서 확인하실 수 있습니다. 피드백과 리뷰는 매우 감사하게 받겠습니다! ATR이란 무엇인가요? J. Welles Wilder가 개발한 Average True Range(ATR)는 시장 변동성을 측정하는 기술 지표입니다. 지정된 기간 동안의 True Range 평균을 계산합니다. True Range는 다음 중 가장 큰 값입니다: 현재 고가에서 현재 저가까지의 거리, 이전 종가에서 현재 고가까지의 거리, 또는 이전 종가에서 현재 저가까지의 거리. ATR은 가격 방향을 나타내지 않습니다 — 오직 변동성만 측정합니다. ATR이 상승하면 변동성 증가를 나타내고, ATR이 하락하면 변동성 감소를 신호합니다. 트레이더들은 ATR을 사용하여 시장 상황을 평가하고, 동적 손절매
FREE
Power Flow Binary
Ganesh Tanaji Lohar
POWER FLOW PRO — Binary Options Edition For the first time ever, the POWER FLOW PRO cumulative dominance logic is specially optimized for Binary Options trading. POWER FLOW PRO is a smart real-time pressure-flow indicator designed to detect aggressive market momentum and short-term directional dominance for fast Binary Options entries. The system analyzes: Real-time buying pressure Real-time selling pressure Momentum candle strength Cumulative dominance flow Continuation pressure to generate hig
PZ Penta O MT4
PZ TRADING SLU
2.33 (3)
The Penta-O is a 6-point retracement harmonacci pattern which usually precedes big market movements. Penta-O patterns can expand and repaint quite a bit. To make things easier this indicator implements a twist: it waits for a donchian breakout in the right direction before signaling the trade. The end result is an otherwise repainting indicator with a very reliable trading signal. The donchian breakout period is entered as an input. [ Installation Guide | Update Guide | Troubleshooting | FAQ | A
FREE
Trend PA
Mikhail Nazarenko
5 (3)
The Trend PA indicator uses   Price Action   and its own filtering algorithm to determine the trend. This approach helps to accurately determine entry points and the current trend on any timeframe. The indicator uses its own algorithm for analyzing price changes and Price Action. Which gives you the advantage of recognizing, without delay, a new nascent trend with fewer false positives. Trend filtering conditions can be selected in the settings individually for your trading style. The indicator
Fractal Zig Zag
Mikhail Nazarenko
A   professional version of the ZigZag indicator for visualizing the structure of price movements by fractals. Fractal ZigZag fixes the flaws of the standard version of the ZigZag indicator MT4. It uses Price action and a unique filtering algorithm to determine fractals. Suitable for all types of trading. Ideal for trading according to the WM pattern "Sniper" strategy !!! Features Marks the place of price reversal during the formation of a new fractal with specified parameters. Suitable for al
Monster Harmonic Indicator
Paul Geirnaerdt
4.59 (29)
Monster Harmonics Indicator is a harmonic pattern indicator. It recognizes Gartley, Bat, Crab, Butterfly, Cypher, White Swan, Black Swan, Shark and several other patterns. Projected patterns that are not yet completed are recognized, too. Monster even shows the PRZ (Potential Reversal Zone). Users can add their own user defined patterns to Monster. Besides the current pattern, Monster also shows all patterns in the symbols history. Monster will provide alerts for developing patterns. Introduced
Free automatic fibonacci
Tonny Obare
4.68 (50)
Free automatic Fibonacci is an indicator that automatically plots a Fibonacci retracement based on the number of bars you select on the BarsToScan setting in the indicator. The Fibonacci is automatically updated in real time as new highest and lowest values appears amongst the selected bars. You can select which level values to be displayed in the indicator settings. You can also select the color of the levels thus enabling the trader to be able to attach the indicator several times with differe
FREE
이 제품의 구매자들이 또한 구매함
Trade Manager EA에 오신 것을 환영합니다. 이 도구는 거래를 보다 직관적이고 정확하며 효율적으로 만들기 위해 설계된 궁극적인 리스크 관리 도구 입니다. 단순한 주문 실행 도구가 아닌, 원활한 거래 계획, 포지션 관리 및 리스크 제어를 위한 종합 솔루션입니다. 초보자부터 고급 트레이더, 빠른 실행이 필요한 스캘퍼에 이르기까지 Trade Manager EA는 외환, 지수, 상품, 암호화폐 등 다양한 시장에서 유연성을 제공합니다. Trade Manager EA를 사용하면 복잡한 계산은 이제 과거의 일이 됩니다. 시장을 분석하고 진입, 손절 및 익절 수준을 차트의 수평선으로 표시한 후 리스크를 설정하면, Trade Manager가 이상적인 포지션 크기를 즉시 계산하고 SL 및 TP 값을 실시간으로 표시합니다. 모든 거래가 간편하게 관리됩니다. 주요 기능: 포지션 크기 계산기 : 정의된 리스크에 따라 거래 크기를 즉시 결정합니다. 간단한 거래 계획 : 진입, 손절, 익절을 위한
Exp COPYLOT CLIENT for MT4
Vladislav Andruschenko
4.69 (65)
MetaTrader 4용 전문 트레이드 복사기 MetaTrader 4 용 빠르고 안정적이며 전문적인 트레이드 복사기입니다. COPYLOT 은 MetaTrader 4 와 MetaTrader 5 터미널 간에 Forex 거래를 복사할 수 있으며, 다양한 계좌 유형과 운용 방식에 맞춰 유연한 동기화 환경을 제공합니다. COPYLOT MT4 버전 지원 방식: MetaTrader 4 → MetaTrader 4 MetaTrader 5 Hedge → MetaTrader 4 MetaTrader 5 Netting → MetaTrader 4   MT5 버전 상세 설명 + DEMO + PDF 구매 방법 설치 방법 로그 파일 확인 방법 테스트 및 최적화 방법 Expforex의 모든 제품 MetaTrader 5 버전 을 사용하면 MetaTrader 5 → MetaTrader 5 및 MetaTrader 4 → MetaTrader 5 복사도 지원됩니다: COPYLOT CLIENT for MT5 COPYLOT 은
TradePanel MT4
Alfiya Fazylova
4.84 (95)
Trade Panel은 다기능 거래 도우미입니다. 이 애플리케이션에는 50개 이상의 수동 거래 기능이 포함되어 있으며 대부분의 거래 작업을 자동화할 수 있습니다. 구매하기 전에 데모 계정에서 데모 버전을 테스트할 수 있습니다. 데모 계정용 애플리케이션 체험판 다운로드: https://www.mql5.com/en/blogs/post/750865 . 전체 지침 여기 . 거래. 한 번의 클릭으로 거래를 수행할 수 있습니다: 리스크 자동 계산과 함께 예약 주문 및 포지션 열기. 한 번의 클릭으로 여러 주문 및 포지션 열기. 주문 그리드 열기. 예약 주문 및 포지션을 그룹별로 닫기. 포지션 방향 전환 (Buy 닫기 > Sell 열기, Sell 닫기 > Buy 열기). 포지션 잠금 (부족한 포지션을 열어 Buy와 Sell 포지션의 수량을 동일하게 만들기). 모든 포지션 한 번의 클릭으로 부분적으로 닫기. 모든 포지션의 테이크 프로핏과 스톱로스를 같은 가격 수준에 설정. 모든 포지션의 스톱로스를
Riskless Pyramid
Snapdragon Systems Ltd
5 (1)
Introduction This powerful MT4 trade mangement EA offers a way potentially to aggressively multiply trade profits in a riskfree manner. Once a trade has been entered with a defined stoploss and take profit target then the EA will add three pyramid add-on trades in order to increase the overall level of profit. The user sets the total combined profit target to be gained if everything works out. This can be specified either as a multiple of the original trade profit or as a total dollar amount. Fo
The News Filter
Leolouiski Gan
5 (25)
이 제품은 뉴스 시간 동안 모든 전문가 어드바이저 및 수동 차트를 필터링하여 수동 거래 설정이나 다른 전문가 어드바이저가 입력한 거래가 파괴될 수 있는 급격한 가격 상승으로부터 걱정하지 않아도 됩니다. 이 제품은 또한 뉴스 발표 전에 열린 포지션과 대기 주문을 처리할 수 있는 완전한 주문 관리 시스템이 함께 제공됩니다. The News Filter  를 구매하면 더 이상 내장 뉴스 필터에 의존할 필요가 없으며 이제부터 모든 전문가 어드바이저를 여기서 필터링할 수 있습니다. 뉴스 선택 뉴스 소스는 Forex Factory의 경제 캘린더에서 얻어집니다. USD, EUR, GBP, JPY, AUD, CAD, CHF, NZD 및 CNY와 같은 어떤 통화 기준으로 선택할 수 있습니다. Non-Farm (NFP), FOMC, CPI 등과 같은 키워드 식별을 기준으로 선택할 수도 있습니다. 저, 중, 고 영향을 가지는 뉴스를 필터링할 수 있도록 선택할 수 있습니다. 차트와 관련된 뉴스만 선택하
Grid Manual MT4
Alfiya Fazylova
4.71 (17)
"Grid Manual"은 주문 그리드 작업을 위한 거래 패널입니다. 이 유틸리티는 보편적이며 유연한 설정과 직관적인 인터페이스를 제공합니다. 그것은 손실을 평균화하는 방향뿐만 아니라 이익을 증가시키는 방향으로 주문 그리드와 함께 작동합니다. 거래자는 주문 그리드를 만들고 유지할 필요가 없으며 유틸리티에서 수행합니다. 거래자가 주문을 시작하는 것으로 충분하며 "Grid Manual"는 자동으로 그를 위한 주문 그리드를 생성하고 거래가 마감될 때까지 그와 동행할 것입니다. 전체 설명 및 데모 버전 여기 . 유틸리티의 주요 기능: 모바일 터미널을 포함하여 어떤 방식으로든 열린 주문과 함께 작동합니다. "제한" 및 "중지"의 두 가지 유형의 그리드와 함께 작동합니다. 고정 및 동적(ATR 표시기 기반)의 두 가지 유형의 그리드 간격 계산과 함께 작동합니다. 오픈 오더 그리드의 설정을 변경할 수 있습니다. 차트에서 각 주문 그리드의 손익분기점 수준을 표시합니다. 각 주문 그리드에 대한 이익
Unlimited Trade Copier Pro is a tool to copy trade remotely to multiple MT4, MT5 and cTrader accounts at different computers/locations over internet. This is an ideal solution for you if you are a signal provider and want to copy your trades to other receivers globally on your own rules. One provider can copy trades to multiple receivers and one receiver can get trade from multiple providers as well. The provider can even set the subscription expiry for each receiver, so that receiver will not b
News Filter EA: Advanced Algo Trading Assistant News Filter EA is an advanced algo trading assistant designed to enhance your trading experience. By using the   News Filter EA , you can integrate a Forex economic news filter into your existing expert advisor, even if you do not have access to its source code. In addition to the news filter, you can also specify   trading days   and   hours   for your expert. The News Filter EA also includes   risk management   and   equity protection   features
Trade Manager MT4 DaneTrades
Levi Dane Benjamin
4.09 (11)
거래 관리자는 위험을 자동으로 계산하는 동시에 거래를 빠르게 시작하고 종료하는 데 도움을 줍니다. 과잉 거래, 복수 거래 및 감정 거래를 방지하는 데 도움이 되는 기능이 포함되어 있습니다. 거래를 자동으로 관리할 수 있으며 계정 성과 지표를 그래프로 시각화할 수 있습니다. 이러한 기능은 이 패널을 모든 수동 거래자에게 이상적으로 만들고 MetaTrader 4 플랫폼을 향상시키는 데 도움이 됩니다. 다중 언어 지원. MT5 버전  |  사용자 가이드 + 데모 트레이드 매니저는 전략 테스터에서 작동하지 않습니다. 데모를 보려면 사용자 가이드로 이동하세요. 위기 관리 % 또는 $를 기준으로 위험 자동 조정 고정 로트 크기 또는 거래량과 핍을 기반으로 한 자동 로트 크기 계산을 사용하는 옵션 RR, Pips 또는 Price를 사용한 손익분기점 손실 설정 추적 중지 손실 설정 목표 달성 시 모든 거래를 자동으로 마감하는 최대 일일 손실률(%)입니다. 과도한 손실로부터 계정을 보호하고 과도한
Ultimate Partial Profit EA
BLAKE STEVEN RODGER
4.67 (3)
This EA Utility delivers a robust solution for managing an unlimited array of open orders, both manual and automated. It enables customizable partial profit levels utilizing metrics such as pips, ratios, ATR (Average True Range), and profit amounts for precise trade management. The utility features an advanced on-screen display, offering clear visualization of all orders and their profit levels to enhance strategic decision-making and control. To evaluate its performance and interface, the EA s
PZ Trade Pad Pro MT4
PZ TRADING SLU
3.67 (3)
Effortlessly calculate lot sizes and manage trades to save time and avoid costly errors The Trade Pad Pro EA is a tool for the Metatrader Platform that aims to help traders manage their trades more efficiently and effectively. It has a user-friendly visual interface that allows users to easily place and manage an unlimited number of trades, helping to avoid human errors and enhance their trading activity. [ Installation Guide | Update Guide | Troubleshooting | FAQ | All Products ] One of the k
수동 매매를 위한 전문가용 트레이딩 패널로, 정밀한 진입부터 계좌 보호까지 매매의 전 과정을 차트 위 하나의 창에 담았습니다. 정해진 리스크에 정확히 맞춰 모든 포지션의 거래량을 산정하고, RR Tool로 차트에 직접 라인을 그려 거래를 설계하며, Market 주문과 예약 주문은 물론 Grid와 OCO까지 사용할 수 있습니다. 포지션 관리는 패널이 대신 처리합니다. 최대 다섯 단계 부분 청산, 여섯 가지 트레일링 스탑, 브레이크이븐, Virtual SL/TP를 지원합니다. 일간·주간·월간 한도가 예치금을 지키며, 기준을 넘기는 즉시 자동으로 발동됩니다. 가이드와 무료 Live 데모 무료 Live 데모 버전은 여기에서 이용할 수 있습니다 ( Free Live Demo ). 제품 사용 가이드는 여기에서 확인할 수 있습니다 ( User Manual ). NT Trade Manager는 트레이더의 모든 작업 흐름을 차트 위 작고 간결한 패널 하나에 모아, 터미널 창을 오갈 필요도, 진입할
거래하고자 하는 주요 영역을 파악한 후 자동으로 거래 지원 및 저항 또는 공급 및 수요 구역을 설정합니다. 이 EA를 사용하면 한 번의 클릭으로 매수 및 매도 구역을 그린 다음 가격이 바뀔 것으로 예상되는 정확한 위치에 배치할 수 있습니다. 그런 다음 EA는 해당 구역을 모니터링하고 구역에 대해 지정한 가격 액션에 따라 자동으로 거래를 수행합니다. 초기 거래가 수행되면 EA는 대상 구역이 되는 반대 구역에서 이익을 얻습니다. 그런 다음 거래를 종료하고 진입할 새 구역을 그리거나 이익을 얻고 즉시 반대 방향으로 거래를 역전하여 "항상 시장" 스타일 전략을 만드는 두 가지 선택이 있습니다. 입력 및 전략이 포함된 전체 매뉴얼은 여기에 있습니다: https://www.mql5.com/en/blogs/post/760256 이 EA는 시장에서 고정 또는 하드 스톱 로스를 사용하지 않는 포지션 트레이더 또는 달러 비용 평균 거래 전략을 위해 설계되었습니다. 대신, 다음에 가능한 지지 또는
목표 수익 도달 시 자동 수익 실현 EquityTargetCloser   — 는 MetaTrader 5용 유틸리티 전문가 어드바이저(EA)로,   순자산(Equity)이 현재 잔고를 지정된 수익 금액만큼 초과하면 모든 시장 포지션을 청산하고 예약 주문을 삭제합니다. 모든 포지션을 청산한 후 목표는 자동으로 상향 조정됩니다. 새 임계값 = 새 잔고 + 지정된 수익. EA는 거래를 시작하지 않고 기존 포지션만 관리하여 수익을 확실하게 고정하고 축적된 자금을 보호합니다. MT5-version:  https://www.mql5.com/en/market/product/169839 작동 방식 전문가 어드바이저는   순자산(Equity)   을 동적 목표와 지속적으로 비교합니다. 목표 =   현재 잔고(Balance) + plusMoney   (미국 달러). 순자산이 이 금액 이상이 되면 보호 기능이 작동합니다.   모든 시장 포지션   (모든 심볼)을 청산합니다. 매개변수   Delete p
The product will copy all telegram signal to MT4   ( which you are member  ) , also it can work as remote copier.  Easy to set up, copy order instant, can work with almost signal formats, image signal, s upport to translate other language to English Work with all type of channel or group, even channel have "Restrict Saving Content", work with  multi channel, multi MT5 Work as remote copier: with signal have ticket number, it will copy exactly via ticket number. Support to backtest signal. How to
DrawDown Limiter MT4
Haidar Lionel Haj Ali
5 (8)
Drawdown Limiter EA You are in the right place if you were searching for Drawdown control, Drawdown limiter, Balance protection, Equity Protection or Daily Drawdown Limit related to Prop Firm, FTMO, or Funded account trading, or if you want to protect your trading account. Have you suffered from controlling your drawdown when trading funded accounts? This EA is meant for you. Prop firms usually set a rule called “Trader Daily Drawdown”, and if it is not respected, you are disqualified.  I am an
VirtualTradePad PRO SE MT4 — MetaTrader 4용 고급 트레이딩 패널 및 차트 워크스페이스 VirtualTradePad PRO SE 는 MetaTrader 4 용 전문 트레이딩 패널이자 거래 관리 워크스페이스입니다. 하나의 차트 기반 인터페이스에서 거래를 더 빠르게 열고, 관리하고, 보호하고, 닫고, 분석할 수 있도록 도와줍니다. 이 제품은 단순한 버튼 모음 이상의 기능이 필요한 적극적인 수동 트레이더를 위해 만들어졌습니다. PRO SE는 원클릭 실행, 예약 주문, 포지션 제어, 부분 청산, 바스켓 손익 로직, 평균가 레벨, ATM 규칙, 신호 모니터링, 시장 정보, 전략 테스터 워크플로, VPS 중심 준비를 하나의 구조화된 워크스페이스로 통합합니다. MT5 버전 | 전체 설명 및 스크린샷 | 구입 방법 | 설치 방법 | 로그 파일을 얻는 방법 | 테스트 및 최적화 방법 | Expforex의 모든 제품 일반 수동 트레이딩 대비 장점 여러 창 대신 하나의 워
Custom Alerts AIO: 다중 시장을 동시에 모니터링 – 설정 없이 즉시 사용 가능 개요 Custom Alerts AIO 는 복잡한 설정 없이 즉시 사용할 수 있는 통합 시장 모니터링 도구입니다. FX Power, FX Volume, FX Dynamic, FX Levels, IX Power 등 필요한 모든 지표가 내장되어 있어 별도의 설치나 구성 없이 알림 기능을 바로 사용할 수 있습니다. 차트 그래픽 없이 작동하며, Forex, 금속, 지수, 암호화폐 등 주요 자산군을 모두 지원합니다. 주식(Symbols)은 별도로 입력하여 추가할 수 있으나, MetaTrader에서는 일반적으로 제한적으로만 사용됩니다. 1. 왜 Custom Alerts AIO를 선택해야 하나요? 추가 라이선스가 필요 없습니다 • 모든 Stein Investments 지표가 내장되어 있어 별도 구매가 필요 없습니다. • 즉시 알림 기능을 시작할 수 있어 빠르고 간편합니다. 모든 시장을 하나의 도구로
VirtualTradePad mt4 Extra
Vladislav Andruschenko
4.85 (61)
한 번의 클릭으로 거래할 수 있는 거래 패널.   위치 및 주문 작업!   차트 또는 키보드에서 거래. 거래 패널을 사용하면 차트에서 클릭 한 번으로 거래하고 표준 MetaTrader 컨트롤보다 30배 빠르게 거래 작업을 수행할 수 있습니다. 거래자의 삶을 더 쉽게 만들고 거래자가 훨씬 빠르고 편리하게 거래 활동을 수행할 수 있도록 도와주는 매개변수 및 기능의 자동 계산. 차트의 무역 거래에 대한 그래픽 팁 및 전체 정보. 새로운 프리미엄 버전 출시:   VirtualTradePad PRO SE 로 트레이딩 워크플로를 업그레이드하세요.   MetaTrader 5   및   MetaTrader 4 를 위한 차세대 전문 트레이딩 패널입니다. MT5 버전 전체 설명   +DEMO +PDF 구입 방법 설치하는 방법     로그 파일을 얻는 방법     테스트 및 최적화 방법     Expforex의 모든 제품 열기 및 닫기, 반전 및 잠금, 부분 닫기/오토로트. 가상/실제 손절매/이익
MACD Divergence Scanner is a multi-timeframe and multi-symbol dashboard and alert that checks all timeframes and symbols to find regular and hidden divergences between price chart and MACD indicator. This divergence scanner is integrated with support and resistance zones so you can check the MACD divergences in the most important areas of the chart to find trend reversals in the price chart. Download demo version   (works on M 1,M5,M30,W1   timeframes) Full description of scanner parameters ->  
MT4 to Telegram Signal Provider 는 사용하기 쉽고 완전히 사용자 정의가 가능한 도구로, 텔레그램으로 신호를 보내어 계정을 신호 제공자로 변환할 수 있습니다. 메시지 형식은 완전히 사용자 정의가 가능합니다! 그러나 간단한 사용을 위해 미리 정의된 템플릿을 선택하고 메시지의 특정 부분을 활성화하거나 비활성화할 수도 있습니다. [ 데모 ]  [ 매뉴얼 ] [ MT5 버전 ] [ 디스코드 버전 ] [ 텔레그램 채널 ]  New: [ Telegram To MT5 ] 설정 단계별 사용자 가이드 가 제공됩니다. 텔레그램 API에 대한 지식이 필요 없으며, 개발자가 필요한 모든 것을 제공합니다. 주요 기능 구독자에게 보낸 주문 세부 정보를 사용자 정의할 수 있는 기능 예를 들어 브론즈, 실버, 골드와 같은 계층 구독 모델을 만들 수 있습니다. 골드 구독은 모든 신호 등을 받게 됩니다. ID, 심볼 또는 코멘트별 주문 필터링 주문이 실행된 차트의 스크린샷을 포함 보낸
Support and Resistance Dashboard for MT4 is a multi-timeframe and multi-symbol scanner and alert system that finds S/R zones and pivot points for all timeframes and symbols and alerts when price has interaction with them. If you are using support and resistance (or supply and demand) zones in your trading strategy, this dashboard and its alert and filtering system is a big time saver for you. Download demo version   (works on M 1,M5,M30,W1   timeframes) Full description of scanner parameters ->
Telegram to MT4 Multi-Channel Copier 는 Telegram 채널의 트레이딩 신호를 자동으로 MetaTrader 4로 직접 복사합니다. 봇도, 브라우저 확장 프로그램도, 수동 복사도 필요 없습니다. Telegram에서 신호를 받으면 EA가 몇 초 안에 터미널에서 거래를 엽니다. 본 제품은 두 가지 구성 요소로 구성되어 있습니다: Telegram 채널을 감시하는 Windows 애플리케이션과 MT4 터미널에서 신호를 실행하는 이 Expert Advisor입니다. MT5 버전도 제공됩니다. 설정 가이드 및 애플리케이션 다운로드: https://www.mql5.com/en/blogs/post/768988 작동 방식 Windows 애플리케이션은 봇이 아닌 사용자 자신의 API 자격 증명을 사용하여 Telegram에 연결됩니다. 이는 프라이빗 및 VIP 채널을 포함하여 구독 중인 모든 채널, 그룹 또는 주제를 읽을 수 있음을 의미합니다. 신호를 감지하면 이를 파싱하여
Telegram to MT4 Coppy
Sergey Batudayev
4.09 (11)
Telegram에서 MT4로:   최고의 신호 복사 솔루션 최첨단 유틸리티인   Telegram to MT4를   사용하여 거래를 간소화하세요. DLL 없이도 Telegram 채널과 채팅에서 MetaTrader 4 플랫폼으로 거래 신호를 직접 복사할 수 있습니다. 이 강력한 솔루션은 탁월한 정밀도와 맞춤 설정 옵션을 통해 원활한 신호 실행을 보장하여 시간을 절약하고 효율성을 높여줍니다. [ Instructions and DEMO ] 주요 특징 직접 Telegram API 통합 전화번호와 보안 코드를 통해 인증하세요. 사용자 친화적인 EXE 브리지를 사용하여 채팅 ID를 손쉽게 가져오고 관리하세요. 여러 채널/채팅을 추가, 삭제, 새로 고침하여 동시에 신호를 복사합니다. 고급 필터를 사용한 신호 파싱 사용자 정의 예외 단어(예: "보고서", "요약")가 포함된 원치 않는 신호를 건너뜁니다. 유연한 SL 및 TP 형식을 지원합니다: 가격, 핍 또는 포인트. 신호가 가격 대신 지점을 지정
위험 대비 수익률 관리자(Risk to Reward Ratio Manager)는 체계적인 거래와 전문적인 위험 관리를 지원하도록 설계된 시각적 주문 관리 도구이자 포지션 규모 계산기입니다. 트레이더는 차트에서 진입, 손절매, 이익실현 수준을 시각적으로 직접 설정할 수 있으며, 주문을 전송하기 전에 랏 규모와 위험 대비 수익률을 자동으로 계산합니다. 이 도구는 거래 준비를 표준화하고 각 포지션이 미리 정의되고 통제된 위험 수준에서 개시되도록 보장합니다. 이 도구는 통화쌍, 지수, 금속, 상품, 암호화폐 등 다양한 거래 상품을 지원합니다. 수동 트레이더와 모든 포지션에 위험 관리 규칙을 적용하는 전략 중심 트레이더 모두에게 적합합니다. 계산 시간을 단축하고 수동 오류를 방지함으로써 트레이더가 체결 과정에서 일관성과 명확성을 유지할 수 있도록 지원합니다. 위험 대 보상 비율 관리자       설치 및 입력 가이드 EA 추가 URL에 대한 알림을 받으려면 (       http://www.
Strategy Builder offers an incredible amount of functionality. It combines a trade panel with configurable automation (covert indicators into an EA), real-time statistics (profit & draw down) plus automatic optimization of SL, TP/exit, trading hours, indicator inputs. Multiple indicators can be combined into an single alert/trade signal and can include custom indicators, even if just have ex4 file or purchased from Market. The system is easily configured via a CONFIG button and associated pop-up
Auto Trade Copier
Vu Trung Kien
4.76 (85)
Auto Trade Copier is designed to copy trades to multiple MT4, MT5 and cTrader accounts/terminals with 100% accuracy. The provider and receiver accounts must be on the same PC/VPS. With this tool, you can copy trades to receiver accounts on the same PC/VPS. All trading actions will be copied from provider to receiver perfectly. This version can be used on MT4 accounts only. For MT5 accounts, you must use Auto Trade Copier for MT5 . Reference: - For MT4 receiver, please download Trade Receiver Fre
Coppy Master MT4
Sergey Batudayev
4 (3)
카피 마스터 MT4       MetaTrader 4 및 MetaTrader 5 터미널용 트레이딩 복사 도구입니다. 양방향 복사를 지원합니다. MT4에서 MT5로, MT5에서 MT4로, 그리고 동일 유형의 계정 간 MT4에서 MT4로. 올바르게 작동하려면 모든 터미널이 동일한 PC나 VPS에서 실행되어야 합니다. [ Instruction  and Demo ]  MetaTrader 4에 복사하려면 별도 버전이 필요합니다.       카피마스터 MT5       — 필수입니다. 주요 특징: 복사 모드 마스터 및 리시버 역할을 모두 지원합니다. 거래 송수신을 위한 유연한 설정이 가능합니다. 주문 관리 시장가 및 보류 주문을 복사합니다. 동기화 및 부분 마감, 매매 반전, 손절매/실현가 수정을 지원합니다. 심볼 처리 접두사와 접미사를 지원합니다. 특정 기호를 제외하거나 포함하고, 자산에 사용자 지정 이름을 지정할 수 있습니다. 위험 관리 및 한도 일일 거래 한도, 최대 손실 한도,
TradeMirror 은 MT4/MT5 플랫폼을 위해 특별히 설계된 현지화된 주문 복사 도구로, 실시간 거래 작업을 동기화합니다. 튜토리얼 더 많은 튜토리얼을 보려면 Trademirror 튜토리얼 링크를 클릭하세요. 제품 장점 금융 소프트웨어의 보안성, 안정성 및 개인정보 보호에 대한 높은 표준 요구사항을 기반으로, 우리는 세 가지 핵심 차원에서 심층 최적화를 수행했습니다: 직관적이고 간결한 그래픽 인터페이스로 누구나 쉽게 조작 가능 강화된 개인정보 보호 메커니즘으로 금융 환경의 민감한 데이터 격리 요구 충족 밀리초 단위의 주문 동기화로 신호 분배의 정확성과 지연 없음 보장 MT4/MT5 양 플랫폼과 완전히 호환되어 다양한 거래 환경에 원활하게 적용 지능형 시스템 모니터링과 이메일 알림을 결합하여 거래 안정성을 실시간으로 보장 핵심 기능 특성 제품은 다음과 같은 전문적인 복사 기능을 탑재하고 있습니다: 다중 계정 병렬 연결 이메일 실시간 푸시 맞춤형 로트 크기 조정 신호 필터링 메커
EasyTrade MT4
Alain Verleyen
5 (1)
Easy Trade – 스마트하고 간단하며 강력한 트레이드 관리 Easy Trade는 리스크를 철저히 관리하고 실행을 더욱 원활하게 하려는 MetaTrader 사용자들을 위한 올인원 트레이드 관리 솔루션입니다. 트레이더들의 피드백을 바탕으로 처음부터 설계된 Easy Trade는 여러 종목의 거래를 간단하게 실행, 모니터링 및 관리할 수 있도록 하며, 작업 흐름을 복잡하게 만들지 않습니다. 수동 스캘핑이든, 소규모 전략 포트폴리오 관리든, Easy Trade는 트레이더가 현명한 판단과 안정적인 수익에 집중할 수 있도록 돕습니다. ⸻ Easy Trade를 사용해야 하는 이유 정밀한 리스크 관리: 고정 로트 또는 퍼센트 기반 리스크 설정 가능. 실시간 리스크 및 수익률 정보 제공. 바스켓 기반 트레일링: 여러 거래의 수익을 모니터링하고 목표 달성 시 이익을 부분 확정 가능. 군집 진입에 이상적. 거래 캡처: 각 거래를 스크린샷으로 기록 가능 – 트레이딩 저널 및 성과 분석에 적합.
제작자의 제품 더 보기
It is widely known that colors affect the emotional state of a human, especially if this human is a trader. Psychologists recommend that you follow your instincts and select the color of your environment that is most comfortable to you. In order to reduce emotional stress, impact of colors on a person should be considered. The optimal range of the most beneficial colors includes green, yellow-green and green-blue ones. This indicator allows you to manage your emotional state and health. Choose a
FREE
This is an interactive and easy-to-set indicator which allows to form seven equally spaced channels which have your settings simultaneously. All seven channels are enabled by default. But you can easily enable one or another channel using control buttons located in the upper case of the indicator's control panel. You can change a period of the indicator calculation by clicking one of buttons indicating number of the channel in the lower case of the control panel. Two other buttons (one of them i

This EA represents an interactive panel with adjustable parameters destined for installation and deletion of pending orders (orders grid generator). You can place the panel anywhere on the screen or hide it into a dot clicking on the button in the upper left part of the chart (it will be shown after clicking on it for the second time). Number and step of orders, lot size, vertical shift for limit orders - all these things make your work easier. There are functions for restoring according to pend
Equidistant channel
Valeriy Medvedev
The purpose of the indicator is drawing an equidistant channel. It is somewhat different from the traditional model. The choice of control parameters is simple and does not require any special description. Enter the calculation interval in hours and the solution to the problem will appear on the screen. Please note that the time involved in calculation of the channel must be greater than the timeframe it will be displayed on. If the parameters you enter are beyond the allowable limits, you will
This indicator is designed for drawing equidistant channels. Two options are available: based on the number of hours in the indicator calculation and by the number of bars. To draw a channel, enter a number 1 or greater. The maximum value is limited by the amount of visible bars. If the parameters you enter are beyond the allowable limits, you will get notified if the indicator restrictions. Please note that the time involved in calculation of the channel must be greater than the timeframe it wi
ZigZag on average
Valeriy Medvedev
This is a well-known ZigZag indicator. But it differs by the fact that its plot is based on values of the middle line which is set by a user. It can display Andrews’ Pitchfork and standard or Bobokus Fibo levels. NO REPAINTING. Parameters Period МА — middle line period. Default value is 34. Minimum value is 4. Maximum value is set at your discretion. Used to calculate price - base price to calculate the middle line. The averaging method - method of smoothing the middle line. Turning pitchfork —
The indicator displays the moving average of all periods on one chart. It shows the MA of a one step lower timeframe and all the MAs equal to and higher than it. Parameters Period moving average - Moving Average period (default is 34); Used to calculate price - price used for the MA calculation (default is the average price = (high+low)/2); The averaging method - default is linear-weighted; Moving average shift - MA shift (default is 0). Just enter the MA calculation period and its parameters,
Desk Analytical Table Portfolio Monitoring for Active Traders Overview: The Desk Analytical Table indicator is a professional tool designed for traders managing multiple financial instruments simultaneously. It consolidates key data on open positions, orders, and market statistics into a single window, ensuring seamless portfolio control even during high-intensity trading sessions. Key Features: ️ Multi-Instrument Analysis - Monitor up to 30 assets in real time with quick switching between inst
This is a prototype of the famous Control and management of transactions panel. There are two main differences: Allows to work with all the variety of financial instruments opened by a user and not only with instruments it was attached to; To activate levels of order closure hidden from a broker, it uses not lines but modifiable virtual levels. To enjoy the full functionality of the panel you are advised to have: Desk analytical table . Their combined operation allows to keep the situation under
Inform Panel For ALL Symbols — Advanced Multi-Instrument Trading Management The Inform Panel For ALL Symbols is a sophisticated trading management tool designed to streamline control over all financial instruments in a trader’s portfolio, eliminating the need to attach it to specific charts. Its core innovation lies in using modifiable virtual levels for stop loss (SL) and take profit (TP), allowing discreet order closure hidden from brokers. The panel automatically detects and lists all active
The indicator is based on the two-buffer scheme and does not require any additional settings. It can be used on any financial instrument without any restrictions. The indicator is a known ZigZag, but it does not redraw . The indicator allows to easily detect significant levels on the price chart, as well as demonstrates the ability to determine the probable direction of a price movement. The calculations are based on the candles' Close prices, thus improving the reliability of the levels. Param
The idea of the indicator stems from the necessity to clearly define the borders of support and resistance levels, which helps to plan the opening and closing of positions in the areas that most appropriately determine the process. Look at the breakdowns of the resistance level that confirm the intention of the price to continue the upward movement, after it passed the support level and entered the channel formed by the two levels. The same is for the case when the price enters the channel downw
This indicator is a logical extension of the product at https://www.mql5.com/en/market/product/12526 . The only difference is that price movement is displayed using a histogram with levels, allowing to assess the direction and strength of the movement. How to interpret the signal: 0 - the middle of the channel; above 0.5 - the breakdown of the channel up; below -0.5 - the breakdown of the channel down. Both indicators are displayed in the attached screenshots. Install the indicator and you will
Simple Line
Valeriy Medvedev
The indicator shows the levels of the past week and day. In addition, it draws a level in percentage. This level is specified relative to the difference between the High and Low of the past month and week. For the daily levels of the past day, the Close levels are additionally displayed. All you need to do is configure the display parameters of the levels to your liking. Parameters Over the past months installations - settings for the last months; PasteMonthsLines - the level display mode is on
This indicator is the logical continuation of the well-known equidistant channel indicator: https://www.mql5.com/en/market/product/8723 . The main purpose of the indicator is the visualization of price levels relative to the parallel channel using Fibo Bobokus levels in a separate window and the price history. This often allows forecasting the future price movement with a sufficiently high degree of probability. The Fibo levels calculation equation is as follows: FiboLevel = (50-(100*((Close[i]-
This simple to use utility allows opening charts from the list of financial instruments by left clicking their names. The chart window is opened using the Default template. The template name can be changed to one of those stored in Charts-Templates section of the terminal. It is possible to customize the background colors of panels and their labels, and also to select the display type for a more comfortable working environment. This is all you need to know in order to see the result quickly. Pa
If you need to quickly evaluate the results of trading on a current financial instrument by hypothetical price movement in the chosen direction and up to a certain level, set the indicator on any chart that contains open positions and move the line to the desired level after it appears together with the results tab. This is all you need to understand what happens to your deposit if the price is at this level without taking into account existing stop loss and take profit. Enable considering pendi
This indicator displays a set of moving average lines across all higher timeframes. The indicator can be installed on any financial instrument and any timeframe. For the analysis of the lines, a panel with timeframe values is provided in the lower right corner. Using the panel, you can easily enable/disable the display of the MA line of any higher timeframe. This allows a more thorough analysis of the market situation. The color of the button matches the color of the moving average line. Parame
This indicator is designed for monitoring RSI levels on the current and higher timeframes. The control panel is user friendly and consists of buttons, with which you can control the display of lines as per the names of the buttons. The button color matches the line color. Parameters "___| Settings of the main indicator " RSI Period - averaging period for index calculation (default is 14); RSI Price type - price used for calculations (default is the Close price); "___| Color palette " Text color
Этот индикатор предназначен для контроля уровней CCI на текущем и старших от него таймфреймах. Панель управления проста в понимании и состоит из кнопок, с помощью которых можно управлять отображением линий, соответствующим указанным на наименовании кнопок. Цвет кнопки совпадает с цветом линии. Этот индикатор из серии подобных индикаторов, которые уже успели завоевать популярность: https://www.mql5.com/ru/market/product/30276 и https://www.mql5.com/ru/market/product/30403 Параметры "___| Setti
This is a well-known ZigZag indicator. But it differs by the fact that its plot is based on values of the middle line which is set by a user. It can display Andrews’ Pitchfork and standard or Bobokus Fibo levels. NO REPAINTING. Parameters Period МА — middle line period. Default value is 34. Minimum value is 4. Maximum value is set at your discretion. Used to calculate price — type of price used for the midline calculations. The averaging method — type of smoothing for the middle line. Turning p
The indicator is similar to https://www.mql5.com/en/market/product/12330 . However, it considers the MQL5 platform features. Peaks and bottoms are calculated based solely on external bars. After a swing is formed, the indicator does not redraw providing opportunities for traders working on horizontal level breakthroughs. Traffic can be reduced by changing the amount of calculated bars in the MinBars variable (default value is 500). All you need is to select the output options, so that you can se
The indicator is based on the two-buffer scheme and does not require any additional settings. It can be used on any financial instrument without any restrictions. The indicator is a known ZigZag, but it does not redraw . The indicator allows to easily detect significant levels on the price chart, as well as demonstrates the ability to determine the probable direction of a price movement. The calculations are based on the candles' Close prices, thus improving the reliability of the levels. Param
It is an analogue of the indicator of levels at https://www.mql5.com/en/market/product/24273 for the MetaTrader 5 platform. The indicator shows the levels of the past month, week and day. In addition, it draws a level in percentage relative to the difference between the High and Low of the past month and week. For the daily levels of the past day, the Close levels are additionally displayed. All you need to do is to configure the display parameters of the levels to your liking. In some cases, af
필터:
Snova
164
Snova 2019.09.28 02:54 
 

사용자가 평가에 대한 코멘트를 남기지 않았습니다

Chris Mukengeshayi
1749
Chris Mukengeshayi 2019.02.01 13:56 
 

사용자가 평가에 대한 코멘트를 남기지 않았습니다

Matthew Todorovski
13134
Matthew Todorovski 2018.06.12 16:07 
 

사용자가 평가에 대한 코멘트를 남기지 않았습니다

리뷰 답변