Simple Line

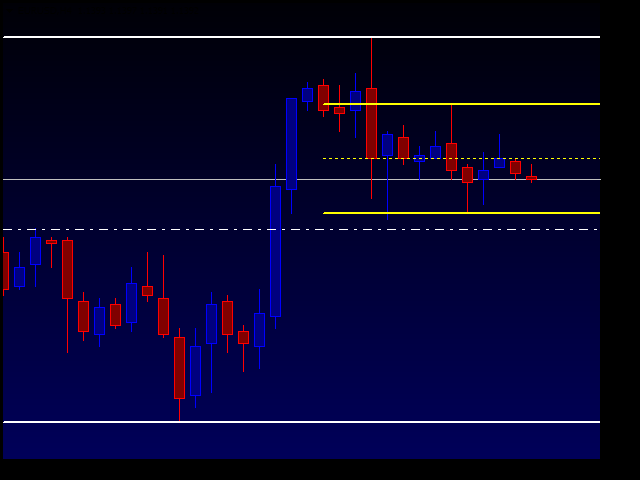
The indicator shows the levels of the past week and day. In addition, it draws a level in percentage. This level is specified relative to the difference between the High and Low of the past month and week. For the daily levels of the past day, the Close levels are additionally displayed. All you need to do is configure the display parameters of the levels to your liking.


Parameters

  • Over the past months installations - settings for the last months;
    PasteMonthsLines - the level display mode is on (off);
    InpPastMonth - the number of months in the calculation of lines (default: 12):
    TypeLinesP_M - type of line for displaying levels;
    InpWidthLinesP_M - thickness of the line displaying the levels;
    InpMonthly_P_Level - enable (disable) the line level in percent;
    PercentageP_M - line level as a percentage of the range of highs and lows. Default = 50;
    TypeLinesP_M_P - line type as a percentage of the range of highs and lows;
    InpWidthLinesP_M_P- line thickness as a percentage of the range of highs and lows;
    ColorLinesP_M_P - line color;
  • Monthly installations - monthly settings;
  • MonthlyLines - enable (disable) displaying the levels;
  • TypeLinesM - line type to display the levels;
  • InpWidthLinesM - line width to display the levels;
  • InpMonthlyPercentageLevel - enable (disable) line level in %;
  • PercentageM - level of the line set as a percentage of the High-Low range. Default = 50;
  • TypeLinesM - type of the line set as a percentage of the High-Low range;
  • InpWidthLinesM - width of the line set as a percentage of the High-Low range;
  • ColorLinesM - line color;
  • Weekly installations - weekly settings;
  • WeeklyLines - enable (disable) displaying the levels;
  • TypeLinesW - line type to display the levels;
  • InpWidthLinesW - line width to display the levels;
  • InpWeeklyPercentageLevel - enable (disable) line level in %;
  • PercentageW - level of the line set as a percentage of the High-Low range. Default = 50;
  • TypeLinesPW - type of the line set as a percentage of the High-Low range;
  • InpWidthLinesPW - width of the line set as a percentage of the High-Low range;
  • ColorLinesW - line color;
  • Daylight settings - daily settings;
  • PreviousDayLines - enable (disable) displaying the levels;
  • TypeLinesPDL - line type to display the levels;
  • InpWidthLinesPDL - line width to display the levels;
  • InpDayCloseLevel - enable (disable) line level of the day closure;
  • TypeLinesPDLClose - line type of the daily Close level;
  • InpWidthLinesPDLClose - line width of the daily Close level;
  • ColorLinesPDL - line color;
  • The first trading day of the week - the first trading day of the week (default is Monday);
  • The last trading day of the week - the last trading day of the week (default is Friday).
추천 제품
Double HMA lines MTF
Pavel Zamoshnikov
5 (1)
This is a multi-timeframe version of the popular Hull Moving Average (HMA). The Double HMA MTF Light indicator combines two timeframes on a single chart. The HMA of the higher timeframe defines the trend, and the HMA of the current timeframe defines short-term price movements. The indicator is freely distributed and hasn't audio signals or messages. Its main function is the visualization of price movements. If you need advanced functionality of the HMA multi-timeframe indicator (information ab
FREE
Ppr PA
Yury Emeliyanov
4.5 (2)
"Ppr PA" is a unique technical indicator created to identify "PPR" patterns on the currency charts of the MT4 trading platform. These patterns can indicate possible reversals or continuation of the trend, providing traders with valuable signals to enter the market. Features: Automatic PPR Detection:   The indicator automatically identifies and marks PPR patterns with arrows on the chart. Visual Signals:   Green and red arrows indicate the optimal points for buying and selling, respectively. Ar
FREE
Power Trend Free
Yurij Kozhevnikov
5 (2)
Power Trend Free - the indicator shows the trend strength in the selected period. Input Parameters The indicator has three input parameters: Period - a positive number greater than one, it shows the number of candlesticks used for calculations. If you enter one or zero, there will be no error, but the indicator will not be drawn. Applied Price - the standard "Apply to:" set meaning data used for the indicator calculation: Close - Close prices; Open - Open prices; High - High prices; Low - Low p
FREE
Extremum Reverse Bar
Yurij Izyumov
2.8 (5)
This indicator has been created for finding the probable reversal points of the symbol price. A small candlestick reversal pattern is used it its operation in conjunction with a filter of extremums. The indicator is not redrawn! If the extremum filter is disabled, the indicator shows all points that have a pattern. If the extremum filter is enabled, the condition works – if the history Previous bars 1 candles back contains higher candles and they are farther than the Previous bars 2 candle, such
FREE
The indicator detects and displays М. Gartley's Butterfly pattern. The pattern is plotted by the extreme values of the ZigZag indicator (included in the resources, no need to install). After detecting the pattern, the indicator notifies of that by the pop-up window, a mobile notification and an email. The pattern and wave parameters are displayed on the screenshots. The default parameters are used for demonstration purposes only in order to increase the amount of detected patterns. Parameters z
Trend Ray
Andriy Sydoruk
The indicator shows the potential trend direction by cyclical-wave dependence. Thus, all the rays of the intersection will be optimal rays, in the direction of which the price is expected to move, taking into account the indicator period. Rays can be used as a direction for potential market movement. But we must not forget that the approach must be comprehensive, the indicator signals require additional information to enter the market.
Adapter
Yvan Musatov
Индикатор Adapter определяет господствующую тенденцию, помогает анализировать рынок на выбранном временном интервале. Прост в настройке и работает на всех парах и всех временных интервалах. Индикаторы тренда дают возможность классифицировать направление ценового движения, определив его силу. Решение этой проблемы помогает инвесторам вовремя войти в рынок и получить хорошую отдачу. Для любого трейдера крайне важно правильно определить направление и силу трендового движения. К сожалению, единств
ColorTrendStd
ANTON BELOUSOV
Индикатор использует сложный алгоритм, который позволяет ему обнаруживать потенциальные развороты тренда. На основе его кода, индикатор сравнивает движение цены со средним диапазоном свечей. Так же индикатор показывает места флета где появляется разворот и приостанова движения цены Работает на любой валютной паре, с любым таймфреймом Дополнительно можно встроить передачу сигналов в телеграм, Выбор цветов позволяет пользователю настроить свою цветовую гамму.
The indicator detects and displays Shark harmonic pattern (see the screenshot). The pattern is plotted by the extreme values of the ZigZag indicator (included in the resources, no need to install). After detecting the pattern, the indicator notifies of that by a pop-up window, a mobile notification and an email. The indicator highlights the process of the pattern formation and not just the complete pattern. In the former case, it is displayed in the contour triangles. After the pattern is comple
Wise Men Indicator demo
Bohdan Kasyanenko
3 (2)
The indicator displays signals according to the strategy of Bill Williams on the chart. Demo version of the indicator has the same features as the paid, except that it can work only on a demo account . Signal "First Wise Man" is formed when there is a divergent bar with angulation.  Bullish divergent bar - with lower minimum and closing price in the upper half. Bearish divergent bar - higher maximum and the closing price at the bottom half. Angulation is formed when all three lines of Alligator
FREE
FlatBreakout
Aleksei Vorontsov
FlatBreakout (Free Version) Flat Range Detector and Breakout Panel for MT4 — GBPUSD Only FlatBreakout is the free version of the professional FlatBreakoutPro indicator, specially designed for flat (range) detection and breakout signals on the GBPUSD pair only. Perfect for traders who want to experience the unique fractal logic of FlatBreakout and test breakout signals on a live market without limitations. Who Is This Product For? For traders who prefer to trade breakout of flat ranges (breakout,
FREE
하모닉 패턴은 시장 반전점을 예측하는 데 가장 적합합니다. 이러한 패턴은 높은 승률과 하루 동안 다양한 거래 기회를 제공합니다. 저희 인디케이터는 하모닉 트레이딩 문헌에 기반하여 가장 인기 있는 하모닉 패턴을 식별합니다. 중요 사항: 이 인디케이터는 다시 그리지 않으며 (D 지점에서 패턴을 감지함), 따라잡지 않습니다 (패턴이 유효하거나 취소됨). 사용 방법: MT5 차트에 인디케이터를 끌어다 놓으세요. 패턴 감지를 TRUE로 설정하세요 (ABCD; Gartley). 원하는대로 편차를 조정하세요 (높은 편차는 더 많은 패턴, 낮은 편차는 더 적은 패턴). 색상을 원하는 대로 사용자 정의하세요. 필요에 따라 ENTRY POINT, TP 및 SL에 대한 경고를 활성화하거나 비활성화하세요. 패턴 감지 시: 알고리즘은 D 지점에서 패턴을 감지합니다. 경고가 활성화되어 있으면 패턴 감지에 대한 알림을 보냅니다. 패턴이 무효화되면 "패턴 취소"라는 메시지가 포함된 경고가 트리거됩니다. 성공적인
FREE
LordChannel
Igor Pereira Calil
LordChannel is an indicator for META TRADER 4 for all forex pairs and financial market metals. The indicator is used to make detections of high/low channels, implementing a technical analysis on possible breakouts and making correct order entries. LordChannel sends signals such as buy and sell in the graphical analysis, it is important to emphasize that the importance of these signals are safe in TIME FRAMES M30, H1, H4. The indicator was created for using bullish/downtrend channels to compl
Schaff Trend Cycle이란? Schaff Trend Cycle(STC)은 추세 전환을 신속하게 포착하기 위해 설계된 오실레이터형 보조지표입니다. 기존의 이동 평균선이나 MACD와 달리, 시장의 주기적 흐름과 모멘텀을 결합하여 추세의 시작과 끝을 보다 명확하게 파악할 수 있도록 도와줍니다. 주요 특징 명확한 추세 전환 신호: 상승 추세에서는 STC 라인이 상승하고, 하락 추세에서는 하락합니다. 횡보장에서의 노이즈 감소: 주기 기반의 스무딩 처리를 통해 단기적인 변동을 억제합니다. 간편한 파라미터 조정: 기간 및 스무딩 설정을 통해 초보자부터 고급 사용자까지 폭넓게 활용할 수 있습니다. 계산 로직 개요 모멘텀 계산 설정된 기간 동안의 가격 변화를 기반으로 단기 및 장기 모멘텀을 계산합니다. 주기적 스무딩 모멘텀에 대해 이중 스무딩 처리를 적용하여 주기적인 진동 성분을 추출합니다. 정규화 처리 결과값을 0~100 사이로 정규화하여 오실레이터로 표시합니다. 신호 생성 일반
FREE
WPR Breakout MT4
Mohamed Hassan Mohamed Hassan Alsherbiny
When prices breakout resistance levels are combined with   Larry Williams' Percentage Range "WPR"   oscillator breaks out its historical resistance levels then probability emerges to record farther prices.   It's strongly encouraged to confirm price breakout with oscillator breakout since they have comparable effects to price breaking support and resistance levels; surely, short trades will have the same perception. Concept is based on find swing levels which based on number of bars by each side
FREE
FletBoxPush
Iurii Tokman
FletBoxPush   표시기는 지정된 매개 변수에 따라 가격 변동의 평평한 영역을 결정합니다. 설정: TimeFrames - 차트 기간 선택. FlatPips - 플랫을 결정하기 위한 포인트 제한 FlatBars - 플랫을 결정하기 위한 막대 수의 제한 CountBars - 가격 움직임을 분석하기 위한 기록의 막대 수, 0에서 기록의 모든 막대가 분석됩니다. 색상 - 플랫으로 정의된 가격대의 색상 PriceTag - 가격 라벨 추가 도면 경고 - 사용자 데이터가 포함된 대화 상자 표시 텍스트 - 경고에 대한 사용자 정의 텍스트 Send_Mail - "메일" 탭의 설정 창에 지정된 주소로 이메일을 보냅니다. 제목 - 이메일 헤더 Send_Notification - "알림" 탭의 설정 창에서 MetaQuotes ID가 지정된 모바일 터미널에 알림을 보냅니다.
PZ Penta O MT4
PZ TRADING SLU
2.33 (3)
The Penta-O is a 6-point retracement harmonacci pattern which usually precedes big market movements. Penta-O patterns can expand and repaint quite a bit. To make things easier this indicator implements a twist: it waits for a donchian breakout in the right direction before signaling the trade. The end result is an otherwise repainting indicator with a very reliable trading signal. The donchian breakout period is entered as an input. [ Installation Guide | Update Guide | Troubleshooting | FAQ | A
FREE
PZ Turtle Trading
PZ TRADING SLU
3.8 (10)
The Turtle Trading Indicator implements the original Dennis Richards and Bill Eckhart trading system, commonly known as The Turtle Trader. This trend following system relies on breakouts of historical highs and lows to take and close trades: it is the complete opposite to the "buy low and sell high" approach. The main rule is "Trade an N-day breakout and take profits when an M-day high or low is breached (N must me above M)". [ Installation Guide | Update Guide | Troubleshooting | FAQ | All Prod
FREE
Trend Reverting PRO v31
Nedyalka Zhelyazkova
Trade with reliable buy & sell arrows! Tired of false signals? Focus on   stable, rule-based entries This is a demo version. Try the DEMO version: • Works on EURUSD (demo, no suffix/prefix brokers) • Test it FREE and see consistent results Full Version:   TREND REVERTING PRO full version here (Updated version)   –  Maximum performance Works on   all symbols & timeframes Includes bonuses: Forex Trend Commander (FREE) + Two Moving Averages Strategy Key Features: High-performanc
FREE
The indicator detects and displays 3 Drives harmonic pattern (see the screenshot). The pattern is plotted by the extreme values of the ZigZag indicator (included in the resources, no need to install). After detecting the pattern, the indicator notifies of that by a pop-up window, a mobile notification and an email. The indicator highlights the process of the pattern formation and not just the complete pattern. In the former case, it is displayed in the contour triangles. After the pattern is com
Going straight
Maryna Shulzhenko
American traders say: “Trend is your friend”, which means “Trend is your friend”. And indeed it is! By trading with the trend, you reduce your risks and gain an advantage, as you increase the mathematical expectation of completed trades and, therefore, earn more profit. Together with the Going straight indicator you will trade with the trend with ease! This is one of the most effective ways to deal with market trends. Trading strategies using the channel indicator belong to the classic methods
TrendInChannel
Andriy Sydoruk
This indicator is the undisputed leader among the indicators. And for this statement there is a good reason. The indicator builds a very high quality channel in which it generates signals to enter! What is the ideal strategy for the trader, since the trader always hesitates when choosing a strategy for the job. That is, this indicator will allow you to solve the dilemma of choosing a job by trend or to the channel, since it combines these two basic concepts. Working with the indicator is very
With this system you can spot high-probability trades in direction of strong trends. You can profit from stop hunt moves initiated by the smart money! Important Information How you can maximize the potential of the scanner, please read here: www.mql5.com/en/blogs/post/718109 Please read also the blog about the usage of the indicator: Professional Trading With Strong Momentum This FREE Version of the indicator works only on EURUSD and GBPUSD. The full version of the indicator can be found here:
FREE
"Adjustable Fractals"는 프랙탈 지표의 고급 버전으로, 매우 유용한 거래 도구입니다! .................................................................................................................. - 알다시피 표준 프랙탈 mt4 지표에는 설정이 전혀 없습니다. 이는 거래자에게 매우 불편합니다. - Adjustable Fractals는 이 문제를 해결했습니다. 필요한 모든 설정이 있습니다. - 지표의 조정 가능한 기간(권장 값 - 7 이상). - 가격의 고점/저점으로부터 조정 가능한 거리. - 프랙탈 화살표의 조정 가능한 디자인. - 표시기에는 모바일 및 PC 알림 기능이 내장되어 있습니다. 여기를 클릭하여 고품질 트레이딩 로봇과 지표를 확인하세요! 이 MQL5 웹사이트에서만 제공되는 오리지널 제품입니다.
StrikePin
Mike Pascal Plavonil
1 (1)
The StrikePin indicator is a technical, analytical tool designed to identify trend reversals and find optimal market entries.  The StrikePin indicator is based on the pin bar pattern, which is the Price Action reversal pattern. An entry signal, in a trending market, can offer a very high-probability entry and a good risk to reward scenario. Be careful: the indicator is repainting since it is looking for highest high and lowest lows.  You should avoid to use it in experts but you can use it in
FREE
Price Magnets
Ivan Simonika
Price Magnet — Price Density and Attraction Levels Indicator Price Magnet is a professional analytical tool designed to identify key support and resistance levels based on statistical Price Density. The indicator analyzes a specified historical period and detects price levels where the market spent the most time. These zones act as “magnets,” attracting price action or forming a structural base for potential reversals. Unlike traditional Volume Profile tools, Price Magnet focuses on price-time d
The resistance and support lines are the position where the price will have a change, be it a breakout to follow the trend or reverse. The price rule will go from support to resistance and Long's resistance can be Short's support and the opposite is true. Accurately identifying support and resistance lines is the key to being able to trade well and profitably. This indicator is based on the Fractals indicator, the indicator will be redrawn by 2 candles. *Great For Swing Trading *Blue is Support
Fakey Detector
Yury Emeliyanov
Fakey Detector — False Breakout (Fakey) Indicator Fakey Detector is an indicator that automatically detects the classic Fakey pattern (false breakout of an inside bar) from Price Action and displays it on the chart using an arrow and breakout level. How it works: The Fakey pattern consists of three candles: Mother Bar — the largest by range Inside Bar — fully contained within the Mother Bar's range Fakey Candle — breaks out (up or down), but then closes back inside the range The indicator
FREE
The   Trendlines Oscillator   helps traders identify trends and momentum based on the normalized distances between the current price and the most recently detected bullish and bearish trend lines. The indicator features bullish and bearish momentum, a signal line with crossings, and multiple smoothing options. USAGE The   Trendlines Oscillator   works by systematically: Identifying pivot highs and lows. Connecting pivots to form bullish (support) and bearish (resistance) trendlines. Measuring
Momentum Breakout Indicator MT4
Mohamed Hassan Mohamed Hassan Alsherbiny
When prices breakout resistance levels are combined with momentum oscillator breaks out its historical resistance levels then probability emerges to record farther prices. It's strongly encouraged to confirm price breakout with oscillator breakout since they have comparable effects to price breaking support and resistance levels; surely, short trades will have the same perception. Concept is based on find swing levels which based on number of bars by each side to confirm peak or trough and in tu
FREE
이 제품의 구매자들이 또한 구매함
Gann Made Easy
Oleg Rodin
4.83 (156)
Gann Made Easy 는 mr.의 이론을 사용하여 최고의 거래 원칙을 기반으로 하는 전문적이고 사용하기 쉬운 Forex 거래 시스템입니다. W.D. 간. 이 표시기는 Stop Loss 및 Take Profit Levels를 포함하여 정확한 BUY 및 SELL 신호를 제공합니다. PUSH 알림을 사용하여 이동 중에도 거래할 수 있습니다. 거래 팁, 보너스, GANN MADE EA를 무료로 받으시려면 구매 후 저에게 연락주세요! 아마도 Gann 거래 방법에 대해 이미 여러 번 들었을 것입니다. 일반적으로 Gann의 이론은 초보자 거래자뿐만 아니라 이미 거래 경험이 있는 사람들에게도 매우 복잡한 것입니다. Gann의 거래 방식은 이론적으로 적용하기 쉽지 않기 때문입니다. 나는 그 지식을 연마하고 Forex 지표에 최고의 원칙을 적용하기 위해 몇 년을 보냈습니다. 표시기는 적용하기가 매우 쉽습니다. 차트에 첨부하고 간단한 거래 권장 사항을 따르기만 하면 됩니다. 지표는 지속적으로 시장
Scalper Inside PRO
Alexey Minkov
4.74 (69)
An exclusive indicator that utilizes an innovative algorithm to swiftly and accurately determine the market trend. The indicator automatically calculates opening, closing, and profit levels, providing detailed trading statistics. With these features, you can choose the most appropriate trading instrument for the current market conditions. Additionally, you can easily integrate your own arrow indicators into Scalper Inside Pro to quickly evaluate their statistics and profitability. Scalper Inside
M1 Sniper
Oleg Rodin
5 (19)
M1 SNIPER 는 사용하기 쉬운 거래 지표 시스템입니다. M1 시간대에 맞춰 설계된 화살표 지표입니다. 이 지표는 M1 시간대 스캘핑을 위한 단독 시스템으로 사용할 수 있으며, 기존 거래 시스템의 일부로도 사용할 수 있습니다. 이 거래 시스템은 M1 시간대 거래용으로 특별히 설계되었지만, 다른 시간대에도 사용할 수 있습니다. 원래는 XAUUSD와 BTCUSD 거래를 위해 이 방법을 설계했지만, 다른 시장 거래에도 유용하다는 것을 알게 되었습니다. 이 지표의 신호는 추세 방향과 반대로 거래될 수 있습니다. 저는 지표의 신호를 활용하여 양방향으로 거래할 수 있도록 돕는 특별한 거래 기법을 알려드립니다. 이 방법은 특별한 동적 지지선과 저항선 가격 영역을 활용하는 것을 기반으로 합니다. 구매하시면 M1 SNIPER 화살표 지표를 바로 다운로드하실 수 있습니다. 또한, 아래 스크린샷에 표시된 Apollo Dynamic SR 지표는 M1 SNIPER 도구를 사용하는 모든 사용자에게 무료로
Volatility Trend System - a trading system that gives signals for entries. The volatility system gives linear and point signals in the direction of the trend, as well as signals to exit it, without redrawing and delays. The trend indicator monitors the direction of the medium-term trend, shows the direction and its change. The signal indicator is based on changes in volatility and shows market entries. The indicator is equipped with several types of alerts. Can be applied to various trading ins
RFI levels PRO
Roman Podpora
5 (1)
이 지표는 추세 반전 지점과 가격 반등 영역을 정확하게 보여줍니다.       주요 투자자들   . 새로운 트렌드가 형성되는 곳을 파악하고 최대한 정확하게 의사결정을 내리며 모든 거래를 완벽하게 통제합니다. TREND LINES PRO   지표와 함께 사용할 때 최대의 잠재력을 발휘합니다.  VERSION MT5 지표가 보여주는 내용: 새로운 추세의 시작 시 활성화되는 반전 구조 및 반전 수준. 최소한의 위험 대비 수익률을 갖는 이익 실현   (TAKE PROFIT)   및   손절매(STOP LOSS)   레벨 표시       RR 1:2   . 지능형 손실 감소 로직이 적용된 손절매 기능. 지정된 지표에서 두 가지 추세 유형에 대한 반전 패턴을 표시합니다. 지표: 트렌드를 따라   트렌드 라인 프로   (글로벌 트렌드 변화) 트렌드 프로   (빠른 트렌드 변화) 간단하고 효과적입니다       스캐너       실시간 추세 (신규). 다중 시간 프레임 도구 필터링. 표시하다  
Dynamic Forex28 Navigator
Bernhard Schweigert
4.43 (7)
Dynamic Forex28 Navigator - 차세대 외환 거래 도구. 현재 49% 할인. Dynamic Forex28 Navigator는 오랫동안 인기 있는 지표의 진화형으로, 세 가지의 힘을 하나로 결합했습니다. 고급 통화 Strength28 지표(695개 리뷰) + 고급 통화 IMPULSE with ALERT(520개 리뷰) + CS28 콤보 신호(보너스). 지표에 대한 자세한 정보 https://www.mql5.com/en/blogs/post/758844 차세대 Strength 지표는 무엇을 제공합니까?  원래 지표에서 좋아했던 모든 것이 새로운 기능과 더 높은 정확도로 강화되었습니다. 주요 기능: 독점적인 통화 Strength 공식.  모든 시간대에 걸쳐 부드럽고 정확한 강도선. 추세와 정확한 진입을 식별하는 데 이상적입니다. 역동적인 시장 피보나치 수준(시장 피보나치).  이 지표에만 있는 고유한 기능. 가격 차트가 아닌 통화 강도에 피보나치가 적용됩니다.
Precautions for subscribing to indicator This indicator only supports the computer version of MT4 Does not support MT5, mobile phones, tablets The indicator only shows the day's entry arrow The previous history arrow will not be displayed (Live broadcast is for demonstration) The indicator is a trading aid Is not a EA automatic trading No copy trading function The indicator only indicates the entry position No exit (target profit)  The entry stop loss point is set at 30-50 PIPS Or the front hi
GOLD Impulse with Alert
Bernhard Schweigert
4.64 (11)
이 지표는 Advanced Currency IMPULSE with ALERT  +   Currency Strength Exotics  의 2가지 제품의 슈퍼 조합입니다. 그것은 모든 시간 프레임에 대해 작동하며 8개의 주요 통화와 하나의 기호에 대한 강약의 충동을 그래픽으로 보여줍니다! 이 표시기는 금, 이국적인 쌍, 상품, 지수 또는 선물과 같은 기호에 대한 통화 강도 가속을 표시하는 데 특화되어 있습니다. 금, 은, 오일, DAX, US30, MXN, TRY, CNH 등의 진정한 통화 강도 가속(충동 또는 속도)을 표시하기 위해 9번째 줄에 모든 기호를 추가할 수 있습니다. 새로운 기본 알고리즘을 기반으로 구축되어 잠재적인 거래를 훨씬 더 쉽게 식별하고 확인할 수 있습니다. 이는 통화의 강세 또는 약세가 가속되는지 여부를 그래픽으로 표시하고 가속 속도를 측정하기 때문입니다. 자동차의 속도계처럼 생각하면 됩니다. 가속화할 때 Forex 시장에서 동일한 일이 분명히 더 빠르
Currency Strength Wizard
Oleg Rodin
4.84 (57)
통화 강도 마법사는 성공적인 거래를 위한 올인원 솔루션을 제공하는 매우 강력한 지표입니다. 표시기는 여러 시간 프레임의 모든 통화 데이터를 사용하여 이 또는 해당 외환 쌍의 힘을 계산합니다. 이 데이터는 특정 통화의 힘을 확인하는 데 사용할 수 있는 사용하기 쉬운 통화 지수 및 통화 전력선의 형태로 표시됩니다. 필요한 것은 거래하려는 차트에 표시기를 부착하는 것뿐입니다. 표시기는 거래하는 통화의 실제 강세를 보여줍니다. 지표는 또한 추세와 거래할 때 유리하게 사용할 수 있는 구매 및 판매 거래량 압력의 극한값을 보여줍니다. 지표는 또한 피보나치에 기반한 가능한 대상을 보여줍니다. 표시기는 PUSH 알림을 포함한 모든 유형의 알림을 제공합니다. 구매 후 연락주세요. 나는 당신과 거래 팁을 공유하고 당신에게 무료로 훌륭한 보너스 지표를 줄 것입니다! 나는 당신에게 행복하고 유익한 거래를 기원합니다!
이 지표를 구매하면 제 프로페셔널 트레이드 매니저를 무료로 드립니다. 우선 이 거래 시스템이 리페인팅, 리드로잉 및 레이그 인디케이터가 아니라는 점을 강조하는 것이 중요합니다. 이는 수동 및 로봇 거래 모두에 이상적인 것으로 만듭니다. 온라인 강좌, 설명서 및 프리셋 다운로드. "스마트 트렌드 트레이딩 시스템 MT5"은 새로운 및 경험이 풍부한 트레이더를 위해 맞춤형으로 제작된 종합적인 거래 솔루션입니다. 10개 이상의 프리미엄 인디케이터를 결합하고 7개 이상의 견고한 거래 전략을 특징으로 하여 다양한 시장 조건에 대한 다목적 선택이 가능합니다. 트렌드 추종 전략: 효과적인 트렌드 추이를 타기 위한 정확한 진입 및 손절 관리를 제공합니다. 반전 전략: 잠재적인 트렌드 반전을 식별하여 트레이더가 범위 시장을 활용할 수 있게 합니다. 스캘핑 전략: 빠르고 정확한 데이 트레이딩 및 단기 거래를 위해 설계되었습니다. 안정성: 모든 인디케이터가 리페인팅, 리드로잉 및 레이그가 아니므로 신뢰
FX Power MT4 NG
Daniel Stein
4.95 (21)
FX Power: 통화 강세 분석으로 더 스마트한 거래 결정을 개요 FX Power 는 어떤 시장 상황에서도 주요 통화와 금의 실제 강세를 이해하기 위한 필수 도구입니다. 강한 통화를 매수하고 약한 통화를 매도함으로써 FX Power 는 거래 결정을 단순화하고 높은 확률의 기회를 발견합니다. 트렌드를 따르거나 극단적인 델타 값을 사용해 반전을 예측하고자 한다면, 이 도구는 귀하의 거래 스타일에 완벽히 적응합니다. 단순히 거래하지 말고, FX Power 로 더 스마트하게 거래하세요. 1. FX Power가 거래자에게 매우 유용한 이유 통화와 금의 실시간 강세 분석 • FX Power 는 주요 통화와 금의 상대적 강세를 계산하고 표시하여 시장 역학에 대한 명확한 통찰력을 제공합니다. • 어떤 자산이 앞서고 있고 어떤 자산이 뒤처지는지 모니터링하여 보다 현명한 거래 결정을 내릴 수 있습니다. 포괄적인 멀티 타임프레임 뷰 • 단기, 중기 및 장기 타임프레임에서 통화와 금의 강세를
Advanced Supply Demand
Bernhard Schweigert
4.91 (299)
현재 40% 할인! 초보자나 전문 트레이더를 위한 최고의 솔루션! 이 보조지표는 우리가 다수의 독창적 기능과 새로운 공식을 통합한 독특하고 고품질이며 저렴한 거래 도구입니다. 이 업데이트를 통해 이중 시간대를 표시할 수 있습니다. 더 높은 TF를 표시할 수 있을 뿐만 아니라 차트 TF와 더 높은 TF 모두를 표시할 수 있습니다: 중첩 영역 표시. 모든 Supply Demand 트레이더들이 좋아할 것입니다. :) 중요한 정보 공개 Advanced Supply Demand의 잠재력을 극대화하려면 다음을 방문하십시오. https://www.mql5.com/ko/blogs/post/720245   진입 또는 목표의 명확한 트리거 포인트를 정확히 찾아냄으로 해서 거래가 어떻게 개선될지 상상해 보십시오. 새로운 알고리즘을 기반으로 매수자와 매도자 간의 잠재적인 불균형을 훨씬 더 쉽게 분간할 수 있습니다. 왜냐하면 가장 강한 공급영역과 가장 강한 수요 영역과 과거에 어떻게 진행 되었는지를(이전
Buy Sell Arrow Swing MT4
Sahib Ul Ahsan
5 (1)
Looking for a powerful yet lightweight swing detector that accurately identifies market structure turning points? Want clear, reliable buy and sell signals that work across any timeframe and any instrument? Buy Sell Arrow MT Swing is built exactly for that — precision swing detection made simple and effective. This indicator identifies Higher Highs (HH) , Higher Lows (HL) , Lower Highs (LH) , and Lower Lows (LL) with remarkable clarity. It is designed to help traders easily visualize market stru
현재 40% 할인 ! 초보자 또는 전문가 트레이더를 위한 최고의 솔루션! 이 대시보드 소프트웨어는 28개의 통화 쌍에서 작동합니다. 2가지 주요 지표(Advanced Currency Strength 28 및 Advanced Currency Impulse)를 기반으로 합니다. 전체 Forex 시장에 대한 훌륭한 개요를 제공합니다. 고급 통화 강도 값, 통화 이동 속도 및 모든(9) 시간대의 28 Forex 쌍에 대한 신호를 보여줍니다. 추세 및/또는 스캘핑 기회를 정확히 파악하기 위해 차트의 단일 지표를 사용하여 전체 시장을 볼 수 있을 때 거래가 어떻게 개선될지 상상해 보십시오! 잠재적인 거래를 식별하고 확인하면서 강력한 통화와 약한 통화를 더욱 쉽게 식별할 수 있도록 이 지표에 기능을 내장했습니다. 이 표시기는 통화의 강세 또는 약세가 증가 또는 감소하는지 여부와 모든 시간대에서 수행되는 방식을 그래픽으로 보여줍니다. 추가된 새로운 기능은 현재 시장 조건 변화에 적응하는
Atomic Analyst
Issam Kassas
5 (3)
우선적으로 언급할 점은이 거래 지표가 다시 그리지 않고 지연되지 않으며 이를 통해 수동 및 로봇 거래 모두에 이상적이라는 점입니다. 사용자 매뉴얼: 설정, 입력 및 전략. Atomic Analyst는 가격의 강도와 모멘텀을 활용하여 시장에서 더 나은 이점을 찾는 PA Price Action Indicator입니다. 고급 필터를 장착하여 잡음과 거짓 신호를 제거하고 거래 잠재력을 높이는 데 도움이 됩니다. 복잡한 지표의 다중 레이어를 사용하여 Atomic Analyst는 차트를 스캔하고 복잡한 수학적 계산을 간단한 신호와 색상으로 변환하여 초보 트레이더가 이해하고 일관된 거래 결정을 내릴 수 있도록합니다. "Atomic Analyst"는 새로운 및 경험이 풍부한 트레이더를위한 종합적인 거래 솔루션입니다. 프리미엄 지표와 최고 수준의 기능을 하나의 거래 전략에 결합하여 모든 종류의 트레이더에 대한 다재다능한 선택지가되었습니다. 인트라데이 거래 및 스캘핑 전략 : 빠르고 정확한 일일
Trend Lines PRO
Roman Podpora
5 (1)
트렌드 라인즈 프로       이 지표는 시장이 실제로 어떤 방향으로 전환되는지 파악하는 데 도움이 됩니다. 실제 추세 반전 지점과 주요 시장 참여자들이 다시 진입하는 지점을 보여줍니다. 보시다시피       BOS 라인       복잡한 설정이나 불필요한 노이즈 없이 더 높은 시간대의 추세 변화와 주요 레벨을 확인할 수 있습니다. 신호는 차트에 다시 그려지지 않고 캔들이 마감된 후에도 계속 표시됩니다. VERSION MT 5   -   RFI LEVELS PRO   표시기   와 결합할 때 최대 잠재력을 발휘합니다. 지표가 보여주는 내용: 실제 변화       추세(BOS 라인) 한 번 신호가 나타나면 그 신호는 계속 유효합니다! 이는 신호를 발생시킨 후 변경될 수 있는 리페인팅 방식의 지표와 중요한 차이점입니다. 리페인팅 방식의 지표는 잠재적으로 자금 손실로 이어질 수 있습니다. 이제 더욱 높은 확률과 정확도로 시장에 진입할 수 있습니다. 또한 화살표가 나타난 후 목표가(익절)
El indicador "MR BEAST ALERTAS DE LIQUIDEZ" es una herramienta avanzada diseñada para proporcionar señales y alertas sobre la liquidez del mercado basándose en una serie de indicadores técnicos y análisis de tendencias. Ideal para traders que buscan oportunidades de trading en función de la dinámica de precios y los niveles de volatilidad, este indicador ofrece una visualización clara y detallada en la ventana del gráfico de MetaTrader. Características Principales: Canal ATR Adaptativo: Calcula
Gold Scalper Super
Aleksandr Makarov
5 (2)
Gold Scalper Super is an easy-to-use trading system. The indicator can be used as a standalone scalping system on the M1 time frame, as well as part of your existing trading system. Bonus: when purchasing an indicator, Trend Arrow Super is provided free of charge, write to us after purchase. The indicator 100% does not repaint!!! If a signal appears, it does not disappear! Unlike indicators with redrawing, which lead to the loss of a deposit, because they can show a signal and then remove it.
PRO Renko System
Oleg Rodin
5 (30)
PRO Renko System 은 RENKO 차트 거래를 위해 특별히 고안된 매우 정확한 거래 시스템입니다. 이것은 다양한 거래 상품에 적용될 수있는 보편적 인 시스템입니다. 체계는 효과적으로 당신에게 정확한 반전 신호에 접근을 주는 소위 시장 소음을 중화합니다. 이 표시기는 사용하기가 매우 쉽고 신호 생성을 담당하는 매개 변수가 하나만 있습니다. 당신은 쉽게 당신의 선택의 어떤 무역 계기에 공구를 적응시킬 수 있고 renko 막대기의 크기. 나는 항상 당신이 내 소프트웨어로 수익성있게 거래 할 수 있도록 추가 지원을 제공 할 준비가되어 있습니다! 나는 당신에게 행복하고 수익성있는 거래를 기원합니다! 구매 후 저에게 연락하십시오! 내 렌코 차트 생성기를 보내드립니다. 또한 내 개인 권장 사항 및 시스템의 다른 모듈을 무료로 공유 할 것입니다!
IQ FX Gann Levels
INTRAQUOTES
5 (2)
IQ FX Gann Levels a precision trading indicator based on W.D. Gann’s square root methods . It plots real-time, non-repainting support and resistance levels to help traders confidently spot intraday and scalping opportunities with high accuracy. William Delbert Gann (W.D. Gann) was an exceptional market analyst, whose trading technique was based on a complex blend of mathematics, geometry, astrology, and ancient mathematics which proved to be extremely accurate. Setup & Guide:  Download  MT5 Ver
PZ Harmonacci Patterns
PZ TRADING SLU
3.17 (6)
Trade smarter, not harder: Empower your trading with Harmonacci Patterns This is arguably the most complete harmonic price formation auto-recognition indicator you can find for the MetaTrader Platform. It detects 19 different patterns, takes fibonacci projections as seriously as you do, displays the Potential Reversal Zone (PRZ) and finds suitable stop-loss and take-profit levels. [ Installation Guide | Update Guide | Troubleshooting | FAQ | All Products ] It detects 19 different harmonic pric
Step into the world of Forex trading with confidence, clarity, and precision using   Gold Indicator   a next-generation tool engineered to take your trading performance to the next level. Whether you’re a seasoned professional or just beginning your journey in the currency markets, Gold Indicator equips you with powerful insights and help you trade smarter, not harder. Built on the proven synergy of three advanced indicators, Gold Indicator focuses exclusively on medium and long-term trends eli
Harmonic Pattern Plus MT4
Young Ho Seo
4.44 (18)
Introduction Harmonic Patterns are best used to predict potential turning point. Traditionally, Harmonic Pattern was identified manually connecting peaks and troughs points in the chart. Manual harmonic pattern detection is painfully tedious and not suitable for everyone. You are often exposed under subjective pattern identification with manual pattern detection. To avoid these limitations, Harmonic Pattern Plus was designed to automate your harmonic pattern detection process. The functionality
Pips Stalker
Abdulkarim Karazon
5 (2)
핍스 스토커는 롱 숏 화살표 유형의 지표로, 모든 수준의 트레이더들이 더 나은 시장 결정을 내릴 수 있도록 돕습니다. 이 지표는 절대 재도색되지 않고 RSI를 주요 신호 로직으로 사용합니다. 화살표가 주어지면 절대 다시 도색되거나 다시 도색되지 않고, 화살표 지연도 없습니다. PIPS STALKER ARROW의 특징 : 통계 패널 전체 승률 %와 연속 최대 승리 및 패배 거래 등 유용한 통계, 그리고 기타 유용한 정보를 보여주는 독특한 정보 대시보드입니다. TP와 SL, 내장된 자금 관리 이 지표는 각 화살표마다 TP와 SL 객체를 제공하므로, 거래자는 자금 및 위험 관리를 내장하고 있으며, SL은 ATR을 기반으로 하며, TP는 현재 ATR SL 가치를 기반으로 한 위험 대비 보상 비율을 기반으로 합니다. 재도색 없음, 높은 조정 가능성 이 인디케이터는 신호 품질 개선을 위한 다양한 옵션을 제공하여 어떤 쌍에서도 약간의 기간 조정만으로 작동하며, 패널은 현재 설정과 기간이 수
Meravith
Ivan Stefanov
5 (3)
마켓 메이커를 위한 도구. Meravith는 다음과 같은 기능을 제공합니다: 모든 타임프레임을 분석하고 현재 유효한 추세를 표시합니다. 강세와 약세 거래량이 동일한 유동성 구간(거래량 균형 구간)을 강조 표시합니다. 서로 다른 타임프레임의 모든 유동성 레벨을 차트에 직접 표시합니다. 텍스트 기반 시장 분석을 생성하여 참고용으로 제공합니다. 현재 추세를 기반으로 목표가, 지지선 및 손절가를 계산합니다. 거래의 위험 대비 보상 비율(Risk/Reward)을 계산합니다. 계좌 잔고에 따라 포지션 크기를 산출하고 잠재 수익을 추정합니다. 시장에 중대한 변화가 발생할 경우 경고도 제공합니다. 지표의 주요 라인: 강세/약세 거래량 소진 라인 — 목표가로 사용됩니다. 시장 추세를 나타내는 라인. 시장이 강세인지 약세인지에 따라 색상이 변경되며 추세 지지선 역할을 합니다. 색상은 주로 시장 심리를 보여줍니다. 거래량 균형선(Eq). Eq(Volume Equilibrium) 라인은 시스템의 핵심입니
Scalper Vault
Oleg Rodin
5 (36)
Scalper Vault 는 성공적인 스캘핑에 필요한 모든 것을 제공하는 전문 스캘핑 시스템입니다. 이 표시기는 외환 및 바이너리 옵션 거래자가 사용할 수 있는 완전한 거래 시스템입니다. 권장 시간 프레임은 M5입니다. 시스템은 추세 방향으로 정확한 화살표 신호를 제공합니다. 또한 상단 및 하단 신호와 Gann 시장 수준을 제공합니다.  이 시스템은 사용하기가 매우 쉽습니다. 원하는 시장 지역의 화살표만 따라가면 됩니다. 엑시트는 가격이 적정 수준에 도달하거나 시장의 고점 또는 저점 신호가 나타날 때 수행됩니다.  표시기는 PUSH 알림을 포함한 모든 유형의 경고를 제공합니다. 인디케이터 구매 후 연락주세요. 내 개인 거래 권장 사항과 훌륭한 보너스 지표를 무료로 공유합니다! 나는 당신에게 행복하고 유익한 거래를 기원합니다!
Owl smart levels
Sergey Ermolov
4.26 (38)
MT5 버전  |   FAQ Owl Smart Levels Indicator 는   Bill Williams 의 고급 프랙탈, 시장의 올바른 파동 구조를 구축하는 Valable ZigZag, 정확한 진입 수준을 표시하는 피보나치 수준과 같은 인기 있는 시장 분석 도구를 포함하는 하나의 지표 내에서 완전한 거래 시스템입니다. 시장과 이익을 취하는 장소로. 전략에 대한 자세한 설명 표시기 작업에 대한 지침 고문-거래 올빼미 도우미의 조수 개인 사용자 채팅 ->구입 후 나에게 쓰기,나는 개인 채팅에 당신을 추가하고 거기에 모든 보너스를 다운로드 할 수 있습니다 힘은 단순함에 있습니다! Owl Smart Levels   거래 시스템은 사용하기 매우 쉽기 때문에 전문가와 이제 막 시장을 연구하고 스스로 거래 전략을 선택하기 시작한 사람들 모두에게 적합합니다. 전략 및 지표에는 눈에 보이지 않는 비밀 공식 및 계산 방법이 없으며 모든 전략 지표는 공개되어 있습니다. Owl Smart Leve
System Trend Pro
Aleksandr Makarov
5 (2)
System Trend Pro - This is the best trend trading indicator!!! The indicator no repaint!!!  The indicator has   MTF   mode, which adds confidence to trading on the trend (   no repaint   ). How to trade? Everything is very simple, we wait for the first signal (big arrow), then wait for the second signal (small arrow) and enter the market in the direction of the arrow. (See screens 1 and 2.) Exit on the opposite signal or take 20-30 pips, close half of it, and keep the rest until the opposite
Smart Sweep Sniper MT4
Vincent Georges David Ferrier
# Smart Sweep Sniper MT4 Version MT4 Midnight Pro Edition , specialized for scalping and day trading in Prop Firm, Available here PROTOCOL - Institutional Liquidity Grab & SMC available here ## The Institutional Edge — Detect Where Smart Money Acts, Enter When It Matters If you like it, leave a positive review to support its development. If you encounter a bug, let us know before posting a review. When you complete your challenge, share your certificate in the comments. Happy trading! Smart Sw
No Repaint Bext is a ready-made trading system. Shows when to open and when to close trades, as well as in which direction. Every time a green arrow appears, you need to open a buy trade. Close all buy trades when a red arrow appears. The same goes for the opposite direction, every time a red arrow appears, open sell trades and close them all when a green arrow appears. We use the M5 timeframe for trading. You can trade on any cozy pair. This indicator does not repaint and practically does not
제작자의 제품 더 보기
It is widely known that colors affect the emotional state of a human, especially if this human is a trader. Psychologists recommend that you follow your instincts and select the color of your environment that is most comfortable to you. In order to reduce emotional stress, impact of colors on a person should be considered. The optimal range of the most beneficial colors includes green, yellow-green and green-blue ones. This indicator allows you to manage your emotional state and health. Choose a
FREE
This is an interactive and easy-to-set indicator which allows to form seven equally spaced channels which have your settings simultaneously. All seven channels are enabled by default. But you can easily enable one or another channel using control buttons located in the upper case of the indicator's control panel. You can change a period of the indicator calculation by clicking one of buttons indicating number of the channel in the lower case of the control panel. Two other buttons (one of them i
This EA represents an interactive panel with adjustable parameters destined for installation and deletion of pending orders (orders grid generator). You can place the panel anywhere on the screen or hide it into a dot clicking on the button in the upper left part of the chart (it will be shown after clicking on it for the second time). Number and step of orders, lot size, vertical shift for limit orders - all these things make your work easier. There are functions for restoring according to pend
Equidistant channel
Valeriy Medvedev
The purpose of the indicator is drawing an equidistant channel. It is somewhat different from the traditional model. The choice of control parameters is simple and does not require any special description. Enter the calculation interval in hours and the solution to the problem will appear on the screen. Please note that the time involved in calculation of the channel must be greater than the timeframe it will be displayed on. If the parameters you enter are beyond the allowable limits, you will
This indicator is designed for drawing equidistant channels. Two options are available: based on the number of hours in the indicator calculation and by the number of bars. To draw a channel, enter a number 1 or greater. The maximum value is limited by the amount of visible bars. If the parameters you enter are beyond the allowable limits, you will get notified if the indicator restrictions. Please note that the time involved in calculation of the channel must be greater than the timeframe it wi
ZigZag on average
Valeriy Medvedev
This is a well-known ZigZag indicator. But it differs by the fact that its plot is based on values of the middle line which is set by a user. It can display Andrews’ Pitchfork and standard or Bobokus Fibo levels. NO REPAINTING. Parameters Period МА — middle line period. Default value is 34. Minimum value is 4. Maximum value is set at your discretion. Used to calculate price - base price to calculate the middle line. The averaging method - method of smoothing the middle line. Turning pitchfork —
The indicator displays the moving average of all periods on one chart. It shows the MA of a one step lower timeframe and all the MAs equal to and higher than it. Parameters Period moving average - Moving Average period (default is 34); Used to calculate price - price used for the MA calculation (default is the average price = (high+low)/2); The averaging method - default is linear-weighted; Moving average shift - MA shift (default is 0). Just enter the MA calculation period and its parameters,
Desk Analytical Table Portfolio Monitoring for Active Traders Overview: The Desk Analytical Table indicator is a professional tool designed for traders managing multiple financial instruments simultaneously. It consolidates key data on open positions, orders, and market statistics into a single window, ensuring seamless portfolio control even during high-intensity trading sessions. Key Features: ️ Multi-Instrument Analysis - Monitor up to 30 assets in real time with quick switching between inst
This is a prototype of the famous Control and management of transactions panel. There are two main differences: Allows to work with all the variety of financial instruments opened by a user and not only with instruments it was attached to; To activate levels of order closure hidden from a broker, it uses not lines but modifiable virtual levels. To enjoy the full functionality of the panel you are advised to have: Desk analytical table . Their combined operation allows to keep the situation under
Inform Panel For ALL Symbols — Advanced Multi-Instrument Trading Management The Inform Panel For ALL Symbols is a sophisticated trading management tool designed to streamline control over all financial instruments in a trader’s portfolio, eliminating the need to attach it to specific charts. Its core innovation lies in using modifiable virtual levels for stop loss (SL) and take profit (TP), allowing discreet order closure hidden from brokers. The panel automatically detects and lists all active
The indicator is based on the two-buffer scheme and does not require any additional settings. It can be used on any financial instrument without any restrictions. The indicator is a known ZigZag, but it does not redraw . The indicator allows to easily detect significant levels on the price chart, as well as demonstrates the ability to determine the probable direction of a price movement. The calculations are based on the candles' Close prices, thus improving the reliability of the levels. Param
The idea of the indicator stems from the necessity to clearly define the borders of support and resistance levels, which helps to plan the opening and closing of positions in the areas that most appropriately determine the process. Look at the breakdowns of the resistance level that confirm the intention of the price to continue the upward movement, after it passed the support level and entered the channel formed by the two levels. The same is for the case when the price enters the channel downw
This indicator is a logical extension of the product at https://www.mql5.com/en/market/product/12526 . The only difference is that price movement is displayed using a histogram with levels, allowing to assess the direction and strength of the movement. How to interpret the signal: 0 - the middle of the channel; above 0.5 - the breakdown of the channel up; below -0.5 - the breakdown of the channel down. Both indicators are displayed in the attached screenshots. Install the indicator and you will
This indicator is the logical continuation of the well-known equidistant channel indicator: https://www.mql5.com/en/market/product/8723 . The main purpose of the indicator is the visualization of price levels relative to the parallel channel using Fibo Bobokus levels in a separate window and the price history. This often allows forecasting the future price movement with a sufficiently high degree of probability. The Fibo levels calculation equation is as follows: FiboLevel = (50-(100*((Close[i]-
This simple to use utility allows opening charts from the list of financial instruments by left clicking their names. The chart window is opened using the Default template. The template name can be changed to one of those stored in Charts-Templates section of the terminal. It is possible to customize the background colors of panels and their labels, and also to select the display type for a more comfortable working environment. This is all you need to know in order to see the result quickly. Pa
If you need to quickly evaluate the results of trading on a current financial instrument by hypothetical price movement in the chosen direction and up to a certain level, set the indicator on any chart that contains open positions and move the line to the desired level after it appears together with the results tab. This is all you need to understand what happens to your deposit if the price is at this level without taking into account existing stop loss and take profit. Enable considering pendi
This is an individual tool for analyzing the market situation. It is very simple to use. After attaching the indicator to the chart, you will see three vertical lines named "VLine 1", "VLine 2" and "VLine 3", following in this order from left to right. For the utility to operate correctly, this sequence should always be observed. Please note: at the first start, the lines are not bound to specific price levels on the chart. This should be done by user in accordance with the following rule: if li
This indicator displays a set of moving average lines across all higher timeframes. The indicator can be installed on any financial instrument and any timeframe. For the analysis of the lines, a panel with timeframe values is provided in the lower right corner. Using the panel, you can easily enable/disable the display of the MA line of any higher timeframe. This allows a more thorough analysis of the market situation. The color of the button matches the color of the moving average line. Parame
This indicator is designed for monitoring RSI levels on the current and higher timeframes. The control panel is user friendly and consists of buttons, with which you can control the display of lines as per the names of the buttons. The button color matches the line color. Parameters "___| Settings of the main indicator " RSI Period - averaging period for index calculation (default is 14); RSI Price type - price used for calculations (default is the Close price); "___| Color palette " Text color
Этот индикатор предназначен для контроля уровней CCI на текущем и старших от него таймфреймах. Панель управления проста в понимании и состоит из кнопок, с помощью которых можно управлять отображением линий, соответствующим указанным на наименовании кнопок. Цвет кнопки совпадает с цветом линии. Этот индикатор из серии подобных индикаторов, которые уже успели завоевать популярность: https://www.mql5.com/ru/market/product/30276 и https://www.mql5.com/ru/market/product/30403 Параметры "___| Setti
This is a well-known ZigZag indicator. But it differs by the fact that its plot is based on values of the middle line which is set by a user. It can display Andrews’ Pitchfork and standard or Bobokus Fibo levels. NO REPAINTING. Parameters Period МА — middle line period. Default value is 34. Minimum value is 4. Maximum value is set at your discretion. Used to calculate price — type of price used for the midline calculations. The averaging method — type of smoothing for the middle line. Turning p
The indicator is similar to https://www.mql5.com/en/market/product/12330 . However, it considers the MQL5 platform features. Peaks and bottoms are calculated based solely on external bars. After a swing is formed, the indicator does not redraw providing opportunities for traders working on horizontal level breakthroughs. Traffic can be reduced by changing the amount of calculated bars in the MinBars variable (default value is 500). All you need is to select the output options, so that you can se
The indicator is based on the two-buffer scheme and does not require any additional settings. It can be used on any financial instrument without any restrictions. The indicator is a known ZigZag, but it does not redraw . The indicator allows to easily detect significant levels on the price chart, as well as demonstrates the ability to determine the probable direction of a price movement. The calculations are based on the candles' Close prices, thus improving the reliability of the levels. Param
It is an analogue of the indicator of levels at https://www.mql5.com/en/market/product/24273 for the MetaTrader 5 platform. The indicator shows the levels of the past month, week and day. In addition, it draws a level in percentage relative to the difference between the High and Low of the past month and week. For the daily levels of the past day, the Close levels are additionally displayed. All you need to do is to configure the display parameters of the levels to your liking. In some cases, af
필터:
CodeFaceCrunch
161
CodeFaceCrunch 2021.12.16 17:26 
 

사용자가 평가에 대한 코멘트를 남기지 않았습니다

Boaz
88
Boaz 2021.09.05 15:17 
 

사용자가 평가에 대한 코멘트를 남기지 않았습니다

cvdestyfx
2895
cvdestyfx 2019.12.11 06:04 
 

사용자가 평가에 대한 코멘트를 남기지 않았습니다

Yuriy Suslov
374
Yuriy Suslov 2018.09.24 20:59 
 

사용자가 평가에 대한 코멘트를 남기지 않았습니다

Singgih Wasito Adhi
355
Singgih Wasito Adhi 2018.04.26 20:11 
 

사용자가 평가에 대한 코멘트를 남기지 않았습니다

John Greydanus
598
John Greydanus 2017.10.06 04:09 
 

사용자가 평가에 대한 코멘트를 남기지 않았습니다

Jenny Ramages
238
Jenny Ramages 2017.08.28 18:26 
 

사용자가 평가에 대한 코멘트를 남기지 않았습니다

Ali irwan
5137
Ali irwan 2017.08.03 07:28 
 

사용자가 평가에 대한 코멘트를 남기지 않았습니다

리뷰 답변