• Typ des Indikators
  • Preis
     - 
  • Zurücksetzen
Schau das Lehrvideo über Market auf YouTube YouTube
Wie man einen Roboter oder Indikator kaufen kann
Starte Deinen EA im
Virtual Hosting
Teste einen Indikator/Roboter vor dem Kauf
Möchtest Du Geld im Market verdienen?
Wie man Produkte richtig präsentiert

Kostenpflichtige technische Indikatoren für den MetaTrader 4 - 5
icon Die Signale der unten aufgeführten technischen Indikatoren spielen eine entscheidende Rolle beim Eröffnen und Schließen von Geschäften in der MetaTrader 4 Plattform. Das Wesen von Indikatoren ist eine mathematische Transformation der Preise eines finanziellen Symbols, die darauf abzielt, zukünftige Preisänderungen vorherzusagen.
Download the free version   here. A Full Concept of BUY/SELL   Scalping Strategy Trend detection is one of the basic challenges of every trader. Finding a way to tell when to enter a trade is very important, timing is a game changer, not too early and not too late. Sometimes, due to not knowing the market conditions, the trader closes his positions with a small profit or allows the losses to grow, these are the mistakes that novice traders make. Indicator Trend Whipper is a complete trading st
MA Speedometer
Davit Beridze
4.71 (14)
Non standard attitude to the standard moving average indicator. The essence of the indicator is to determine the strength and speed of the price direction by determining the tilt angle of the moving average. A point is taken on the fifteenth MA candle and a point on the last closed MA candle, a straight line is drawn between them, it is movable and on a hemisphere shows an angle of inclination from 90 degrees to -90. above 30 degrees is the buying area, below -30 degrees is the selling area. abo
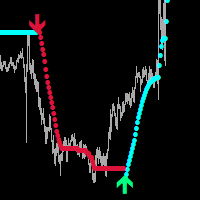
Dot Scalp - zeigt Preisumkehrpunkte mit 93 % Genauigkeit an. Punkte werden nicht neu gezeichnet. Funktioniert gut bei Seitwärtsbewegungen, wenn der Markt flach ist. Der Indikator zeichnet die Punkte der Preisumkehr oder Pullbacks auf dem Chart. Wie verwendet man diesen Indikator im Handel? Fügen Sie dem Diagramm den Dot Scalp-Indikator hinzu. Laden Sie auch im Internet einen beliebigen Kanalindikator herunter, der den Kanal auf dem Diagramm anzeigt. Warten Sie auf die Seitwärtsbewegung des
Der Indikator zeichnet die Niveaus für jeden Tag. Wenn Sie die grüne Zone von gestern betreten - kaufen Sie, und wenn Sie die rote Zone von gestern betreten - verkaufen Sie. Stopp 20 Pips. Ziel 20 Pips oder mehr. Geben Sie einfach Ihre Aufträge ein und warten Sie. Zu handelnde Paare: EURUSD GBPUSD Keine besonderen Kenntnisse erforderlich. Der Algorithmus errechnet alles selbst. Die Erfolgsquote ist hervorragend. Einfach, aber dennoch effektiv!
TDI Multi Timeframe Scanner: This Dashboard indicator uses the TDI (Trader's Dynamic Index) Indicator to find best trades. Extra indicators and detailed description is here: https://abiroid.com/product/tdi-scanner-dashboard Checks for: - SharkFin Pattern Free indicator for SharkFin: https://www.mql5.com/en/market/product/42405/ - TDI Trend: Strong/Weak Trend Up/Down - TDI Signal: Strong/Medium/Weak Signal for Buy/Sell - Consolidation - Overbought/Oversold - Volatility Bands - Previous Day/Week
Italo Pivots Indicator
Italo Santana Gomes
5 (6)
BUY INDICATOR AND GET A PIVOT POINT EA FOR FREE AS A BONUS + SOME OTHER GIFTS! ITALO PIVOTS INDICATOR  is the best pivot point indicator for  strong   price   reversals and continuations of price movements  ever created , and why is that? You will have for the first time inside a pivot point indicator the pivots above the monthly, so, you will have the 3-month pivot lines, 6 months, 1 year, 2 years, 3 years, 5 years and 10 years, very strong support and resistances. Not only that but for the fi
The Supply and Demand Zones indicator is one of the best tools we have ever made. This great tool automatically draws supply and demand zones, the best places for opening and closing positions. It has many advanced features such as multi timeframe zones support, displaying the width of zones, alert notifications for retouched zones, and much more. Because of market fractality, this indicator can be used for any kind of trading. Whether you are a positional, swing, or intraday trader does not ma
Ultimate Trend Finder (Multi Pair And Multi Time Frame) :   ---LIMITED TIME OFFER: NEXT 25 CLIENTS ONLY ---46% OFF REGULAR PRICE AND 2 FREE BONUSES ---SEE BELOW FOR FULL DETAILS Institutional traders use moving averages more than  any  other indicator. As moving averages offer a quick  and clear indication of the institutional order flow. And serve as a critical component in the decision making  within numerous institutional trading rooms. Viewing the market through the same lens as the i
Der Indikator „Scalper Arrows“ ist für die Scalping-Methode des Handels innerhalb von Trendrichtungen konzipiert. Funktionsprinzip des Indikators. Große Pfeile geben die Richtung des Trends an. Rote Pfeile – für bärische Richtung, grüne Pfeile für bullische Richtung. Innerhalb eines Aufwärts- oder Abwärtstrends gibt es einen Algorithmus zur Erzeugung von Scalping-Signalen in Form kleiner Pfeile. Außerdem werden Trendrichtungslinien in Trendrichtung gezeichnet und kleine Pfeilsignale in ih
Hören Sie auf, nach neuen Indikatoren zu suchen und sie auszuprobieren! Holen Sie sich den Winshots Massive FX Profits Indikator und heben Sie sich von der Masse ab. Jahrelange Handelserfahrung hat uns zum Aufbau dieses All-in-One-Indikators geführt! Handeln Sie wie die Profis mit Winshots Massive FX Profits! Dieser Indikator verwendet die folgenden Methoden, um Ihnen zu helfen, ein konsistenter profitabler Trader zu werden: - MARKTVOLUMENPROFIL - TÄGLICHE PIVOTS-STUFEN - PREISZYKLEN-
RSI Divergence Full
Mihails Babuskins
4.65 (37)
RSI Divergence Full   +10 other divergence indicators Contact me after payment to send you the User-Manual PDF File. Download the MT5 version here. Also you can download the >>>  Hybrid Trading EA  <<< that is designed and implemented based on RSI Divergence Indicator. RSI is a pretty useful indicator in itself but it's even more effective when you trade divergence patterns with that. Because the divergence signal of the RSI indicator is one of the most powerful signals among the indicators. D
With this system you can spot high-probability trades in direction of strong trends. You can profit from stop hunt moves initiated by the smart money! Important Information How you can maximize the potential of the scanner, please read here: www.mql5.com/en/blogs/post/718109 Please read also the blog about the usage of the indicator: Professional Trading With Strong Momentum. With this system you have 3 reliable edges on your side: A strong trend (=high probability of continuation) A deep pu
Smart Liquidity Profile
Suvashish Halder
4 (4)
The Smart Liquidity Profile is color-coded based on the importance of the traded activity at specific price levels, allowing traders to identify significant price levels such as support and resistance levels, supply and demand zones, liquidity gaps, consolidation zones, Buy-Side/Sell-Side Liquidity and so on.  Smart Liquidity Profile allows users to choose from a number of different time periods including 'Auto,' 'Fixed Range,' 'Swing High,' 'Swing Low,' 'Session,' 'Day,' 'Week,' 'Month,' 'Quar
Consolidations
Rofhiwa Bruce Nthulane
5 (1)
What if you could see trouble from far, just imagine having some ability to foresee danger. This indicator has the ability to see consolidations before they are clear to everyone else. In the market everything is always fun until the market starts consolidating and often times by the time people realise it it's often too late. This Indicator will spot consolidations very fast and let you know at the top right of the chart so that you can either avoid losses by stopping to trade using trend follo
UGenesys Volume MT4
Odaine Ramon Mcmillan
5 (1)
50% Off Today Only! Price Goes Back Up at 11 PM (EST) uGenesys Volume Indicator: Your Key to Mastering Market Volume Analysis What Traders Are Saying: "A must-have indicator...really a game-changer." – wuzzy66 "Amazing indicator...strongly recommend to beginners." – joinbehar Understanding Market Volume: Volume in the market is a critical indicator of movement and opportunity. The uGenesys Volume Indicator is specially crafted to pinpoint when the market has the most volume, allowing you to
Anchored VWAP with Alert
Trade The Volume Waves Single Member P.C.
5 (4)
What is the Volume Weighted Average Price (VWAP)? The volume weighted average price (VWAP) is a trading benchmark used by traders that gives the average price an instrument has traded at throughout the day, based on both volume and price.  It is important because it provides traders with insight into both the trend and value of the instrument. What is the Difference between VWAP and AVWAP? While VWAP is having as starting point the beggining of the day,week,month etc. in the AVWAP you can pla
DESCRIPTION The CHAOS INDICATOR has been developed to be used for the TRADING STRATEGY OF CHAOS, as described in the book. The book is in italian language only and can be obtained only on my website indicated below. DATAS COLLECTED AND SHOWN ON GRAPHS The CHAOS INDICATOR apply easily to any graph and any asset, and it is a TRADING FACILITATOR, as it identify immediately the following items on any graph: - The GP (= RIGHT PRICE) i.e. the price to which the asset should be attracted within 24
Moving Average Cloud
Muhammad Elbermawi
4.93 (14)
Oder "MAC". Dies ist ein Indikator, der Ihnen helfen soll, den Trend zu erfassen und zu handeln. Die Idee hinter diesem Indikator lässt sich in den nächsten Schritten erklären: Zeichnen Sie eine sich schnell bewegende durchschnittliche Hüllkurve. Zeichnen Sie eine sich langsam bewegende durchschnittliche Hüllkurve. Das MAC Upper Band ist der höchste Wert zwischen den Höhen beider Hüllkurven. Das MAC Lower Band ist der niedrigste Wert zwischen den Tiefstwerten beider Hüllkurven. Die MAC Histog
Robot Choppiness
Diego Mauricio Padilla Mendez
3 (2)
Der Choppines-Roboter wird als Indikator im MT4-Indikatorordner geladen Es wird empfohlen, eine Kerzenzeit von 5 Minuten zu verwenden, die empfohlene Ablaufzeit des Roboters beträgt 5 Minuten. Der Roboter kann so konfiguriert werden, dass er Signale an die Plattformen MT2, MX2 und PRICEPRO sendet. Um Signale zu senden, müssen Sie das Connector-Programm der Plattform verwenden, mit der wir arbeiten möchten. Führen Sie zur Installation auf dem Connector das folgende Verfahren durch (ein Bil
Gann Swing Structure
Kirill Borovskii
5 (1)
This indicator is based on the mathematics of the great trader W.D. Ganna. With its help, you can easily find strong levels by analyzing swings to find the optimal entry point. The indicator works on all instruments and all timeframes. The indicator is fully manual and has control buttons. All you need to do is press the NEW button, a segment will appear, which you can place on any movement, swing or even 1 candle that you want to analyze. By placing the segment, press the OK button. A grid (th
Das Apollo Price Action System ist ein Indikator, der vollständig auf dem Price Action-Prinzip basiert. Der Indikator gibt ein Signal zum Kauf oder Verkauf, sobald die Bedingungen für den Markteintritt gemäß der Strategie des Indikators gebildet sind. Der Indikator kann als grundlegendes Handelssystem oder als Ergänzung zu Ihrem eigenen Handelssystem verwendet werden. Dieser Indikator ist sehr einfach zu bedienen. Sie müssen nur den Signalen folgen. Der Indikator zeigt Trendlinien auf dem Chart
Contact me for instruction, any questions! Introduction V Bottoms and Tops are popular   chart patterns   among traders due to their potential for identifying trend reversals. These patterns are characterized by sharp and sudden price movements, creating a V-shaped or inverted V-shaped formation on the   chart . By recognizing these patterns, traders can anticipate potential shifts in market direction and position themselves accordingly.  V pattern is a powerful bullish/bearish reversal pattern
Bermaui Bands
Muhammad Elbermawi
4.94 (89)
Bermaui Bands (BB) ist ein technisches Analysetool, das dabei hilft, zwischen Bereichs- und Trendkursbewegungen zu filtern. Die Idee hinter diesem Indikator lässt sich in den nächsten Schritten erklären: Berechnen Sie die Standardabweichung als Oszillator, der sich zwischen 0 und 100 bewegt. Ich nenne sie Bermaui-Abweichung in Prozent (BD %). Wenn "BD %" nahe Null ist, ist die Volatilität am höchsten. Außerdem ist die Volatilität sehr gering, wenn "BD %" nahe 100 liegt. Hohe Volatilität bedeutet
I  recommend you to read the   product's blog  (manual) from start to end so that it is clear from the beginning what the indicator offers. This multi time frame and multi symbol indicator identifies double top/bottom, head & shoulders, pennant/triangle and flag patterns. It is also possible to setup alerts only when a neckline/triangle/flagpole breakout has occured (neckline breakout = confirmed signal for top/bottoms and head & shoulders).  The indicator can also be used in single chart mode.
Trend Chief
Vladimir Stepanov
5 (5)
Trend Chief ist ein fortschrittlicher Indikatoralgorithmus, der Marktgeräusche herausfiltert, den Trend, Einstiegspunkte sowie mögliche Ausstiegsniveaus bestimmt. Verwenden Sie kürzere Zeitrahmen für das Scalping und längere Zeitrahmen für das Swing-Trading. Trend Chief ist perfekt für alle Metatrader-Symbole: Währungen, Metalle, Kryptowährungen, Aktien und Indizes * So verwenden Sie den Trend Chief-Indikator: - Holen Sie sich den Haupttrend, indem Sie sich die Tages- und H4-Charts ansehen -
Introducing   Auto Trendline Pro : Your Ultimate Trading Companion Are you tired of manually drawing trendlines on your forex charts? Do you wish for a tool that can simplify your trading while providing timely alerts? Look no further, because Auto Trendline Pro is here to revolutionize your trading experience. In the fast-paced world of forex trading, staying ahead of the curve is essential. Identifying trends, both upward and downward, can be a game-changer. This is where Auto Trendline Pro s
MASR Bands
Muhammad Elbermawi
5 (10)
Oder M Oving A verage S upport R eständigkeit Bands. Der MASR-Bänder-Indikator ist ein gleitender Durchschnitt, der von zwei Bändern umgeben ist, die als Unterstützungs- und Widerstandsniveaus zusammenarbeiten. Statistisch enthalten MASR-Bänder in 93% der Fälle Preiskerzen. So wird es in Schritten berechnet: 1. Der erste Schritt besteht darin, das höchste Hoch (HHV) und das niedrigste Tief (LLV) für einen Zeitraum von X zu berechnen. 2. Der zweite Schritt besteht darin, HHV durch LLV zu
Der Indikator zeigt die am besten geeigneten Einstiegs- und Ausstiegspunkte an. Er zeigt auch statistische Daten zu allen Signalen an, um den Handel besser analysieren zu können. Mit Hilfe dieses Indikators werden Sie den Markt besser verstehen können. Sobald sich die Kraft des Trends abzuschwächen beginnt (dies wird auf dem Panel angezeigt), bewegt sich die Trendlinie in die Horizontale - dies ist das Signal zum Ausstieg aus dem Handel. Oder Sie können aussteigen, wenn das durchschnittliche
Divergenzen sind schwierig zu finden und seltener anzutreffen. Sie sind eines der zuverlässigsten Handelsszenarien. Dieser Indikator sucht automatisch mit Ihrem bevorzugten Oszillator nach regelmäßigen und versteckten Abweichungen. [ Installationsanleitung | Update-Anleitung | Fehlerbehebung | FAQ | Alle Produkte ] Einfach zu handeln Findet regelmäßige und versteckte Abweichungen Unterstützt viele bekannte Oszillatoren Implementiert Handelssignale basierend auf Ausbrüchen Zeigt geeignete
SuperTrend Scanner
FXsolutions
4.43 (14)
This scanner shows the trend values of the well known indicator SuperTrend for up to 30 instruments and 8 time frames. You can get alerts via MT4, Email and Push-Notification as soon as the direction of the trend changes. Important Information How you can maximize the potential of the scanner, please read here: www.mql5.com/en/blogs/post/718074 You have many possibilities to use the scanner. Here are two examples: With this scanner you can trade a top-down approach easily. If two higher time
PZ Swing Trading
PZ TRADING SLU
5 (4)
Swing Trading ist der erste Indikator, der Schwankungen in Trendrichtung und mögliche Umkehrschwankungen erkennt. Es wird der in der Handelsliteratur weit verbreitete Baseline-Swing-Trading-Ansatz verwendet. Der Indikator untersucht mehrere Preis- und Zeitvektoren, um die aggregierte Trendrichtung zu verfolgen und erkennt Situationen, in denen der Markt überverkauft oder überkauft ist und zur Korrektur bereit ist. [ Installationsanleitung | Update-Anleitung | Fehlerbehebung | FAQ | Alle Produkte
Forex Gump
Andrey Kozak
2.83 (6)
Forex Gump is a fully finished semi-automatic trading system. In the form of arrows, signals are displayed on the screen for opening and closing deals. All you need is to follow the instructions of the indicator. When the indicator shows a blue arrow, you need to open a buy order. When the indicator shows a red arrow, you need to open a sell order. Close orders when the indicator draws a yellow cross. In order to get the most effective result, we recommend using the timeframes H1, H4, D1. There
Wir stellen den   Awesome Oscillator Alert   vor, einen leistungsstarken technischen Indikator, der Händlern wertvolle Einblicke in die Marktdynamik und Handelsmöglichkeiten bietet. Mit seinen umfassenden Funktionen und der benutzerfreundlichen Oberfläche ist dieser Indikator ein unverzichtbares Werkzeug für Händler, die sich einen Vorsprung auf dem Markt verschaffen möchten. Eines der herausragenden Merkmale des Awesome Oscillator Alert ist seine Kompatibilität mit allen Währungspaaren und Z
Daily Candle Predictor ist ein Indikator, der den Schlusskurs einer Kerze vorhersagt. Der Indikator ist in erster Linie für die Verwendung in D1-Charts gedacht. Dieser Indikator eignet sich sowohl für den traditionellen Devisenhandel als auch für den Handel mit binären Optionen. Der Indikator kann als eigenständiges Handelssystem oder als Ergänzung zu Ihrem bestehenden Handelssystem verwendet werden. Dieser Indikator analysiert die aktuelle Kerze und berechnet bestimmte Stärkefaktoren innerhalb
Buy and sell zones
Evgeniy Zhdan
5 (3)
Indikator zur Bestimmung von Flat und Trend. Wenn der Preis unter einem der beiden Histogramme und zwei Linien (rot und blau) liegt, ist dies eine Verkaufszone. Beim Kauf dieser Version des Indikators, MT4-Version für ein echtes und ein Demo-Konto - als Geschenk (zum Erhalten, schreiben Sie mir eine private Nachricht)! Wenn der Preis über einem der beiden Histogramme und zwei Linien (rot und blau) liegt, ist dies eine Kaufzone. MT4-Version:   https://www.mql5.com/en/market/product/3793 Wenn der
Apollo Striker
Oleg Rodin
5 (1)
Apollo Striker ist ein effektiver BUY/SELL-Pfeilindikator, der die Richtung der Preisbewegung vorhersagt. Dieser Indikator ist für absolut alle Händler geeignet, unabhängig von der bevorzugten Strategie oder dem bevorzugten Währungspaar, Zeitrahmen. Dieser Pfeilindikator kann mit absolut jedem Handelsinstrument verwendet werden, seien es Währungen, Metalle, Indizes, Aktien oder sogar Kryptowährungen. Darüber hinaus kann ein Händler die Indikatorsignale für jedes Handelspaar und jeden Zeitrahmen
The   VWAP indicator   is our version of the popular Volume-Weighted Average Price indicator. The VWAP is the ratio between the value traded (price multiplied by the number of volume traded) and the total volume traded over a specific time period. As a result, it measures the average price of the instrument much better than the simple moving average. Although there are many ways to use the VWAP, most investors use it to calculate the daily average.  The indicator works in five modes: Moving  
BeST_Gann Swing Oscillator is an MT4 indicator that is based on the corresponding work of Robert Krausz who introduced it in the book “ A.W.D Gann Treasure Discovered ” . The Gann Swing Oscillator is a range-bounding technical indicator that oscillates between +1 and -1 and thus it describes the market swings. Generally when the market is in an upswing, the Gann Swing Oscillator describes it as 2 higher highs with the value of +1 while after an upswing, the downswing is expected. Also the do
This indicator shows the latest untouched support and resistance as horizontal lines. The indicator can show support/resistance from higher timeframes. With this indicator you can e.g. easily see the support/resistance of the timeframes H4, D1 and W1 on a H1 chart, which can be a big advantage while time your entry on H1. This is the FULL version of the indicator: Support Resistance Multi Time Frame FREE Parameters referenceTF: the timeframe from which the support/resistance is calculated cand
This is a volume profile where you can customize the time period you want. You can do this with a line or choose automatic functions such as showing the volume from the last time period. The indicator also shows the maximum volume value (VPOC - VOLUME POINT OF CONTROL) and the average value, colors and settings you can adjust as you like, there are many possibilities. If you need an indicator that shows the constant volume time frames there is  ...HERE... Volume Profile  is an advanced charting
Das technische Handelssystem von BB Reverse Arrows wurde entwickelt, um umgekehrte Punkte für Einzelhandelsentscheidungen vorherzusagen. Die aktuelle Marktsituation wird durch den Indikator analysiert und für mehrere Kriterien strukturiert: die Erwartung von Umkehrmomenten, potenziellen Wendepunkten, Kauf- und Verkaufssignalen. Der Indikator enthält keine überschüssigen Informationen, verfügt über eine visuelle verständliche Schnittstelle, mit der Händler angemessene Entscheidungen treffen k
The Swing Hit Perfect Master Indicator for MT4 displays accurate buy and sell signals on the chart and is no repaint and can be used on any pair, gold and indices. It's all in one the best indicator Swing and trend detection and is able to make precise entries. The indicator for MT4 points dots on the chart arrow after the swing high and low is maintained and takes perfect entries with the trend. The template shows the lows and highs of the market. They mark good entry and exit points. The blue
PipFinite Breakout EDGE
Karlo Wilson Vendiola
4.94 (654)
The Missing Edge You Need To Catch Breakouts Like A Pro. Follow a step-by-step system that detects the most powerful breakouts! Discover market patterns that generate massive rewards based on a proven and tested strategy. Unlock Your Serious Edge Important information here www.mql5.com/en/blogs/post/723208 The Reliable Expert Advisor Version Automate Breakout EDGE signals using "EA Breakout EDGE" Click Here Have access to the game changing strategy that will take your trading to the n
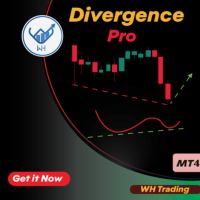
Sind Sie bereit, Ihr Trading auf die nächste Stufe zu heben? Wir stellen vor       WH       Divergence Pro MT4   , ein erweiterter Divergenzindikator, der Ihnen die Auswahl aus einer Vielzahl beliebter technischer Indikatoren ermöglicht. Jetzt können Sie Ihre Divergenzsignale an Ihre individuelle Handelsstrategie anpassen. Kontaktieren Sie mich nach dem Kauf, um Sie durch die Prozesse zu führen Hauptmerkmale   : Indikatorauswahl   : Wählen Sie Ihren bevorzugten Indikator aus den folgenden O
PipFinite Exit EDGE
Karlo Wilson Vendiola
4.89 (160)
Did You Have A Profitable Trade But Suddenly Reversed? In a solid strategy, exiting a trade is equally important as entering. Exit EDGE helps maximize your current trade profit and avoid turning winning trades to losers. Never Miss An Exit Signal Again Monitor all pairs and timeframes in just 1 chart www.mql5.com/en/blogs/post/726558 How To Trade You can close your open trades as soon as you receive a signal Close your Buy orders if you receive an Exit Buy Signal. Close your Sell orde
BeST_Hull MAs Directional Strategy is a Metatrader Indicator based on the corresponding Hull Moving Average.It timely locates the most likely points for Entering the Market as well as the most suitable Exit points and can be used either as a standalone Trading System or as an add-on to any Trading System for finding/confirming the most appropriate Entry or Exit points. This indicator does use only the directional slope and its turning points of Hull MAs to locate the Entry/Exit points while it a
UPD1 Pin Bar Dashboard
Vitaliy Kuznetsov
5 (2)
Die Anzeige zeigt das Kerzenmuster der Pin Bar an. Das Verhältnis von Schatten, Körper und Größe kann mit den Verhältniseinstellungen leicht angepasst werden. Es ist möglich, nach Trend (2 gleitende Durchschnitte) und nach Umkehrung (RSI und Bollinger-Bänder) zu filtern. Dies ist das beliebteste Muster von Price Action. Ein Multi-Currency-Dashboard ist verfügbar. Mit ihm können Sie ganz einfach zwischen den Diagrammen wechseln. Handelsmuster: Retest im Trend. Falscher Zusammenbruch. Andere.
To get access to MT5 version please click here . This is the exact conversion from TradingView: "UT Bot Alerts" by "QuantNomad". This is a light-load processing and non-repaint indicator. Buffers are available for processing in EAs. Candle color option is not available. You can message in private chat for further changes you need. Here is the source code of a simple Expert Advisor operating based on signals from  UT Bot Alerts . #property strict input string EA_Setting= "" ; input int magic_numb
DERZEIT 20% RABATT! Die beste Lösung für jeden Newbie oder Expert Trader! Dieser Indikator ist ein erschwingliches Handelsinstrument, da wir eine Reihe von proprietären Funktionen zusammen mit einer neuen Formel integriert haben. Der Advanced Accumulated Currency Volume Indicator ist spezialisiert auf die 28 wichtigsten Forex-Paare und funktioniert auf allen Zeitrahmen. Es handelt sich um eine neue Formel, die auf einem einzigen Chart das gesamte Währungsvolumen (C-Volumen) von AUD, CAD,
Key level breaker block
Presley Annais Tatenda Meck
5 (4)
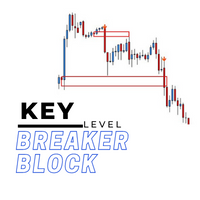
The key level breaker block indicator automatically draws breaker blocks for you on the chart. Breaker blocks are, in short, failed order blocks, but create strong support and resistance zones when price comes back to re-test them. Advantages  The key level breaker block DOES NOT RE-PAINT, giving you confidence when a signal appears and also helps when looking back.  The key level breaker block includes an on/off button on the chart to easily keep the charts clean after analysis by just o
VolumeDeltaM1
Stanislav Korotky
3.67 (3)
This indicator provides tick volume delta analysis on M1 timeframe. It monitors up and down ticks and sums them up as separate volumes for buys and sells, as well as their delta volumes, and volume clusters on price scale within a specified number of bars. This indicator complements VolumeDelta , which uses similar algorithms but does not process ticks and therefore cannot work on M1. VolumeDelta can show its signals on entire history because it reads M1 volumes for calculations on higher timefr
Gold Channel is a volatility-based indicator, developed with a specific timing algorithm for the XAUUSD pair, which consists of finding possible corrections in the market. This indicator shows two outer lines, an inner line (retracement line) and an arrow sign, where the theory of the channel is to help identify overbought and oversold conditions in the market. The market price will generally fall between the boundaries of the channel. If prices touch or move outside the channel it is a tra
40% off. Original price: $50 Ichimoku Trend Finder is a multi symbol multi timeframe trend dashboard that helps traders to monitor and identify potential market trends from one chart. This panel scans the Ichimoku Kinko Hyo indicator in 28 configurable instruments and 9 timeframes for classic Ichimoku trend signals  with a deep scan feature to scan all market watch symbols (up to 1000 instruments!).    Download Demo here  (Scans only M1 and M5) Settings description   here MT5 version   here
Der Boom and Crash Spike Detector Indikator ist basierend auf einer fortschrittlichen Strategie kodiert, hauptsächlich um den Boom und Crash in den Preisen zu erkennen. Komplexe Algorithmen wurden implantiert, um Booms und Crashs mit hoher Wahrscheinlichkeit in den Preisen zu erkennen. Es warnt vor möglichen Boom- oder Crash-Phasen: Boom-Phase: Wenn der Preis zu schnell steigt. Crash-Phase: Wenn der Preis zu schnell sinkt. ZEITLICH BEGRENZTES ANGEBOT: Der Indikator ist für nur 30$ und lebens
ECM Channel MT4
Paulo Rocha
5 (1)
ECM Elite Channel is a volatility-based indicator, developed with a specific time algorithm, which consists of finding possible corrections in the market. This indicator shows two outer lines, an inner line (retracement line) and an arrow sign, where the channel theory is to help identify overbought and oversold conditions in the market. The market price will generally fall between the boundaries of the channel. If prices touch or move outside the channel, it's a trading opportunity. The
Smart Liquidity Levels
Suvashish Halder
5 (1)
Smart Liquidity Levels is a valuable tool for identifying optimal liquidity levels, enabling retail traders like us to strategically set our stop-loss orders. T he essential tool for traders seeking to maximize their trading success.  The liquidity level is a critical component of inner circle trading (ICT). It assists us in determining when and how we should enter the market. Watch the video for detailed instructions. Here's why understanding liquidity levels is crucial in trading and how our
MACD Display is a MACD disaplay and cross monitoring indicator,which can works on 6 timeframe at same time. Indicator advantage: 1. Deviation from the point can be drawn on the main picture and indicator drawing. It is convenient to observe and can be hidden or displayed by parameter setting. 2. Deviation from the entry point is clearly indicated by the arrow in the drawing. 3. Cross-cycle monitoring can simultaneously monitor the MACD deviation and the golden dead fork of the six-cycle framewor
Dark Support Resistance  is an Indicator for intraday trading. This Indicator is programmed to identify  Support and Resistance Lines , providing a high level of accuracy and reliability. Key benefits Easily visible lines Only the most important levels will be displayed Automated adjustment for each timeframe and instrument Easy to use even for beginners Never repaints, never backpaints, Not Lag 100% compatible with Expert Advisor development All types of alerts available: Pop-up, Email, Pus
Auto TrendLine MT4
Vladimir Mametov
5 (1)
The indicator automatically plots significant trend lines and displays buy and sell signals.   Signals are generated for reflection and breakdown from support and resistance lines.   When a signal appears, the indicator displays it as an arrow of the specified color and also sends the message type specified in the input parameters.   In the indicator settings, you can set the signal type, the maximum distance to the trend line, the type of notifications, as well as the settings for lines and arr
Harmonic Pattern Scanner
Reza Aghajanpour
4.72 (18)
** All Symbols x All Time frames scan just by pressing scanner button ** *** Contact me after the purchase to send you instructions and add you in "Harmonic Scanner group" for sharing or seeing experiences with other users. Introduction Harmonic Patterns are best used to predict turning point. Harmonic Patterns give you high win rate and high opportunities for trade in during one day. This indicator detects the best and successful patterns base on Harmonic Trading books . The Harmonic Patterns S
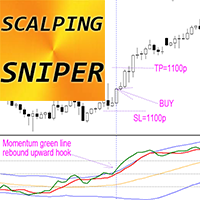
Forex Indicator SCALPING SNIPER for MT4 , No Repaint Trading System Scalping Sniper - is advanced system (indicator) showing accurate price momentum! Upgrade your trading methods with the professional   Scalping Sniper   Indicator for MT4. This system provide very accurate but rare sniping signals, with win rate up to 90% System suppose to use many pairs to search for signals to compensate low number of signals per one pair. Scalping Sniper  consist of:  Top & Bottom Volatility lines (Blue colo
RSI Alert Pro
Crispin Scruby
4.67 (3)
RSI Alert Pro is a highly configurable RSI indicator with rich alerts and RSI level monitoring features. Input Parameters Parameter Permitted Values Description Use Alerts Pro Voice Synthesis module true/false Provides voice synthesized alerts for Traders with the Alerts Pro module (additional purchase required) Enable Push Notifications true/false If set to true the system will send push notifications to any MT4 mobile platform the trader is licensed for RSI Period Integer values from 1
Cycle Finder Pro
Raymond Gilmour
5 (10)
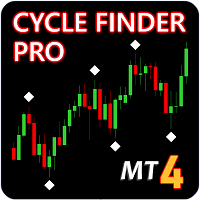
Update - Version 4.0 now includes trend change signal. Indicator will tell you the current trend on all charts. Cycle Finder Pro is a chart reading indicator and is designed for trend and pattern traders . Chart reading is time consuming and complex and requires knowledge of price action , cyclicity,  and time frame correlation . Cycle Finder Pro reads all this in one simple indicator so you can spot trend and chart patterns much easier and much faster.  To know if a trend exists on a chart you
Dies ist ein linearer Indikator für eine Währungsmacht mit der Fähigkeit, durch Glättungswerte zu filtern. Es zeigt die aktuelle Stärke ausgewählter Währungen (die maximale Anzahl ist 8) sowie historische Werte. Die Berechnung hängt vom ausgewählten Chart-Zeitrahmen ab, in dem der Indikator gestartet wird. Der Indikator zeigt Daten als Linien für alle Währungen oder als Histogramm für das aktuelle Währungspaar an. Der Schnittpunkt der Währungsstärkeindizes für das aktuelle Währungspaar wird zusä
Head and Shoulder MT4
Reza Aghajanpour
5 (5)
**   All Symbols   x   All Timeframes   scan just by pressing scanner button ** *** Contact me after the purchase to send you instructions and add you in "Head & Shoulders Scanner group" for sharing or seeing experiences with other users. Introduction: Head and Shoulders   Pattern  is a very repetitive common type of price reversal patterns. The pattern appears on all time frames and can be used by all types of traders and investors.   The  Head and Shoulders  Scanner indicator  Scans All charts
Dark Breakout
Marco Solito
4.8 (10)
Dark Breakout   is an Indicator for intraday trading. This Indicator is based on Trend Following  strategy, providing an entry signal on the breakout. The signal is provided by the arrow, which confirms the breaking of the level. We can enter in good price with this Indicator, in order to follow the main trend on the current instrument. It is advised to use low spread ECN brokers. This Indicator does Not repaint and N ot lag . Recommended timeframes are M5, M15 and H1. Recommended working pairs
Global Parabolic MT4 Indicator for scalping on M1-M5. A very good indicator for your trading system, it can be used as a standalone trading system, I recommend using it together with - System Trend Pro The indicator does not repaint and does not change its data. Settings: Change the FILTER parameter for accurate market entries. Any questions? Need help?, I am always happy to help, write me in private messages or In telegram: https://t.me/Trader35_Admin
HMA Trend Professional MT4
Pavel Zamoshnikov
4.63 (8)
Improved version of the free HMA Trend indicator (for MetaTrader 4) with statistical analysis. HMA Trend is a trend indicator based on the Hull Moving Average (HMA) with two periods. HMA with a slow period identifies the trend, while HMA with a fast period determines the short-term movements and signals in the trend direction. The main differences from the free version: Ability to predict the probability of a trend reversal using analysis of history data. Plotting statistical charts for analyz
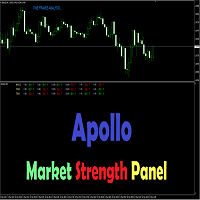
Das Apollo Market Strength Panel ist ein Multi-Timeframe-Indikator, der für Forex- und Binäroptionshändler hilfreich sein kann. Das Panel repräsentiert die Marktbedingungen in mehreren Zeitrahmen von M1 bis H4. Der Indikator liefert Informationen zu drei wichtigen Marktaspekten. Sie sind Trend, Kraft und Impuls. Wenn alle diese 3 Komponenten übereinstimmen, liefert Ihnen der Indikator je nach Marktrichtung ein KAUF- oder VERKAUFS-Signal. Der Indikator zeichnet Signale direkt auf Ihrem Chart. Sie
Gann Zone Pro
Kirill Borovskii
This indicator identifies and displays zones, as it were areas of strength, where the price will unfold. The indicator can work on any chart, any instrument, at any timeframe. The indicator has two modes. The indicator is equipped with a control panel with buttons for convenience and split into two modes. Manual mode: To work with manual mode, you need to press the NEW button, a segment will appear. This segment is stretched over the movement and the LVL button is pressed. The level is displayed

Der MetaTrader Market ermöglicht, Programme für die MetaTrader Plattform sicher zu kaufen. Sie können Demoversionen gewünschter Roboter und Indikatoren direkt im Terminal herunterladen und diese im Strategietester prüfen.

Testen Sie Programme in unterschiedlichen Modi vor dem Kauf, um eine Vorstellung vom Produkt zu bekommen, und bezahlen Sie das Produkt über das Zahlungssystem der MQL5.community.

Mit dem Zahlungssystem der MQL5.community kann man Produkte bezahlen und dank der Möglichkeit, das Produkt vor dem Kauf in verschiedenen Modi zu testen, können Kunden eine Vorstellung vom Produkt bekommen.