당사 팬 페이지에 가입하십시오
- 조회수:
- 35413
- 평가:
- 게시됨:
- 업데이트됨:
-
이 코드를 기반으로 한 로봇이나 지표가 필요하신가요? 프리랜스로 주문하세요 프리랜스로 이동
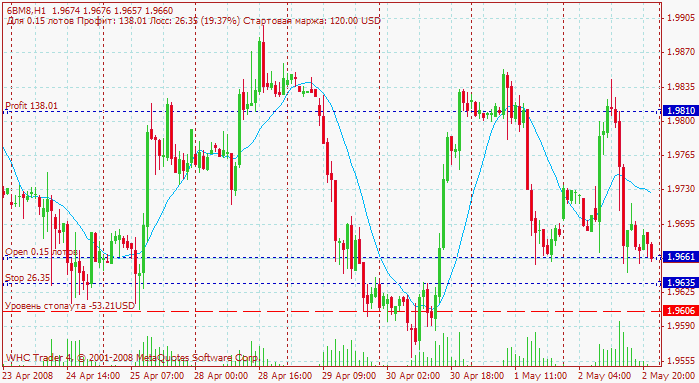
The indicator is aimed at calculation of orders. Create in the chart three lines named OPEN, STOP, PROFIT, and place them, respectively, at the levels, at which you are going to open an order (OPEN), place a StopLoss (STOP) and/or a TakeProfit (PROFIT). If there are no such lines in the chart, the indicator will create them automatically near the current market price. In the indicator properties, set the volume to open positions with (calc_lots) and the amount of commission (comission) for Futures and CFD, if the trade should be calculated for these securities (commission in US dollars per lot for Futures, commissions per share in percents for CFD). If one lot in CFD is equal to 100 shares, not to only one, then set the parameter named stock_in_lot for 100. For the symbols, in which profits are calculated in euros or pounds (FDAX, FTSE), нit is necessary to display in the Market Watch window the pairs of EURUSD or GPBUSD, respectively, then the rates will be automatically taken from the corresponding forex pairs. Similarly, for any cross-currencies, XXXYYY, there must be opened corresponding basic pairs USDYYY (for example, for GPBJPY, there must be opened USDJPY in the Market Watch window). After you have placed SL and TP lines at necessary levels, the indicator will automatically display in the upper left corner of the chart the amounts (in dollars) of profits for TP, of losses for SL, and of the supporting margin for the given amount of lots. The indicator will also draw in your chart a line for StopOut to become triggered as soon as this line is reached. To calculate new values, it will be sufficient just to drag the lines in the chart.

Calculator's Appearance in the Chart
Recommendations:
- The values are updated at each new tick, so you should press with the right button of your mouse in the chart and select "Update" to obtain new values for low-liquidity securities or during breaks between sessions.
- To see what line is where (the description of your lines), check "Show object descriptions" in the chart properties.
- Lines set by the indicator represent standard graphical objects, so you can select their color, line thickness and hatch type in the "Object List" menu that appears when you click in the chart with the right button of your mouse.
MetaQuotes Ltd에서 러시아어로 번역함.
원본 코드: https://www.mql5.com/ru/code/8133
 Clock v 1.3
The indicator shows in the chart the current time in different time zones.
 FX-CHAOS - SECOND EDITION
Trading strategy named Fx-chaos is the result of integration of Bill Williams' Chaos Theory, A. Elders' trading strategy (triple choice), and Ryan Jones' Fixed Ratio money management method.
 Halifax
Leading Edge trend estimator with bands.
 GTerminal_V5 Graphic orders and indicators
Execution of orders by slanting lines. For the purposes of real trading and learning, graphical orders are implemented in Tester. The EA was evaluated on MQL4 Forum. Version_V5 considers all the suggestions and wishes.