당사 팬 페이지에 가입하십시오
- 조회수:
- 7410
- 평가:
- 게시됨:
- 업데이트됨:
-
이 코드를 기반으로 한 로봇이나 지표가 필요하신가요? 프리랜스로 주문하세요 프리랜스로 이동
The Exp_AFIRMA Expert Advisor is based on the signals of the AFIRMA (Autoregressive Finite Impulse Response Moving Average) indicator.
The signal is formed when a bar is closing if the direction of the indicator has changed. Be aware that the AFIRMA indicator can be redrawn, so the MA state on closed bars near the current bar during a transaction can significantly differ after some time.
For a correct operation of the EA, place the compiled indicator file AFIRMA.ex5 to terminal_data_folder\MQL5\Indicators.
Note that the TradeAlgorithms.mqh library file allows using Expert Advisors with brokers who offer nonzero spread and the option of setting Stop Loss and Take Profit together with position opening. You can download more variants of the library at the following link: Trade Algorithms.
Default Expert Advisor's input parameters have been used during the tests shown below. Stop Loss and Take Profit have not been used during the tests.

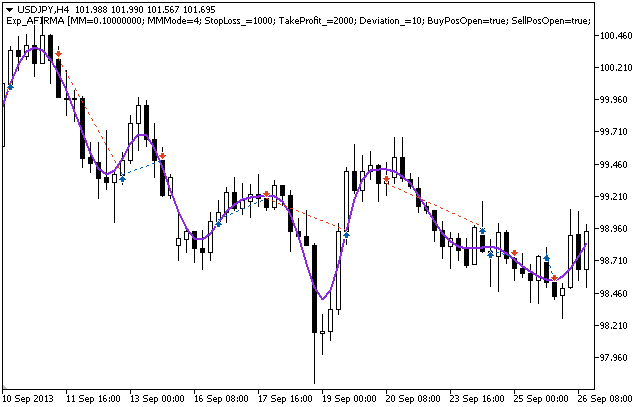
Figure 1 The instances of history of deals on the chart.
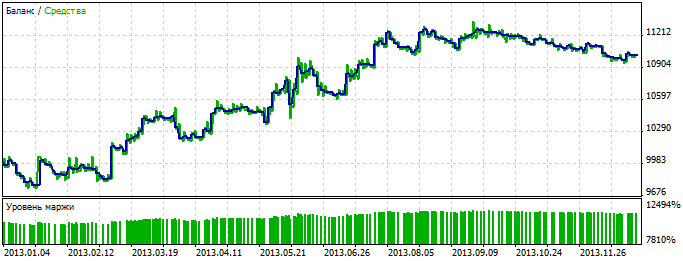
Testing results for 2013 at USDJPY H4:

Figure 2. Chart of testing results
MetaQuotes Ltd에서 러시아어로 번역함.
원본 코드: https://www.mql5.com/ru/code/2288
 iMirror
The iMirror indicator shows a prices mirrored upside down. When the mouse is on the indicator, its color changes to the chart color, while the chart is dimmed. When you click on the indicator, it remains in the foreground till another click.
 X4Period_MFI_Arrows
Four semaphore signal indicators based on MFI oscillators with different periods on one price chart.
 MFI_3HTF
Three MFI (Money Flow Index) oscillators with three different timeframes on one chart.
 HIGHEST_HIGH_VALUE
The indicator shows the maximum price for the period specified in the input parameters of the indicator.
