당사 팬 페이지에 가입하십시오
- 조회수:
- 10778
- 평가:
- 게시됨:
-
이 코드를 기반으로 한 로봇이나 지표가 필요하신가요? 프리랜스로 주문하세요 프리랜스로 이동
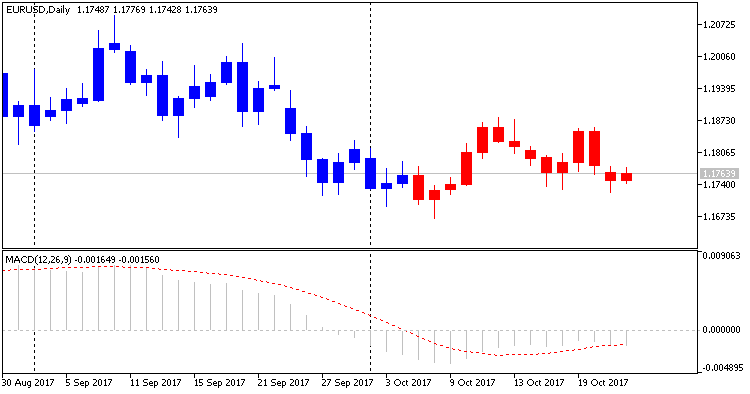
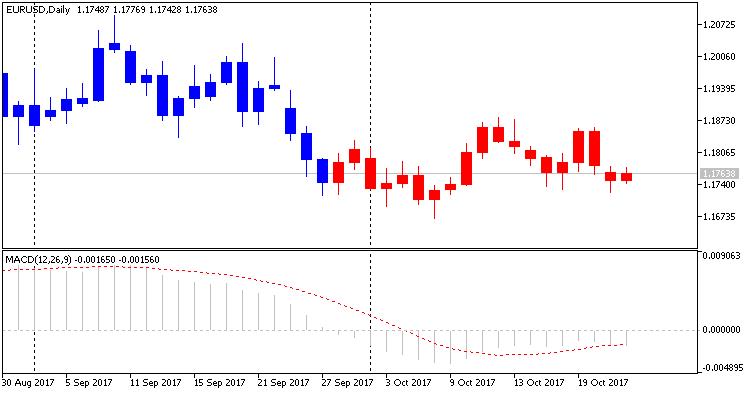
The "MACD Crossing the zero level" indicator uses the DRAW_COLOR_CANDLES style to draw areas, in which MACD is above or below the zero line.
In the indicator settings, you can select the MACD line to show areas for, i.e. the main or the signal line:

Fig. 1. Displaying areas for the MACD signal line

Fig. 2. Displaying areas for the MACD main line
MetaQuotes Ltd에서 러시아어로 번역함.
원본 코드: https://www.mql5.com/ru/code/19302
 MACD Crossing the zero level
Displays areas, in which the MACD indicator crosses the zero line.
 An abstract trading robot, an OOP pattern
An example of a template for developing automated trading systems.
 Statistics of candles
Counting the number of series of bullish and bearish bars. Displaying the result as a chart. Saving the screenshot of the resulting chart. The script uses the CGraphic class.
 WPRValues
The indicator shows a text block with the values of the user defined WRP oscillator period for each timeframe.