당사 팬 페이지에 가입하십시오
- 조회수:
- 8993
- 평가:
- 게시됨:
- 업데이트됨:
-
이 코드를 기반으로 한 로봇이나 지표가 필요하신가요? 프리랜스로 주문하세요 프리랜스로 이동
Real author:
Fedor Igumnov
A combined indicator, built on the basis of two RSI oscillators.
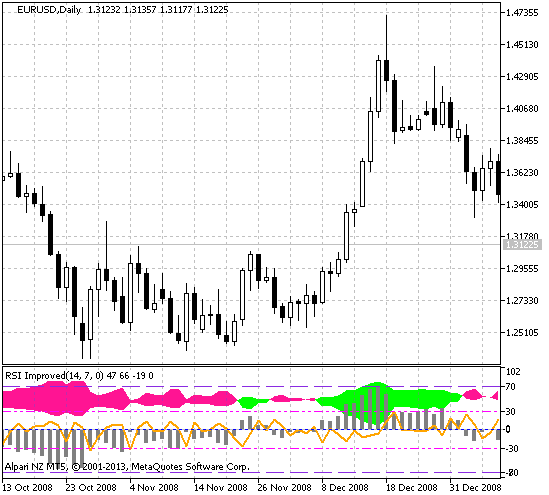
This indicator calculates the value of the RSI indicator with the RSIPeriodOriginal period and the value of RSI with the RSIPeriodRotated period. Then it turns RSIPeriodRotated 180 degrees relative to the level of 50 points (100-RSI). Finds the difference between the original value of the first indicator and the inverted value of the second one. Then it calculates the derivative of this difference.
The colored cloud is formed from two RSI indicators.
A gray histogram is the difference between the original value and the inverted value.
An orange line is a derivative of the histogram (the rate of change of the difference between the original value and the inverted value).

Figure 1. The RSIImproved indicator
MetaQuotes Ltd에서 러시아어로 번역함.
원본 코드: https://www.mql5.com/ru/code/1788
 Trend Score
A simple trend indicator based on counting of the number of bullish and bearish candlesticks.
 Hull_Candles
An indicator in the form of candlesticks based on the Heiken Ashi algorithms and two averages.
 Relative Momentum Index (RMI)
The RMI (Relative Momentum Index) indicator is an improved version of RSI, momentum is included in the calculation.
 ImpulseOsMA
The indicator draws bars based on Elder's impulse system.