당사 팬 페이지에 가입하십시오
- 조회수:
- 8243
- 평가:
- 게시됨:
- 업데이트됨:
-
이 코드를 기반으로 한 로봇이나 지표가 필요하신가요? 프리랜스로 주문하세요 프리랜스로 이동
The real author:
Gryb Alexander
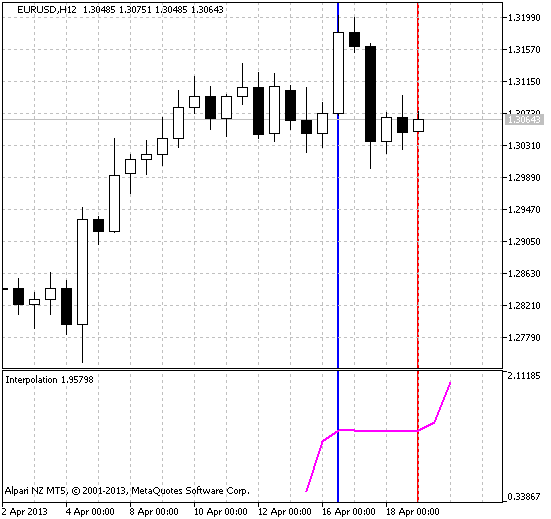
The Lagrange interpolating polynomial is used to determine the functions by the specified points. In fact, the indicator takes the coordinates of price points between input int ibegin and input int iend (They are drawn by red and blue lines in the chart) and with the help of the Lagrange interpolating polynomial it calculates the coordinates of the next points.
Remarks:
- iend-ibegin = the degree of the polinomial. That is, if the distance between ibegin and iend is equal to two, then the chart will be a parabola, if the three, it will be hyperbola, etc.
Indicator input parameters:
//+----------------------------------------------+
//|  INDICATOR INPUT PARAMETERS                  |
//+----------------------------------------------+
input uint inumPrognoz=2;  // Number of predicted bars
input uint ibegin=0;       // Starting bar for the analysis
input uint iend=5;         // Last bar for the analysis
This indicator was first implemented in MQL4 and published in Code Base at mql4.com on 15.11.2008.

Fig.1 The Interpolation indicator
MetaQuotes Ltd에서 러시아어로 번역함.
원본 코드: https://www.mql5.com/ru/code/1662
 FullSSA
The redrawing oscillator drawn on the basis of the SSA.mqh singular transformation library of functions
 Waddah_Attar_Def_RSI
The MACD smoothed histogram drawn on the basis of the RSI technical indicator.