당사 팬 페이지에 가입하십시오
- 조회수:
- 10041
- 평가:
- 게시됨:
- 업데이트됨:
-
이 코드를 기반으로 한 로봇이나 지표가 필요하신가요? 프리랜스로 주문하세요 프리랜스로 이동
Real author:
klot
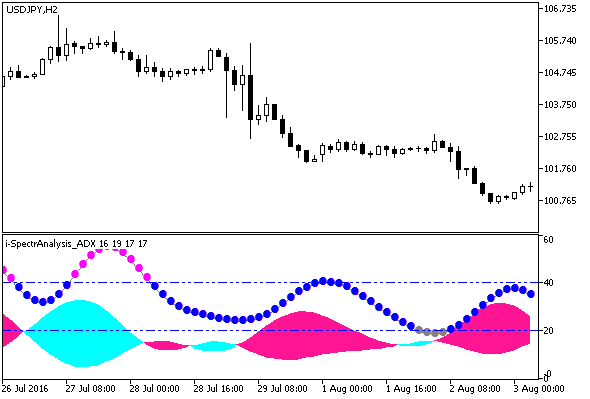
The indicator is an example of smoothing a time series of the ADX indicator by filtering harmonics of higher order.
This approach can be applied to smooth the values of any indicators. The main advantage of the method is virtually no delay.
Indicator input parameters:
//+----------------------------------------------+
//| Indicator input parameters                   |
//+----------------------------------------------+
input uint ADXPeriod=14;                          // averaging period
input uint N = 7;                                 // number Length
input uint SS = 20;                               // smoothing factor
input int Shift=0;                                // The shift indicator in the horizontal bars
input uint ExtraHighLevel=60;                     // Maximum trend level
input uint HighLevel=40;                          // Strong trend level
input uint LowLevel=20;                           // Weak trend level
input ENUM_LINE_STYLE LevelStyle=STYLE_DASHDOTDOT;// Style of level lines
input color LevelColor=clrBlue;                   // Color of levels
input ENUM_WIDTH LevelWidth=w_1;                  // Width of levels
where:
- N — series length (power of two);
- SS — Smoothing coefficient, zeroes the frequencies above the specified value in the obtained spectrum. SS cannot be greater than 2^N. If SS = 2^N, the ADX series is fully repeated.
The indicator operation requires the library: https://www.mql5.com/en/code/7000.

Fig.1. The i-SpectrAnalysis_ADX indicator
MetaQuotes Ltd에서 러시아어로 번역함.
원본 코드: https://www.mql5.com/ru/code/16074
 i-CAi_Cloud_Digit
The i-CAi indicator that fills the chart space with a colored background and displays the most recent value as a price label with the possibility to round the channel levels up to a required number of digits, as well as displays a price grid with those rounded values.
 CandlesticksBW
The indicator colors the candlesticks according to B. Williams.
 i-SpectrAnalysis_RVI
The indicator is an example of smoothing a time series of the RVI indicator by filtering harmonics of higher order.
 i-SpectrAnalysis_OsMA
The indicator is an example of smoothing a time series of the OsMA indicator by filtering harmonics of higher order.