거래 로봇을 무료로 다운로드 하는 법을 시청해보세요
당사를 Facebook에서 찾아주십시오!
당사 팬 페이지에 가입하십시오
당사 팬 페이지에 가입하십시오
스크립트가 마음에 드시나요? MetaTrader 5 터미널에서 시도해보십시오
- 조회수:
- 8485
- 평가:
- 게시됨:
- 업데이트됨:
-
이 코드를 기반으로 한 로봇이나 지표가 필요하신가요? 프리랜스로 주문하세요 프리랜스로 이동
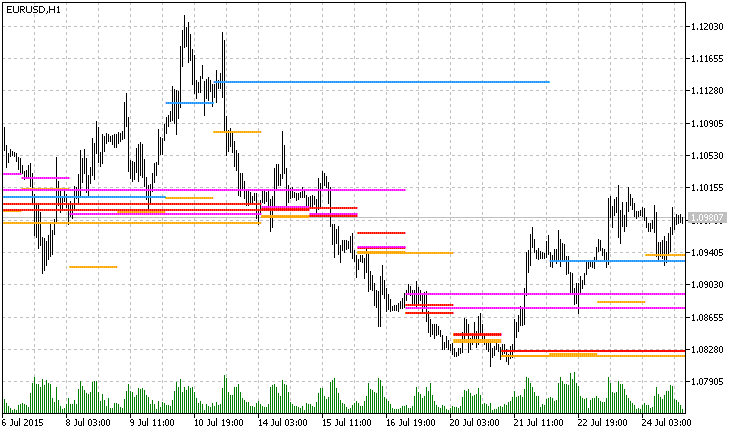
This indicator shows the support/resistance lines using price histogram. The indicator is not so heavy, the calculation was simplified.
Display:
- Gold Line — peaks of a 1-day histogram.
- Red Line — peaks of a short term histogram.
- Magenta Line — peaks of a medium term histogram.
- Blue Line — peaks of a long term histogram.

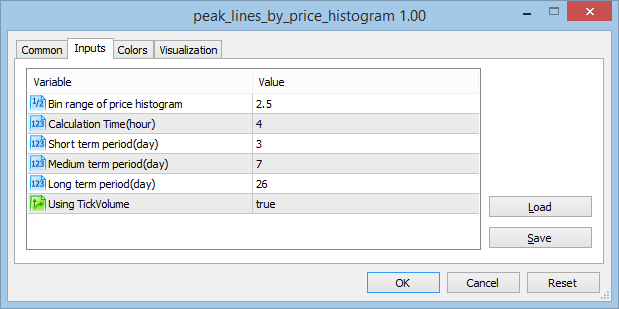
Settings:

 MomentumCloud
Cloud indicator, the envelopes of which represent the Momentum oscillator values calculated for High and Low prices.
 ColorZerolagTriXOSMATrend_x10
The ColorZerolagTriXOSMATrend_x10 indicator shows the ColorZerolagTriXOSMA oscillator direction from ten different timeframes.
 ColorZerolagRSIOSMA_HTF
The ColorZerolagRSIOSMA indicator with the timeframe selection option available in the input parameters.
 ColorZerolagRSIOSMACandle
The ColorZerolagRSIOSMA indicator implemented as a sequence of candlesticks.