당사 팬 페이지에 가입하십시오
- 조회수:
- 6992
- 평가:
- 게시됨:
- 업데이트됨:
-
이 코드를 기반으로 한 로봇이나 지표가 필요하신가요? 프리랜스로 주문하세요 프리랜스로 이동
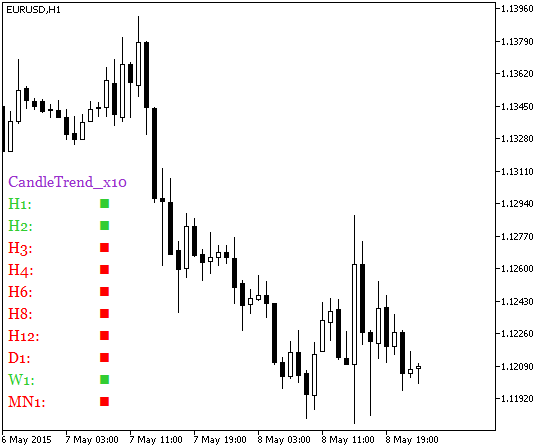
The CandleTrend_x10 indicator shows price movement from ten different timeframes. Downward movement paints the colored squares in red, upward movement — in green. The indicator uses the values of the last closed bars.
Indicator input parameters:
//+----------------------------------------------+
//| Indicator input parameters                   |
//+----------------------------------------------+
input ENUM_TIMEFRAMES TimeFrame0=PERIOD_H1;           // Chart 1 period
input ENUM_TIMEFRAMES TimeFrame1=PERIOD_H2;           // Chart 2 period
input ENUM_TIMEFRAMES TimeFrame2=PERIOD_H3;           // Chart 3 period
input ENUM_TIMEFRAMES TimeFrame3=PERIOD_H4;           // Chart 4 period
input ENUM_TIMEFRAMES TimeFrame4=PERIOD_H6;           // Chart 5 period
input ENUM_TIMEFRAMES TimeFrame5=PERIOD_H8;           // Chart 6 period
input ENUM_TIMEFRAMES TimeFrame6=PERIOD_H12;          // Chart 7 period
input ENUM_TIMEFRAMES TimeFrame7=PERIOD_D1;           // Chart 8 period
input ENUM_TIMEFRAMES TimeFrame8=PERIOD_W1;           // Chart 9 period
input ENUM_TIMEFRAMES TimeFrame9=PERIOD_MN1;          // Chart 10 period
input color  CpColor=clrDarkOrchid;                   // Indicator name color
input color  UpColor=clrLimeGreen;                    // Upward movement color
input color  DnColor=clrRed;                          // Downward movement color
input color  ZrColor=clrGray;                         // No changes color
input int    FontSize=11;                             // Font size
input type_font FontType=Font14;                      // Font type
input ENUM_BASE_CORNER  WhatCorner=CORNER_LEFT_LOWER; // Display corner
input uint Y_=20;                                     // Vertical coordinate
input uint X_=5;                                      // Horizontal coordinate

Fig.1. The CandleTrend_x10 indicator
MetaQuotes Ltd에서 러시아어로 번역함.
원본 코드: https://www.mql5.com/ru/code/12982
 BullsBearsSign
Semaphore signal indicator based on the BullsBears indicator algorithm.
 BinaryWave_StDev
The BinaryWave indicator with additional trend strength indication using colored dots based on the standard deviation algorithm.
 RSITrend_x10
The RSITrend_x10 indicator shows the RSI oscillator position from ten different timeframes.
 MultiRSITrend_x10
The MultiRSITrend_x10 indicator shows information on current trends using the RSI oscillator position from ten different timeframes.