Santiago Nicolas Pla Casuriaga / プロファイル
- 情報
|
no
経験
|
5
製品
|
2
デモバージョン
|
|
0
ジョブ
|
0
シグナル
|
0
購読者
|
無料インジケーター
CSI Currency Strength — マルチルックバックのモメンタムモデル(Asness, Moskowitz & Pedersen, 2013)。3 つの時間軸で加重した Z スコアを用いて G10 通貨をランク付けし、単一期間アプローチに見られる「クリフエッジ」現象を排除します。 Carry Trade Monitor — Market Watch を自動的にスキャンし、スワップが発生するすべての通貨ペアを年率換算キャリー利回りでランク付けします。設定は不要です。 Monte Carlo Equity Projection — 自身の口座の決済済み取引履歴に対してブートストラップシミュレーションを実行し、将来のエクイティ推移のパーセンタイルコーンをチャート上に直接投影します。想定リターン分布なし、外部データソースなし——すべての計算はローカルで実行されます。
プレミアム
GI FX Terminal — ウェブターミナルのネイティブ MT5 コンパニオン。13 のデータパネルすべてを、ちらつきのない単一の canvas オーバーレイ上にレンダリング:FX ペアテーブル、CB Rates & Bias、Carry Trade Monitor(ブローカーのライブスワップレート)、Open Positions、COT Positioning、Composite Score、Retail Sentiment、Correlation Matrix、Economic Calendar、Economic Surprise Index(ESI)、Currency Strength(CSI)、Volatility & Options、Market Sessions。CB バイアスの変化、金利確率の変化、新しい COT データ、スワップレートの変化、影響度の高いカレンダーイベントなどを、MT5 ポップアップまたは MetaTrader 5 アプリへのモバイルプッシュ通知として届ける、完全なアラートシステムを搭載しています。レンタルにはウェブターミナルへのフルアクセスが含まれます。
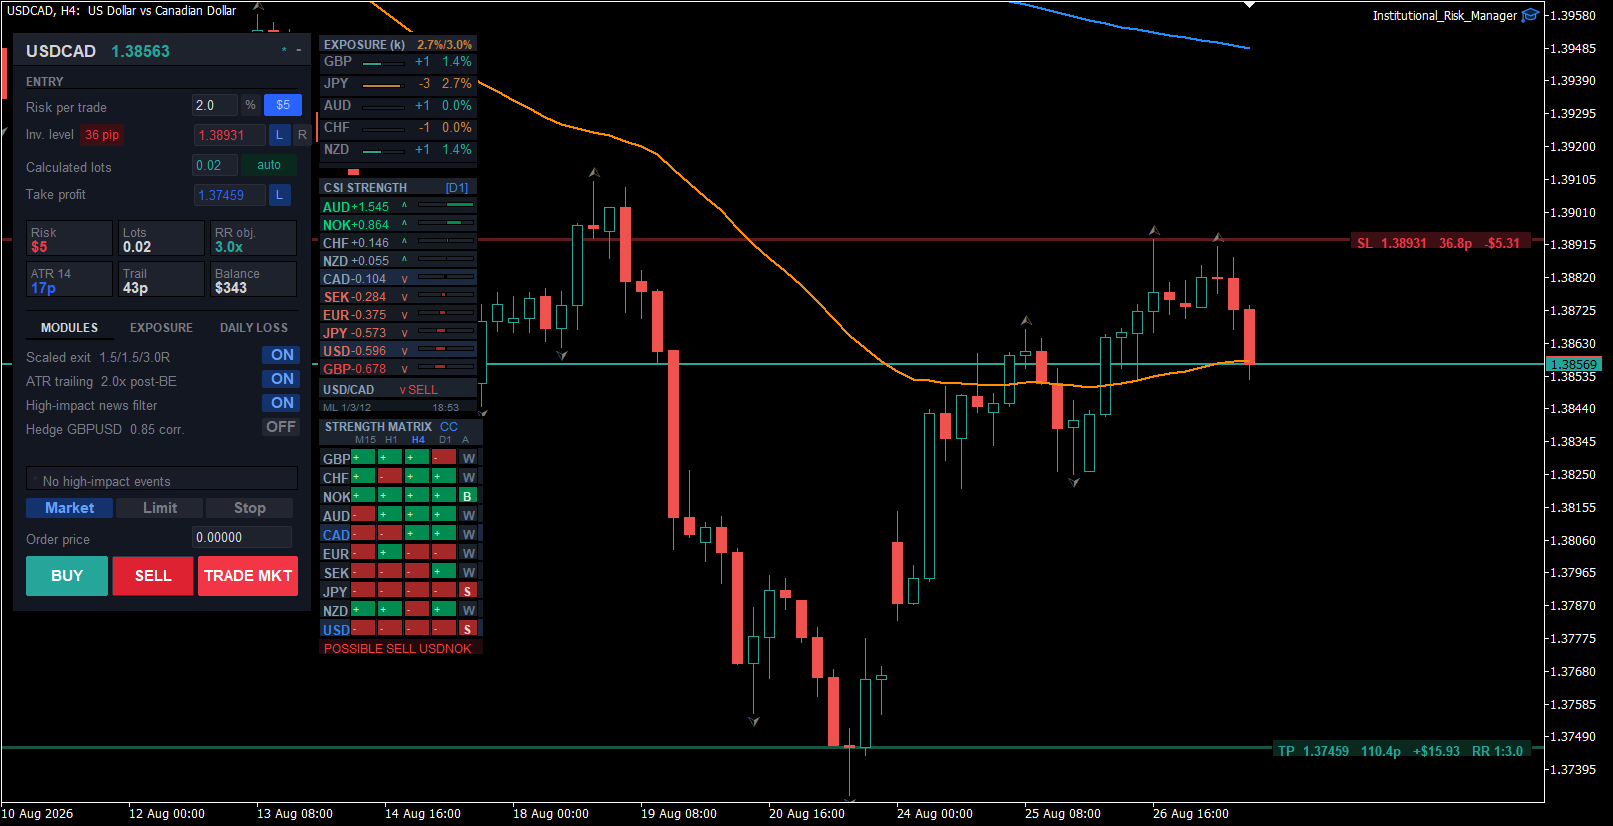
Institutional Risk Manager — プロフェッショナル向けトレード管理 EA。ATR ベースのポジションサイジング、設定可能な段階的決済、ブレークイーブンの自動化、ポートフォリオエクスポージャーの監視、ヘッジモジュール、統合された CSI + Strength Matrix サブパネルを備えています。
すべてのツールは一貫したダークなモノスペース美学を共有しており、同じトレーディングデスク上で互いを補完するように設計されています。
新規ユーザー向けのウェブターミナルの拡張アクセスは、MQL5 メッセージを通じて直接調整できます。
Retail EAs manage a stop loss. A trading desk manages exposure — that's the gap this update closes.
Portfolio exposure now checks both the base and quote leg of every pair, so three "independent" trades that are actually the same directional bet on one currency get caught, not undercounted — the same netting principle a bank FX desk applies across correlated books.
New live exposure monitor: alerts when a currency is already over the configured limit from price movement alone, even without opening a new trade from the panel.
New daily loss circuit breaker: a hard stop tied to start-of-day balance, with an optional force-close-all — the mechanical equivalent of a desk's daily loss limit.
New position-size caps: a hard max lot size and max notional per trade sit underneath the risk-based sizing as a backstop, independent of stop distance.
Risk Limits panel reorganized into tabs (Modules / Exposure / Daily Loss) for faster access.
Product: https://www.mql5.com/en/market/product/180324
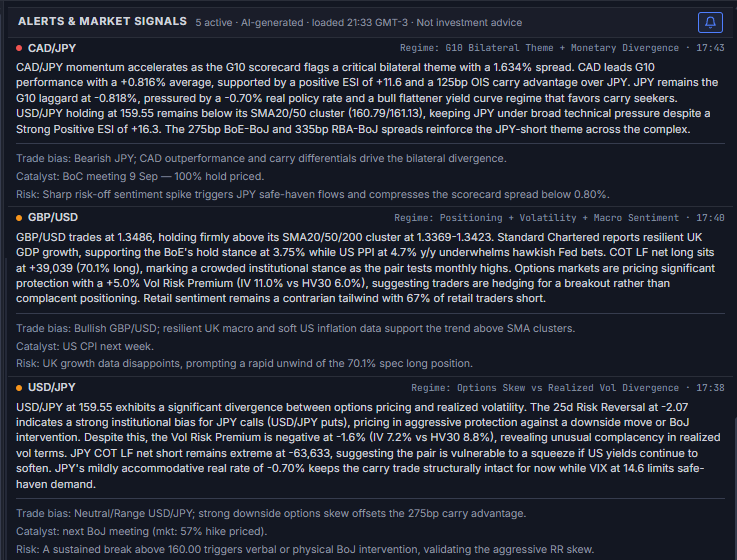
The terminal already consolidates price action, positioning, central bank rate expectations, and carry differentials in one screen. This release adds a layer on top: AI reading that same data in real time and producing the kind of read a desk analyst would deliver — without the analyst.
Three components:
Alerts & Market Signals — five live AI-generated alerts, each structured like an institutional morning note: regime (positioning, rate, or volatility story), directional bias, the catalyst that confirms or breaks the thesis, and the risk that invalidates it. Every field sourced from data already on the page.
AI Narrative — one paragraph, regenerated each session, synthesizing FX, rates, and risk sentiment into a single cross-market read.
AI Analytics — per-currency macro drivers, session-by-session commentary (Sydney, Tokyo, London, New York), and pair-by-pair strength attribution — not just which currency is outperforming, but the rate differential and positioning behind it.
Nothing here is a black box. Every number the AI references — carry spread, ESI reading, OIS-implied bias — is a panel you can open and verify on the same page.
Browser-based, broker-agnostic. The same alert logic also runs inside the MT5 companion tools for active EA rentals.
https://www.youtube.com/watch?v=Y44by1YJBVU
EUR is showing a policy/positioning divergence worth flagging today. Rates are pricing a hawkish bias — CB Rates & Bias shows EUR at 2.40% with a HIKE tag — in line with today's headline flow: ECB commentary described as hawkish, with Simkus reportedly raising the odds of a further move.
That stance sits against leveraged-fund COT positioning still net short EUR at -33.5%, and a Composite Score reading of -3.0.
Price action adds a second layer: EUR/USD is trading below its SMA20 (1.142), SMA50 (1.1507), and SMA200 (1.164) on the daily — technically heavy even as the rate-path narrative turns hawkish.
Hawkish bias, net-short positioning, and a technically heavy chart rarely stay aligned for long. Worth tracking into the next ECB meeting.
Sourced live from the EUR/USD Pair Detail panel.
Monte Carlo Equity Projection は、口座自身の決済済み取引履歴に対してブートストラップ・シミュレーションを実行し、将来のエクイティ推移をパーセンタイル・コーンとしてチャート上に直接投影します——リターン分布の仮定も、外部データフィードも不要です。 任意のチャートにアタッチすると、ネイティブのMT5 APIを通じて口座の実際の決済済み取引を読み込み、復元抽出により何千回も再サンプリングを行い、現在の統計が示す現実的な結果の範囲をプロットします——固定されたバックテストの1本の線ではありません。すべての計算はローカルで実行され、外部サーバーへの接続やWebRequestは一切なく、インターネット権限も必要ありません。 単一のバックテストではなく再サンプリングを用いる理由
Global Investing FX Terminal は、MetaTrader 5 向けのオールインワン FX ダッシュボードです——中央銀行政策金利、CFTC COT ポジション、キャリーランキング、経済サプライズ、オプションスキュー、リテールセンチメント、相関まで、合計 13 のアナリティクスパネルを、ちらつきのない単一キャンバス上に表示し、単一の EA から 10 秒ごとに更新します。外部ソフトウェア不要です。 プロの FX 分析には、通常は別々のプラットフォームに分散しているデータへの同時アクセスが欠かせません。レートデリバティブ、政府統計ポータル、ブローカーのスワップ仕様、オプションデスク——このEAはそれらすべてを、実際に売買判断を下すトレーディングターミナルの単一画面に集約します。 ダッシュボードの表示内容 マーケットオーバービュー FX ペアテーブル — G10 全 28 ペアに加え、ブローカーの Market Watch に NOK/SEK クロスが存在する場合はそれも含めた最大 36 ペアのリアルタイム
Institutional Risk Manager は、ポジションサイズの計算、注文執行、分割決済、トレーリングストップ、ポートフォリオのエクスポージャー監視、日次損失制限、イベントベースのフィルターを、MetaTrader 5上の単一のチャートパネルからまとめて管理します。 ロット数は口座残高とストップ距離から自動的に計算されます。分割決済は設定可能なRマルチプルで執行され、最終目標にはブローカー側のTPが設定されるため、EAがオフラインでも決済は有効です。リスク規律は手動ではなく、機械的に強制されます。 リスクエンジン
The Carry Trade Monitor is a chart indicator for MetaTrader 5 that automatically scans all symbols in the Market Watch and ranks every swap-paying pair by annualised carry yield, displayed as a live on-chart panel. No configuration is required — attach to any chart and it runs immediately. Carry yield calculations read directly from the broker's own swap specifications via the MT5 symbol feed. There is no external data source, no URL permission required, and no dependency on third-party rate
The CSI Currency Strength indicator ranks all ten G10 currencies by momentum strength using a multi-lookback Z-score model, displayed as a live on-chart panel. Attached to any chart, it runs independently of the chart's symbol or timeframe. The methodology follows the multi-horizon momentum framework from Asness, Moskowitz & Pedersen (2013), applied cross-sectionally to G10 currencies. Rather than comparing a single bar against the previous close — which introduces a cliff-edge artifact at