Santiago Nicolas Pla Casuriaga / Profil
- Informations
|
Aucun
expérience
|
7
produits
|
3
versions de démo
|
|
0
offres d’emploi
|
0
signaux
|
0
les abonnés
|
Indicateurs gratuits
CSI Currency Strength — Modèle de momentum multi-lookback (Asness, Moskowitz & Pedersen 2013). Classe les devises G10 à l'aide de Z-scores pondérés sur trois horizons temporels, éliminant l'artefact de "cliff-edge" des approches à période unique. Carry Trade Monitor — Scanne automatiquement le Market Watch et classe toutes les paires à swap par rendement de carry annualisé. Aucune configuration requise. Monte Carlo Equity Projection — Simulation bootstrap sur l'historique des trades clôturés de votre propre compte, projetant un cône de percentiles d'équité future directement sur le graphique. Aucune distribution de rendement supposée, aucune source de données externe — tout le calcul s'exécute localement.
Premium
GI FX Terminal — Le compagnon natif MT5 du terminal web. Les 13 panneaux de données rendus sur un seul overlay canvas sans scintillement : tableau des paires FX, CB Rates & Bias, Carry Trade Monitor (swaps en direct du broker), Open Positions, COT Positioning, Composite Score, Retail Sentiment, Correlation Matrix, Economic Calendar, Economic Surprise Index (ESI), Currency Strength (CSI), Volatility & Options, et Market Sessions. Comprend un système d'alertes complet — changements de biais CB, changements de probabilité de taux, nouvelles données COT, changements de swap, événements du calendrier à fort impact — livrées sous forme de popups MT5 ou de notifications push sur l'application mobile MetaTrader 5. La location inclut l'accès complet au terminal web.
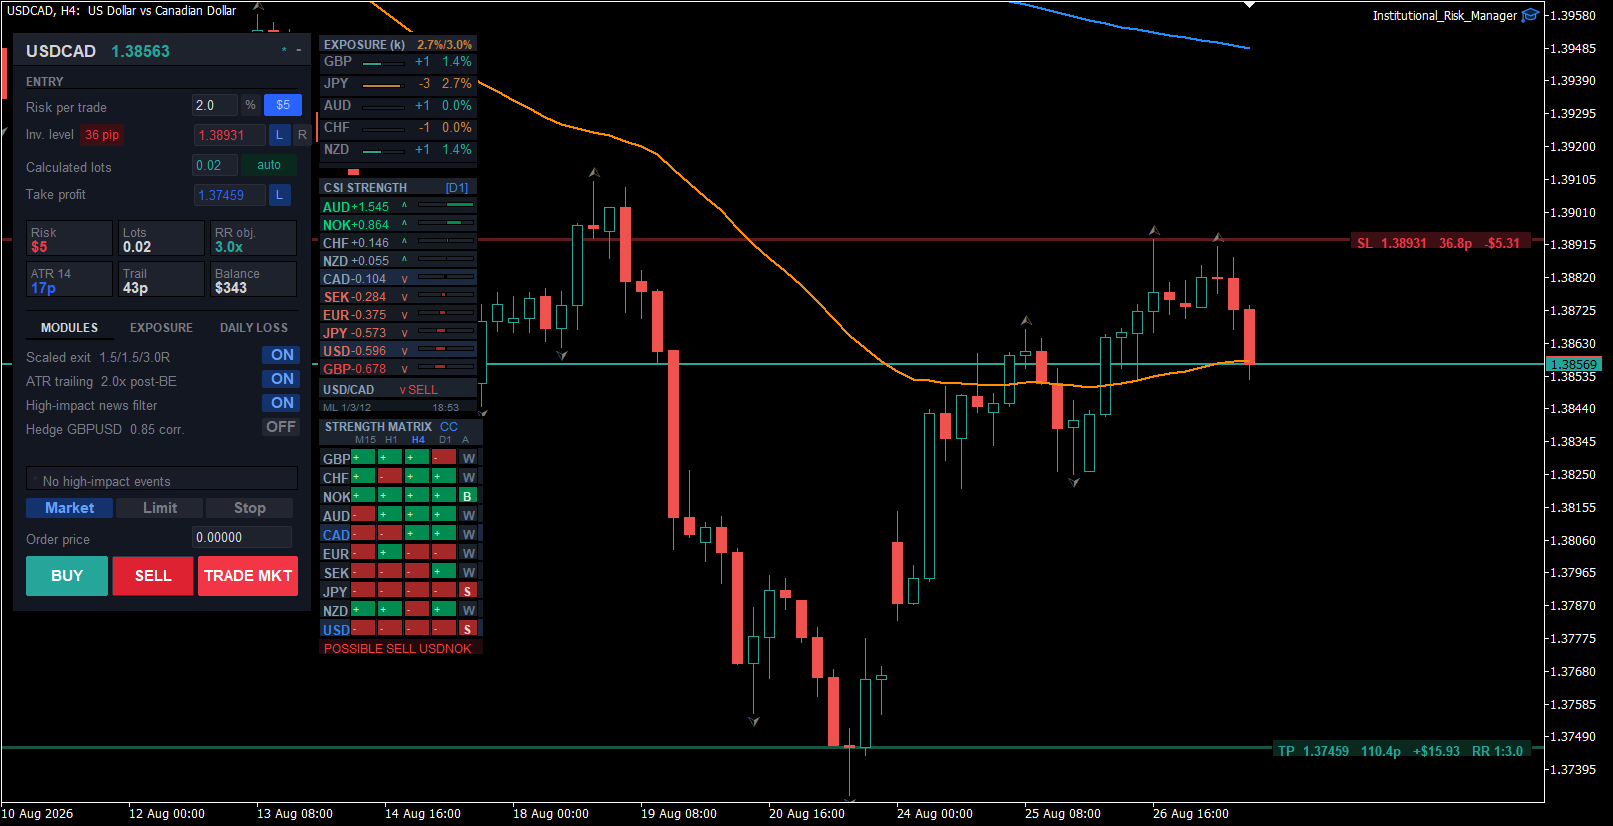
Institutional Risk Manager — EA professionnel de gestion des trades. Dimensionnement de position basé sur l'ATR, sorties échelonnées configurables, automatisation du breakeven, surveillance de l'exposition du portefeuille, module de hedge, et un sous-panneau intégré CSI + Strength Matrix.
Tous les outils partagent une esthétique monospace sombre cohérente et sont conçus pour se compléter sur le même desk de trading.
L'accès étendu au terminal web pour les nouveaux utilisateurs peut être organisé directement via la messagerie MQL5.
https://www.youtube.com/watch?v=qPX_9m74k4E

https://www.youtube.com/watch?v=qPX_9m74k4E
The Keltner Bands Stop is a trend-following stop indicator for MetaTrader 5 that plots a self-adjusting stop-loss level on a Keltner Channel — an EMA midline plus/minus an ATR multiple — flipping direction and marking a signal dot the moment the stop switches sides. No configuration is required — attach to any chart and it runs immediately. The channel and stop are built entirely from MetaTrader's own iMA and iATR series. There is no external data source, no chart objects, and no on-chart panel
https://www.youtube.com/watch?v=OphoEfqqlH0
A candle tells you where price closed. It doesn't tell you where the volume actually traded inside the bar — this indicator does.
Each bar is broken down into individual price rows showing bid and ask volume at that level, built from MetaTrader's own tick feed and classified side-by-side as buy or sell pressure.
Point of Control marks the price with the heaviest volume in the bar. Value Area frames the band holding a configurable share of that volume, 70% by default.
Stacked Imbalance flags rows where one side dominates the other by a set ratio. Absorption catches large opposing volume soaked up at the bar's high or low without price following through. Unfinished Auction flags a close where the dominant side never faded at the extreme. Naked Point of Control keeps untested POC levels on the chart until price comes back for them.
A cumulative delta engine runs underneath with hysteresis-based reversal signals and delta divergence against price.
Forex has no consolidated tape, so tick volume — the industry-standard proxy every retail and institutional platform relies on — is the input. Where a broker reports real tick-level volume, the indicator uses it directly; where it doesn't, the footprint is built from tick count exactly as documented, no interpolation or invented data filling the gaps.
Part of the Global Investing suite, alongside the Global Investing FX Terminal, CSI Currency Strength, Carry Trade Monitor and Institutional Risk Manager.
Product: https://www.mql5.com/en/market/product/194111
Volume Footprint est un indicateur d'order flow par niveau de prix pour MetaTrader 5. Plutôt qu'une seule bougie, chaque barre est décomposée en lignes de prix individuelles montrant le volume bid et ask négocié à ce niveau — vous voyez ainsi exactement où acheteurs et vendeurs ont transigé à l'intérieur de la barre, et pas seulement où le prix a clôturé. L'indicateur agrège le flux de ticks du graphique sur une unité de temps inférieure (sélectionnée automatiquement par rapport à la période du
Retail EAs manage a stop loss. A trading desk manages exposure — that's the gap this update closes.
Portfolio exposure now checks both the base and quote leg of every pair, so three "independent" trades that are actually the same directional bet on one currency get caught, not undercounted — the same netting principle a bank FX desk applies across correlated books.
New live exposure monitor: alerts when a currency is already over the configured limit from price movement alone, even without opening a new trade from the panel.
New daily loss circuit breaker: a hard stop tied to start-of-day balance, with an optional force-close-all — the mechanical equivalent of a desk's daily loss limit.
New position-size caps: a hard max lot size and max notional per trade sit underneath the risk-based sizing as a backstop, independent of stop distance.
Risk Limits panel reorganized into tabs (Modules / Exposure / Daily Loss) for faster access.
Product: https://www.mql5.com/en/market/product/180324
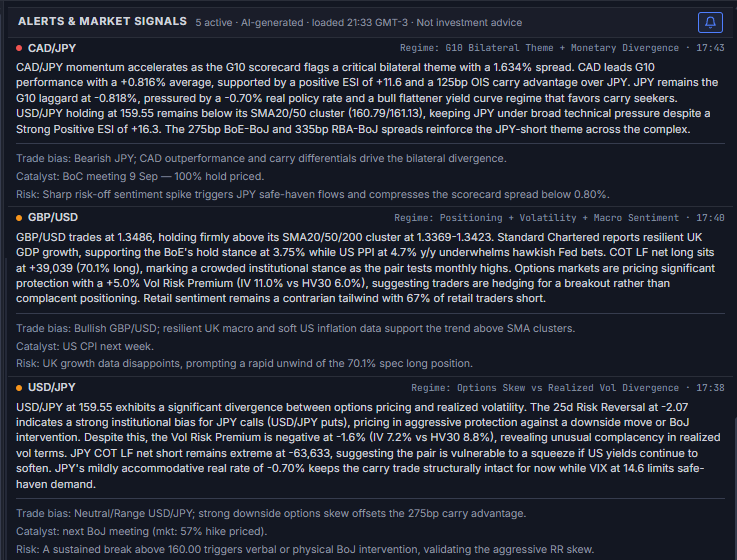
The terminal already consolidates price action, positioning, central bank rate expectations, and carry differentials in one screen. This release adds a layer on top: AI reading that same data in real time and producing the kind of read a desk analyst would deliver — without the analyst.
Three components:
Alerts & Market Signals — five live AI-generated alerts, each structured like an institutional morning note: regime (positioning, rate, or volatility story), directional bias, the catalyst that confirms or breaks the thesis, and the risk that invalidates it. Every field sourced from data already on the page.
AI Narrative — one paragraph, regenerated each session, synthesizing FX, rates, and risk sentiment into a single cross-market read.
AI Analytics — per-currency macro drivers, session-by-session commentary (Sydney, Tokyo, London, New York), and pair-by-pair strength attribution — not just which currency is outperforming, but the rate differential and positioning behind it.
Nothing here is a black box. Every number the AI references — carry spread, ESI reading, OIS-implied bias — is a panel you can open and verify on the same page.
Browser-based, broker-agnostic. The same alert logic also runs inside the MT5 companion tools for active EA rentals.
https://www.youtube.com/watch?v=Y44by1YJBVU
EUR is showing a policy/positioning divergence worth flagging today. Rates are pricing a hawkish bias — CB Rates & Bias shows EUR at 2.40% with a HIKE tag — in line with today's headline flow: ECB commentary described as hawkish, with Simkus reportedly raising the odds of a further move.
That stance sits against leveraged-fund COT positioning still net short EUR at -33.5%, and a Composite Score reading of -3.0.
Price action adds a second layer: EUR/USD is trading below its SMA20 (1.142), SMA50 (1.1507), and SMA200 (1.164) on the daily — technically heavy even as the rate-path narrative turns hawkish.
Hawkish bias, net-short positioning, and a technically heavy chart rarely stay aligned for long. Worth tracking into the next ECB meeting.
Sourced live from the EUR/USD Pair Detail panel.
Monte Carlo Equity Projection exécute une simulation bootstrap sur l'historique des trades clôturés de votre propre compte et projette directement sur le graphique un cône de percentiles des trajectoires futures de capital — sans distribution de rendement supposée, sans flux de données externe. Attachez-le à n'importe quel graphique : il lit les trades réels clôturés du compte via l'API native MT5, les rééchantillonne des milliers de fois avec remise, et trace l'éventail réaliste de résultats
Global Investing FX Terminal in Live Use: One Month on a Small Real Account
Le Global Investing FX Terminal est un dashboard FX tout-en-un pour MetaTrader 5 — taux directeurs des banques centrales, positionnement COT du CFTC, classements carry, surprises économiques, skew d'options, sentiment retail et corrélations, treize panneaux au total — restitué sur un unique canvas sans scintillement et mis à jour toutes les 10 secondes depuis un seul EA attaché. Aucun logiciel externe requis. L'analyse FX professionnelle nécessite un accès simultané à des données normalement
L' Institutional Risk Manager gère le calcul de la taille des positions, l'exécution des ordres, les sorties échelonnées, le trailing stop, la surveillance de l'exposition du portefeuille, les limites de perte quotidienne et les filtres liés aux actualités — le tout depuis un panneau unique sur le graphique dans MetaTrader 5. La taille du lot est calculée automatiquement à partir du solde du compte et de la distance au stop. Les sorties échelonnées s'exécutent selon des multiples de R
The Carry Trade Monitor is a chart indicator for MetaTrader 5 that automatically scans all symbols in the Market Watch and ranks every swap-paying pair by annualised carry yield, displayed as a live on-chart panel. No configuration is required — attach to any chart and it runs immediately. Carry yield calculations read directly from the broker's own swap specifications via the MT5 symbol feed. There is no external data source, no URL permission required, and no dependency on third-party rate
The CSI Currency Strength indicator ranks all ten G10 currencies by momentum strength using a multi-lookback Z-score model, displayed as a live on-chart panel. Attached to any chart, it runs independently of the chart's symbol or timeframe. The methodology follows the multi-horizon momentum framework from Asness, Moskowitz & Pedersen (2013), applied cross-sectionally to G10 currencies. Rather than comparing a single bar against the previous close — which introduces a cliff-edge artifact at