Santiago Nicolas Pla Casuriaga / Perfil
- Informações
|
no
experiência
|
7
produtos
|
3
versão demo
|
|
0
trabalhos
|
0
sinais
|
0
assinantes
|
Indicadores gratuitos
CSI Currency Strength — Modelo de momentum multi-lookback (Asness, Moskowitz & Pedersen 2013). Classifica as moedas G10 usando Z-scores ponderados em três horizontes de tempo, eliminando o artefato de "cliff-edge" das abordagens de período único. Carry Trade Monitor — Escaneia automaticamente o Market Watch e classifica todos os pares com swap pelo rendimento de carry anualizado. Não requer configuração. Monte Carlo Equity Projection — Simulação bootstrap sobre o histórico de operações encerradas da própria conta, projetando um cone de percentis de equity futura diretamente no gráfico. Sem distribuição de retorno assumida, sem fonte de dados externa — todo o cálculo roda localmente.
Premium
GI FX Terminal — O companheiro nativo para MT5 do terminal web. Os 13 painéis de dados renderizados em um único overlay canvas sem flicker: tabela de pares FX, CB Rates & Bias, Carry Trade Monitor (swaps ao vivo da corretora), Open Positions, COT Positioning, Composite Score, Retail Sentiment, Correlation Matrix, Economic Calendar, Economic Surprise Index (ESI), Currency Strength (CSI), Volatility & Options, e Market Sessions. Inclui um sistema completo de alertas — mudanças de viés do CB, mudanças de probabilidade de taxas, novos dados de COT, mudanças de swap, eventos de calendário de alto impacto — entregues como popups no MT5 ou notificações push para o app do MetaTrader 5. O aluguel inclui acesso completo ao terminal web.
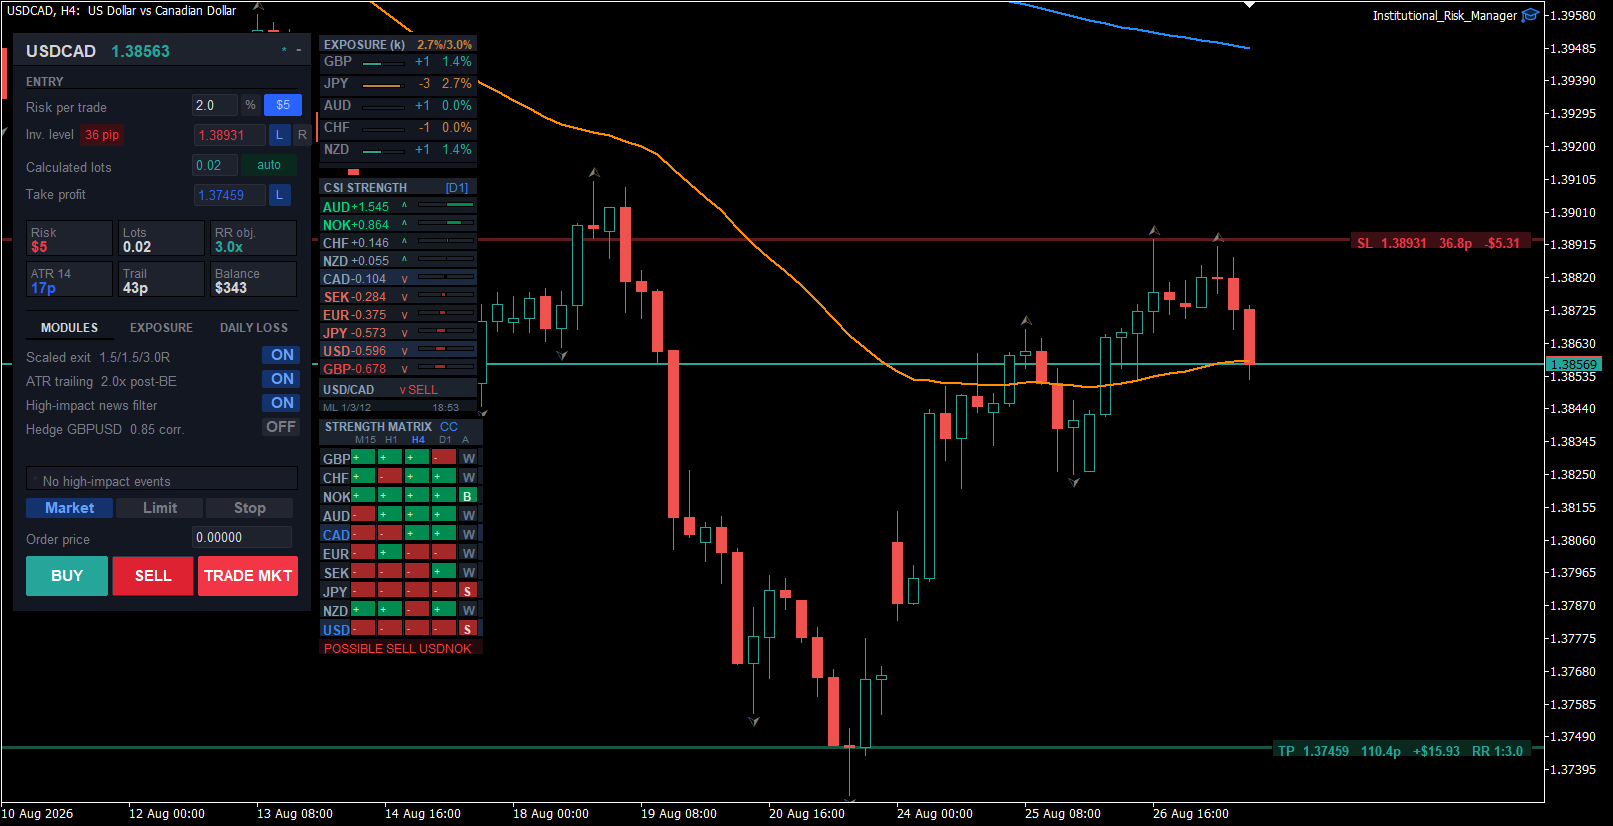
Institutional Risk Manager — EA profissional de gestão de operações. Dimensionamento de posição baseado em ATR, saídas escalonadas configuráveis, automação de breakeven, monitoramento de exposição de portfólio, módulo de hedge, e um subpainel integrado de CSI + Strength Matrix.
Todas as ferramentas compartilham uma estética monospace escura consistente e são projetadas para se complementar na mesma mesa de trading.
O acesso estendido ao terminal web para novos usuários pode ser combinado diretamente pela mensageria do MQL5.
https://www.youtube.com/watch?v=qPX_9m74k4E

https://www.youtube.com/watch?v=qPX_9m74k4E
The Keltner Bands Stop is a trend-following stop indicator for MetaTrader 5 that plots a self-adjusting stop-loss level on a Keltner Channel — an EMA midline plus/minus an ATR multiple — flipping direction and marking a signal dot the moment the stop switches sides. No configuration is required — attach to any chart and it runs immediately. The channel and stop are built entirely from MetaTrader's own iMA and iATR series. There is no external data source, no chart objects, and no on-chart panel
https://www.youtube.com/watch?v=OphoEfqqlH0
A candle tells you where price closed. It doesn't tell you where the volume actually traded inside the bar — this indicator does.
Each bar is broken down into individual price rows showing bid and ask volume at that level, built from MetaTrader's own tick feed and classified side-by-side as buy or sell pressure.
Point of Control marks the price with the heaviest volume in the bar. Value Area frames the band holding a configurable share of that volume, 70% by default.
Stacked Imbalance flags rows where one side dominates the other by a set ratio. Absorption catches large opposing volume soaked up at the bar's high or low without price following through. Unfinished Auction flags a close where the dominant side never faded at the extreme. Naked Point of Control keeps untested POC levels on the chart until price comes back for them.
A cumulative delta engine runs underneath with hysteresis-based reversal signals and delta divergence against price.
Forex has no consolidated tape, so tick volume — the industry-standard proxy every retail and institutional platform relies on — is the input. Where a broker reports real tick-level volume, the indicator uses it directly; where it doesn't, the footprint is built from tick count exactly as documented, no interpolation or invented data filling the gaps.
Part of the Global Investing suite, alongside the Global Investing FX Terminal, CSI Currency Strength, Carry Trade Monitor and Institutional Risk Manager.
Product: https://www.mql5.com/en/market/product/194111
Volume Footprint é um indicador de order flow por nível de preço para o MetaTrader 5. Em vez de uma única vela, cada barra é decomposta em linhas de preço individuais que mostram o volume bid e ask negociado naquele nível — assim você vê exatamente onde compradores e vendedores negociaram dentro da barra, e não apenas onde o preço fechou. O indicador agrega o fluxo de ticks do gráfico num timeframe menor (selecionado automaticamente em relação ao período do gráfico, ou fixado manualmente) e
Retail EAs manage a stop loss. A trading desk manages exposure — that's the gap this update closes.
Portfolio exposure now checks both the base and quote leg of every pair, so three "independent" trades that are actually the same directional bet on one currency get caught, not undercounted — the same netting principle a bank FX desk applies across correlated books.
New live exposure monitor: alerts when a currency is already over the configured limit from price movement alone, even without opening a new trade from the panel.
New daily loss circuit breaker: a hard stop tied to start-of-day balance, with an optional force-close-all — the mechanical equivalent of a desk's daily loss limit.
New position-size caps: a hard max lot size and max notional per trade sit underneath the risk-based sizing as a backstop, independent of stop distance.
Risk Limits panel reorganized into tabs (Modules / Exposure / Daily Loss) for faster access.
Product: https://www.mql5.com/en/market/product/180324
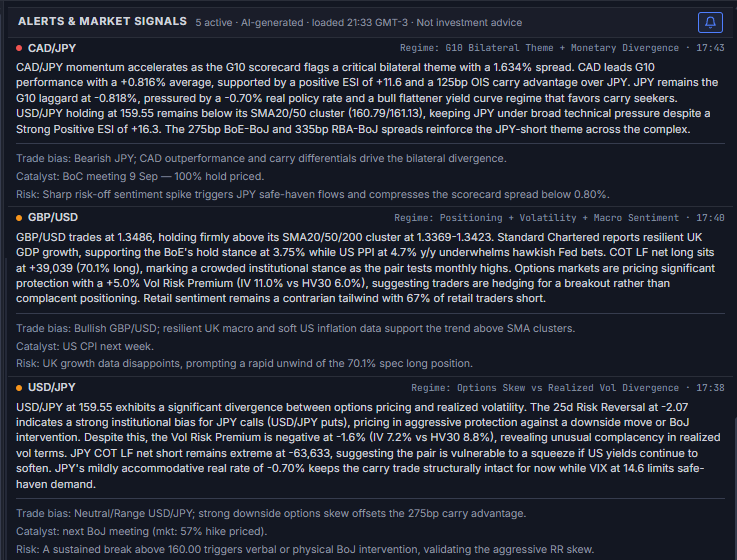
The terminal already consolidates price action, positioning, central bank rate expectations, and carry differentials in one screen. This release adds a layer on top: AI reading that same data in real time and producing the kind of read a desk analyst would deliver — without the analyst.
Three components:
Alerts & Market Signals — five live AI-generated alerts, each structured like an institutional morning note: regime (positioning, rate, or volatility story), directional bias, the catalyst that confirms or breaks the thesis, and the risk that invalidates it. Every field sourced from data already on the page.
AI Narrative — one paragraph, regenerated each session, synthesizing FX, rates, and risk sentiment into a single cross-market read.
AI Analytics — per-currency macro drivers, session-by-session commentary (Sydney, Tokyo, London, New York), and pair-by-pair strength attribution — not just which currency is outperforming, but the rate differential and positioning behind it.
Nothing here is a black box. Every number the AI references — carry spread, ESI reading, OIS-implied bias — is a panel you can open and verify on the same page.
Browser-based, broker-agnostic. The same alert logic also runs inside the MT5 companion tools for active EA rentals.
https://www.youtube.com/watch?v=Y44by1YJBVU
EUR is showing a policy/positioning divergence worth flagging today. Rates are pricing a hawkish bias — CB Rates & Bias shows EUR at 2.40% with a HIKE tag — in line with today's headline flow: ECB commentary described as hawkish, with Simkus reportedly raising the odds of a further move.
That stance sits against leveraged-fund COT positioning still net short EUR at -33.5%, and a Composite Score reading of -3.0.
Price action adds a second layer: EUR/USD is trading below its SMA20 (1.142), SMA50 (1.1507), and SMA200 (1.164) on the daily — technically heavy even as the rate-path narrative turns hawkish.
Hawkish bias, net-short positioning, and a technically heavy chart rarely stay aligned for long. Worth tracking into the next ECB meeting.
Sourced live from the EUR/USD Pair Detail panel.
Monte Carlo Equity Projection executa uma simulação bootstrap sobre o histórico de operações encerradas da sua própria conta e projeta um cone de percentis das trajetórias futuras de capital diretamente no gráfico — sem distribuição de retornos assumida, sem fonte de dados externa. Anexe a qualquer gráfico: o indicador lê as operações encerradas reais da conta via API nativa do MT5, reamostra-as milhares de vezes com reposição e traça o intervalo realista de resultados implícito pelas suas
O Global Investing FX Terminal é um dashboard de FX completo para o MetaTrader 5 — taxas de política monetária, posicionamento COT do CFTC, rankings de carry, surpresas econômicas, skew de opções, sentimento de varejo e correlações, treze painéis ao todo — renderizado sobre um único overlay canvas sem flicker, com atualização a cada 10 segundos a partir de um único EA. Nenhum software externo é necessário. A análise profissional de câmbio exige acesso simultâneo a dados que normalmente ficam
O Institutional Risk Manager gerencia o dimensionamento de posições, a execução de ordens, as saídas escalonadas, o trailing stop, o monitoramento de exposição da carteira, os limites de perda diária e os filtros por notícias — tudo a partir de um único painel sobre o gráfico no MetaTrader 5. O tamanho do lote é calculado automaticamente a partir do saldo da conta e da distância ao stop. As saídas escalonadas são executadas em múltiplos de R configuráveis, com um TP do lado da corretora no alvo
The Carry Trade Monitor is a chart indicator for MetaTrader 5 that automatically scans all symbols in the Market Watch and ranks every swap-paying pair by annualised carry yield, displayed as a live on-chart panel. No configuration is required — attach to any chart and it runs immediately. Carry yield calculations read directly from the broker's own swap specifications via the MT5 symbol feed. There is no external data source, no URL permission required, and no dependency on third-party rate
The CSI Currency Strength indicator ranks all ten G10 currencies by momentum strength using a multi-lookback Z-score model, displayed as a live on-chart panel. Attached to any chart, it runs independently of the chart's symbol or timeframe. The methodology follows the multi-horizon momentum framework from Asness, Moskowitz & Pedersen (2013), applied cross-sectionally to G10 currencies. Rather than comparing a single bar against the previous close — which introduces a cliff-edge artifact at