Santiago Nicolas Pla Casuriaga / Профиль
- Информация
|
нет
опыт работы
|
7
продуктов
|
3
демо-версий
|
|
0
работ
|
0
сигналов
|
0
подписчиков
|
Бесплатные индикаторы
CSI Currency Strength — Модель моментума с несколькими периодами анализа (Asness, Moskowitz & Pedersen, 2013). Ранжирует валюты G10 с использованием взвешенных Z-оценок по трём временным горизонтам, устраняя эффект "cliff-edge", присущий подходам с одним периодом. Carry Trade Monitor — Автоматически сканирует Market Watch и ранжирует все пары со свопом по годовой доходности carry. Настройка не требуется. Monte Carlo Equity Projection — Bootstrap-симуляция на основе истории закрытых сделок собственного счёта, строящая на графике конус процентилей будущей динамики эквити. Без предполагаемого распределения доходности, без внешнего источника данных — все вычисления выполняются локально.
Премиум
GI FX Terminal — Нативный MT5-компаньон веб-терминала. Все 13 панелей данных отрисованы на едином canvas-оверлее без мерцания: таблица пар FX, CB Rates & Bias, Carry Trade Monitor (live своп-ставки брокера), Open Positions, COT Positioning, Composite Score, Retail Sentiment, Correlation Matrix, Economic Calendar, Economic Surprise Index (ESI), Currency Strength (CSI), Volatility & Options и Market Sessions. Включает полноценную систему оповещений — изменения склонности CB, изменения вероятности ставок, новые данные COT, изменения свопов, календарные события с высоким влиянием — доставляемых как всплывающие окна MT5 или push-уведомления на мобильное приложение MetaTrader 5. Аренда включает полный доступ к веб-терминалу.
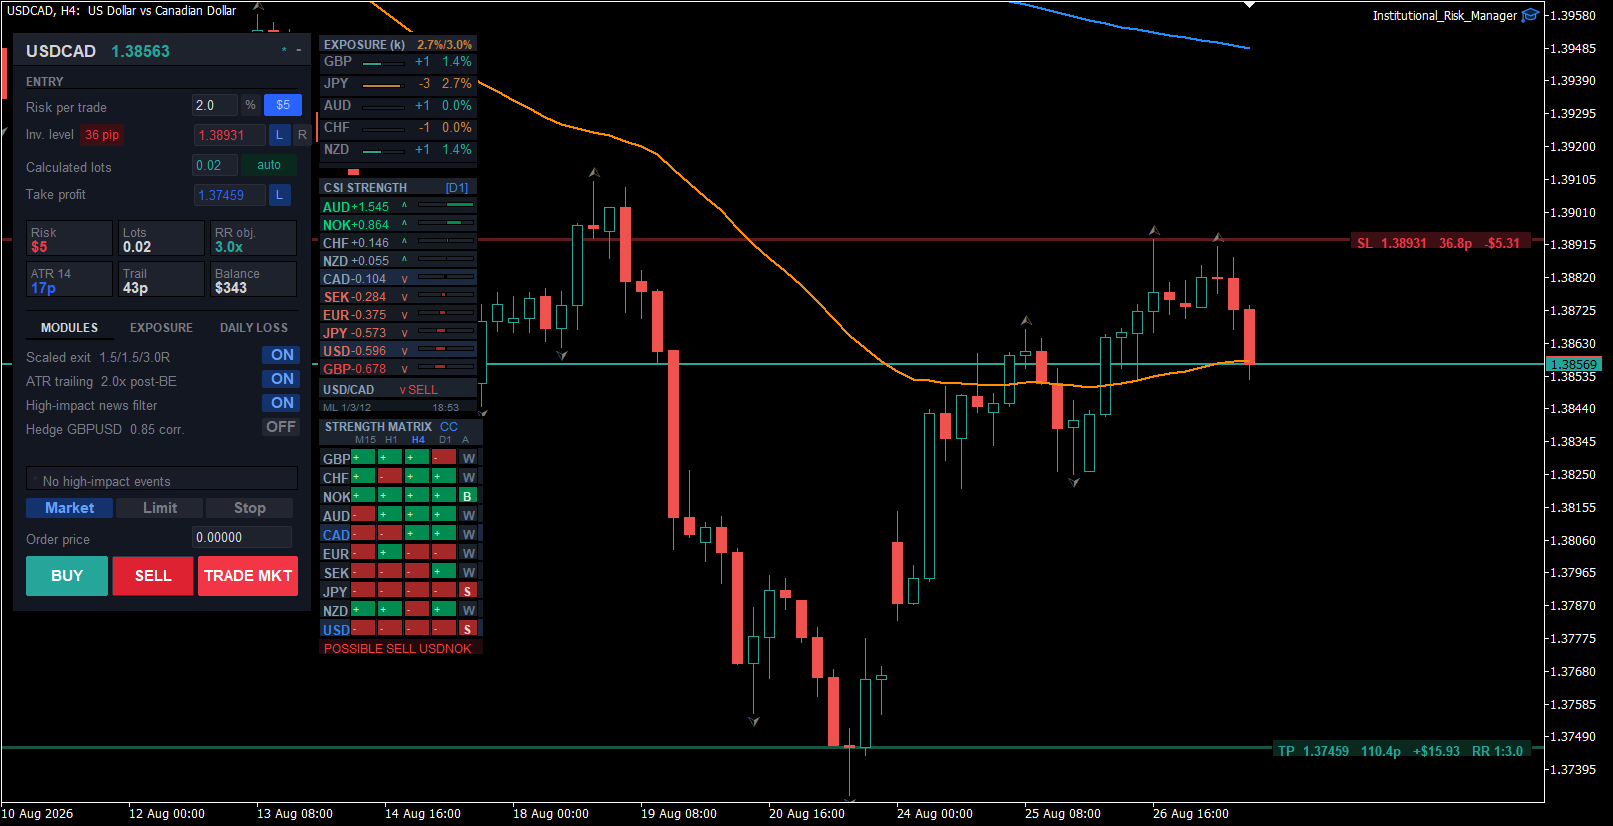
Institutional Risk Manager — Профессиональный EA для управления сделками. Расчёт размера позиции на основе ATR, настраиваемые ступенчатые выходы, автоматизация безубытка, мониторинг экспозиции портфеля, модуль хеджирования и встроенная суб-панель CSI + Strength Matrix.
Все инструменты объединяет единая тёмная моноширинная эстетика и рассчитаны на взаимодополнение на одном торговом столе.
Расширенный доступ к веб-терминалу для новых пользователей можно согласовать напрямую через сообщения MQL5.
https://www.youtube.com/watch?v=qPX_9m74k4E

https://www.youtube.com/watch?v=qPX_9m74k4E
The Keltner Bands Stop is a trend-following stop indicator for MetaTrader 5 that plots a self-adjusting stop-loss level on a Keltner Channel — an EMA midline plus/minus an ATR multiple — flipping direction and marking a signal dot the moment the stop switches sides. No configuration is required — attach to any chart and it runs immediately. The channel and stop are built entirely from MetaTrader's own iMA and iATR series. There is no external data source, no chart objects, and no on-chart panel
https://www.youtube.com/watch?v=OphoEfqqlH0
A candle tells you where price closed. It doesn't tell you where the volume actually traded inside the bar — this indicator does.
Each bar is broken down into individual price rows showing bid and ask volume at that level, built from MetaTrader's own tick feed and classified side-by-side as buy or sell pressure.
Point of Control marks the price with the heaviest volume in the bar. Value Area frames the band holding a configurable share of that volume, 70% by default.
Stacked Imbalance flags rows where one side dominates the other by a set ratio. Absorption catches large opposing volume soaked up at the bar's high or low without price following through. Unfinished Auction flags a close where the dominant side never faded at the extreme. Naked Point of Control keeps untested POC levels on the chart until price comes back for them.
A cumulative delta engine runs underneath with hysteresis-based reversal signals and delta divergence against price.
Forex has no consolidated tape, so tick volume — the industry-standard proxy every retail and institutional platform relies on — is the input. Where a broker reports real tick-level volume, the indicator uses it directly; where it doesn't, the footprint is built from tick count exactly as documented, no interpolation or invented data filling the gaps.
Part of the Global Investing suite, alongside the Global Investing FX Terminal, CSI Currency Strength, Carry Trade Monitor and Institutional Risk Manager.
Product: https://www.mql5.com/en/market/product/194111
Volume Footprint — индикатор ордер-флоу для MetaTrader 5, показывающий объём по каждому ценовому уровню. Вместо единой свечи каждый бар разбивается на отдельные ценовые строки с объёмом bid и ask на этом уровне — вы видите не только цену закрытия, а именно где внутри бара покупатели и продавцы совершали сделки. Индикатор агрегирует тиковый поток графика на младшем таймфрейме (выбирается автоматически относительно периода графика или задаётся вручную) и классифицирует каждый тик как сделку по bid
Retail EAs manage a stop loss. A trading desk manages exposure — that's the gap this update closes.
Portfolio exposure now checks both the base and quote leg of every pair, so three "independent" trades that are actually the same directional bet on one currency get caught, not undercounted — the same netting principle a bank FX desk applies across correlated books.
New live exposure monitor: alerts when a currency is already over the configured limit from price movement alone, even without opening a new trade from the panel.
New daily loss circuit breaker: a hard stop tied to start-of-day balance, with an optional force-close-all — the mechanical equivalent of a desk's daily loss limit.
New position-size caps: a hard max lot size and max notional per trade sit underneath the risk-based sizing as a backstop, independent of stop distance.
Risk Limits panel reorganized into tabs (Modules / Exposure / Daily Loss) for faster access.
Product: https://www.mql5.com/en/market/product/180324
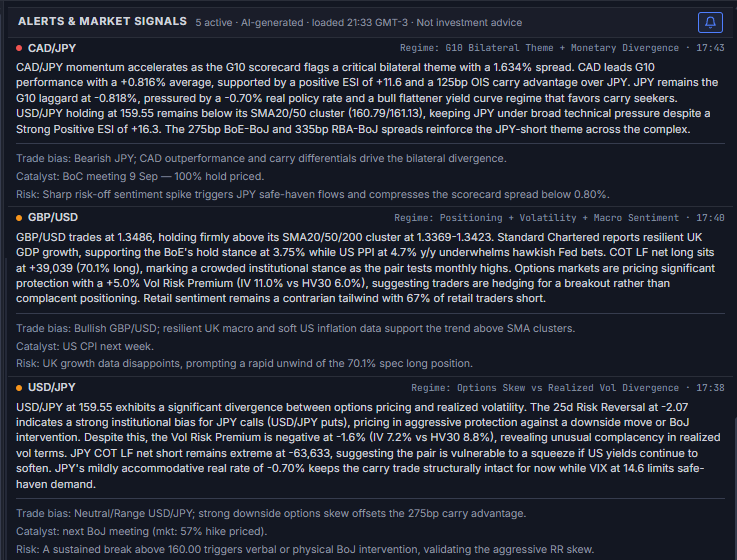
The terminal already consolidates price action, positioning, central bank rate expectations, and carry differentials in one screen. This release adds a layer on top: AI reading that same data in real time and producing the kind of read a desk analyst would deliver — without the analyst.
Three components:
Alerts & Market Signals — five live AI-generated alerts, each structured like an institutional morning note: regime (positioning, rate, or volatility story), directional bias, the catalyst that confirms or breaks the thesis, and the risk that invalidates it. Every field sourced from data already on the page.
AI Narrative — one paragraph, regenerated each session, synthesizing FX, rates, and risk sentiment into a single cross-market read.
AI Analytics — per-currency macro drivers, session-by-session commentary (Sydney, Tokyo, London, New York), and pair-by-pair strength attribution — not just which currency is outperforming, but the rate differential and positioning behind it.
Nothing here is a black box. Every number the AI references — carry spread, ESI reading, OIS-implied bias — is a panel you can open and verify on the same page.
Browser-based, broker-agnostic. The same alert logic also runs inside the MT5 companion tools for active EA rentals.
https://www.youtube.com/watch?v=Y44by1YJBVU
EUR is showing a policy/positioning divergence worth flagging today. Rates are pricing a hawkish bias — CB Rates & Bias shows EUR at 2.40% with a HIKE tag — in line with today's headline flow: ECB commentary described as hawkish, with Simkus reportedly raising the odds of a further move.
That stance sits against leveraged-fund COT positioning still net short EUR at -33.5%, and a Composite Score reading of -3.0.
Price action adds a second layer: EUR/USD is trading below its SMA20 (1.142), SMA50 (1.1507), and SMA200 (1.164) on the daily — technically heavy even as the rate-path narrative turns hawkish.
Hawkish bias, net-short positioning, and a technically heavy chart rarely stay aligned for long. Worth tracking into the next ECB meeting.
Sourced live from the EUR/USD Pair Detail panel.
Monte Carlo Equity Projection выполняет бутстреп-симуляцию на основе истории закрытых сделок вашего счёта и строит процентильный конус будущих траекторий депозита прямо на графике — без предполагаемого распределения доходности, без внешнего источника данных. Подключите индикатор к любому графику — он считывает реальные закрытые сделки счёта через нативный API MT5, пересэмплирует их тысячи раз с возвращением и строит реалистичный диапазон исходов, вытекающий из вашей текущей статистики, а не
Global Investing FX Terminal — это комплексный FX-дашборд для MetaTrader 5 — процентные ставки центральных банков, позиции COT CFTC, рэнкинг carry, индексы экономических сюрпризов, перекос опционов, настроения ритейла и корреляции, тринадцать панелей в общей сложности — отображается на едином канвасе без мерцания и обновляется каждые 10 секунд через один прикреплённый EA. Никаких внешних программ не требуется. Профессиональный анализ валютного рынка требует одновременного доступа к данным
Institutional Risk Manager управляет расчётом объёма позиции, исполнением ордеров, поэтапным выходом из позиции, трейлинг-стопом, мониторингом риска по портфелю, дневными лимитами убытка и фильтрами по новостям — всё с единой панели на графике в MetaTrader 5. Объём лота рассчитывается автоматически исходя из баланса счёта и расстояния до стоп-лосса. Поэтапный выход исполняется по настраиваемым множителям R, а финальный тейк-профит выставляется на стороне брокера, чтобы выход сработал, даже если
The Carry Trade Monitor is a chart indicator for MetaTrader 5 that automatically scans all symbols in the Market Watch and ranks every swap-paying pair by annualised carry yield, displayed as a live on-chart panel. No configuration is required — attach to any chart and it runs immediately. Carry yield calculations read directly from the broker's own swap specifications via the MT5 symbol feed. There is no external data source, no URL permission required, and no dependency on third-party rate
The CSI Currency Strength indicator ranks all ten G10 currencies by momentum strength using a multi-lookback Z-score model, displayed as a live on-chart panel. Attached to any chart, it runs independently of the chart's symbol or timeframe. The methodology follows the multi-horizon momentum framework from Asness, Moskowitz & Pedersen (2013), applied cross-sectionally to G10 currencies. Rather than comparing a single bar against the previous close — which introduces a cliff-edge artifact at