|
no
experience
|
7
products
|
3
demo versions
|
|
0
jobs
|
0
signals
|
0
subscribers
|
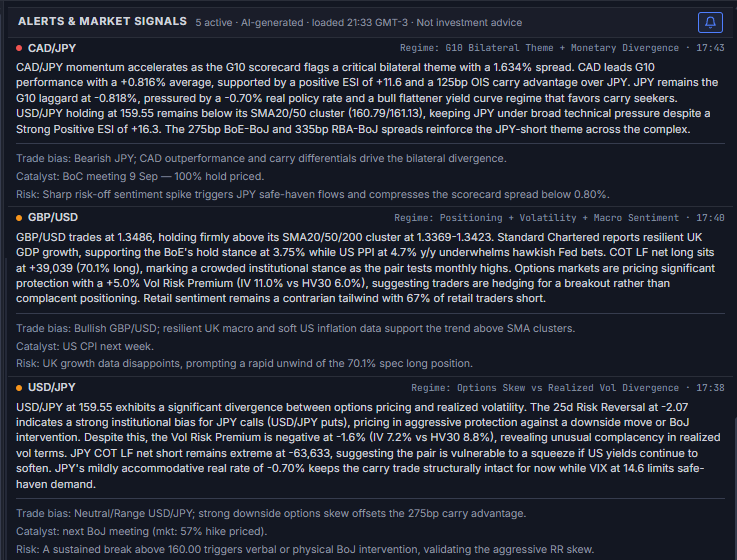
Global Investing builds professional-grade FX analytics tools for MetaTrader 5, complemented by a self-updating web terminal at global-investing.pages.dev. The web terminal covers live G10 pricing, CFTC COT positioning, carry trade rankings, central bank policy bias and OIS-implied rate expectations, retail sentiment, economic surprise scoring (ESI), yield curves and sovereign spreads, cross-asset risk regime, derivatives market structure (CIP forwards, risk reversal surface, DTCC OTC flow), and AI-generated macro coverage — live Market Signals, a session-by-session AI Narrative, and per-currency AI Analytics — regenerated at every major session open.
Free indicators
CSI Currency Strength — Multi-lookback momentum model (Asness, Moskowitz & Pedersen 2013). Ranks G10 currencies using weighted Z-scores across three time horizons, eliminating the cliff-edge artifact of single-period approaches.
Carry Trade Monitor — Auto-scans Market Watch and ranks all swap-paying pairs by annualised carry yield. No configuration required.
Monte Carlo Equity Projection — Bootstrap simulation on your account's own closed-trade history, projecting a percentile cone of future equity paths directly on the chart. No assumed return distribution, no external data feed — all computation runs locally.
Premium
GI FX Terminal — The native MT5 companion to the web terminal. All 13 data panels rendered on a single zero-flicker canvas overlay: FX Pairs table, CB Rates & Bias, Carry Trade Monitor (live broker swap rates), Open Positions, COT Positioning, Composite Score, Retail Sentiment, Correlation Matrix, Economic Calendar, Economic Surprise Index (ESI), Currency Strength (CSI), Volatility & Options, and Market Sessions. Includes a full alert system — CB bias shifts, rate probability changes, new COT data, swap rate changes, high-impact calendar events — delivered as MT5 popups or mobile push notifications via the MetaTrader 5 app. Rental includes full access to the web terminal.
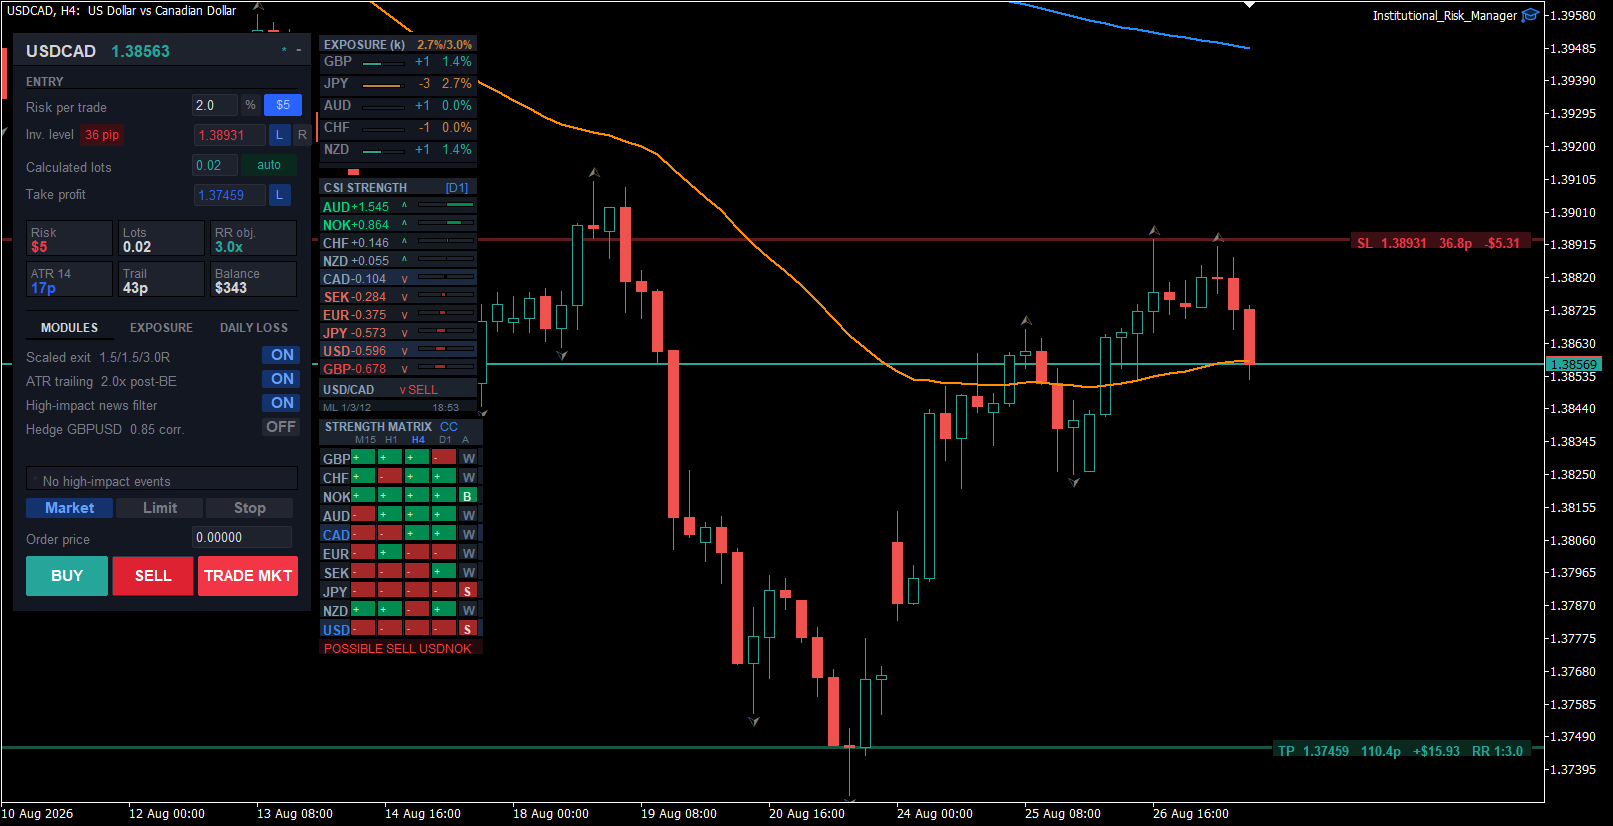
Institutional Risk Manager — Professional trade management EA. ATR-based position sizing, configurable scaled exits, breakeven automation, portfolio exposure monitoring, hedge module, and an integrated CSI + Strength Matrix sub-panel.
All tools share a consistent dark monospace aesthetic and are designed to complement each other on the same trading desk.
Extended web terminal access for new users can be arranged directly through MQL5 messaging.
Free indicators
CSI Currency Strength — Multi-lookback momentum model (Asness, Moskowitz & Pedersen 2013). Ranks G10 currencies using weighted Z-scores across three time horizons, eliminating the cliff-edge artifact of single-period approaches.
Carry Trade Monitor — Auto-scans Market Watch and ranks all swap-paying pairs by annualised carry yield. No configuration required.
Monte Carlo Equity Projection — Bootstrap simulation on your account's own closed-trade history, projecting a percentile cone of future equity paths directly on the chart. No assumed return distribution, no external data feed — all computation runs locally.
Premium
GI FX Terminal — The native MT5 companion to the web terminal. All 13 data panels rendered on a single zero-flicker canvas overlay: FX Pairs table, CB Rates & Bias, Carry Trade Monitor (live broker swap rates), Open Positions, COT Positioning, Composite Score, Retail Sentiment, Correlation Matrix, Economic Calendar, Economic Surprise Index (ESI), Currency Strength (CSI), Volatility & Options, and Market Sessions. Includes a full alert system — CB bias shifts, rate probability changes, new COT data, swap rate changes, high-impact calendar events — delivered as MT5 popups or mobile push notifications via the MetaTrader 5 app. Rental includes full access to the web terminal.
Institutional Risk Manager — Professional trade management EA. ATR-based position sizing, configurable scaled exits, breakeven automation, portfolio exposure monitoring, hedge module, and an integrated CSI + Strength Matrix sub-panel.
All tools share a consistent dark monospace aesthetic and are designed to complement each other on the same trading desk.
Extended web terminal access for new users can be arranged directly through MQL5 messaging.